INFLATION’S IMPACT ON RETAIL SALES GROWTH – July 2025
Inflation seems simple – just compare this year’s prices to the same time last year. In fact, it is more complex. The most important thing to remember is that it is cumulative so even when the YOY rate slows, it can cause a range of issues – selling less product and even a drop in $. One impact that is often ignored is slowed $ growth. That is the focus of this report. To give a better view of the situation we will include charts covering Jan>Jul 25 for the Big Groups and the “Advance” Relevant Retail Channels. We will include separate charts for Monthly & Ytd data to better show trends.
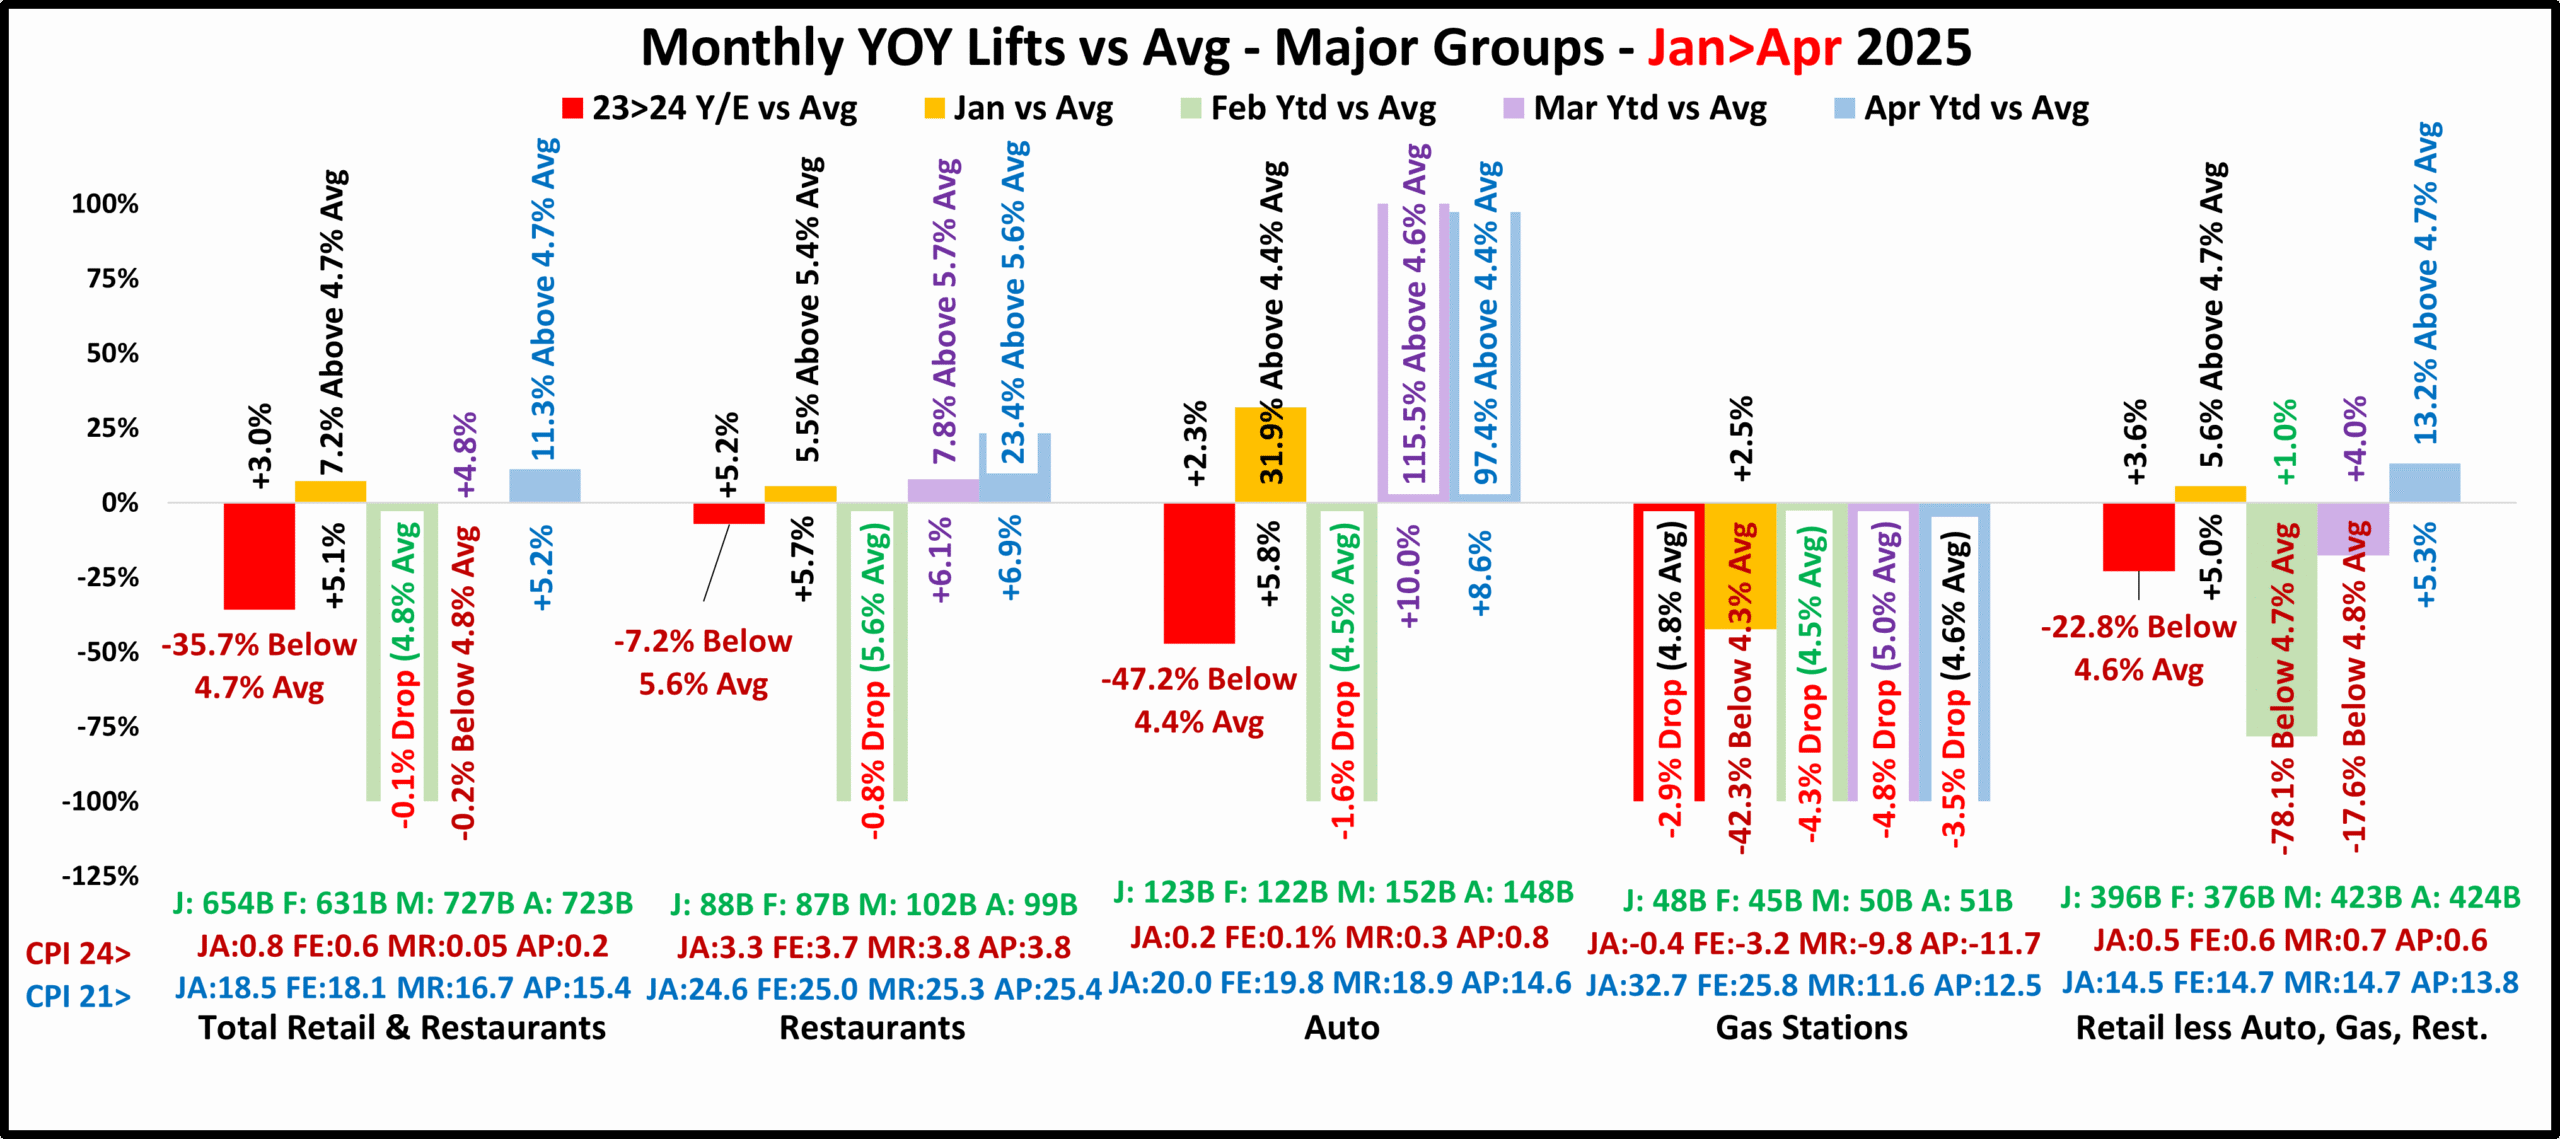
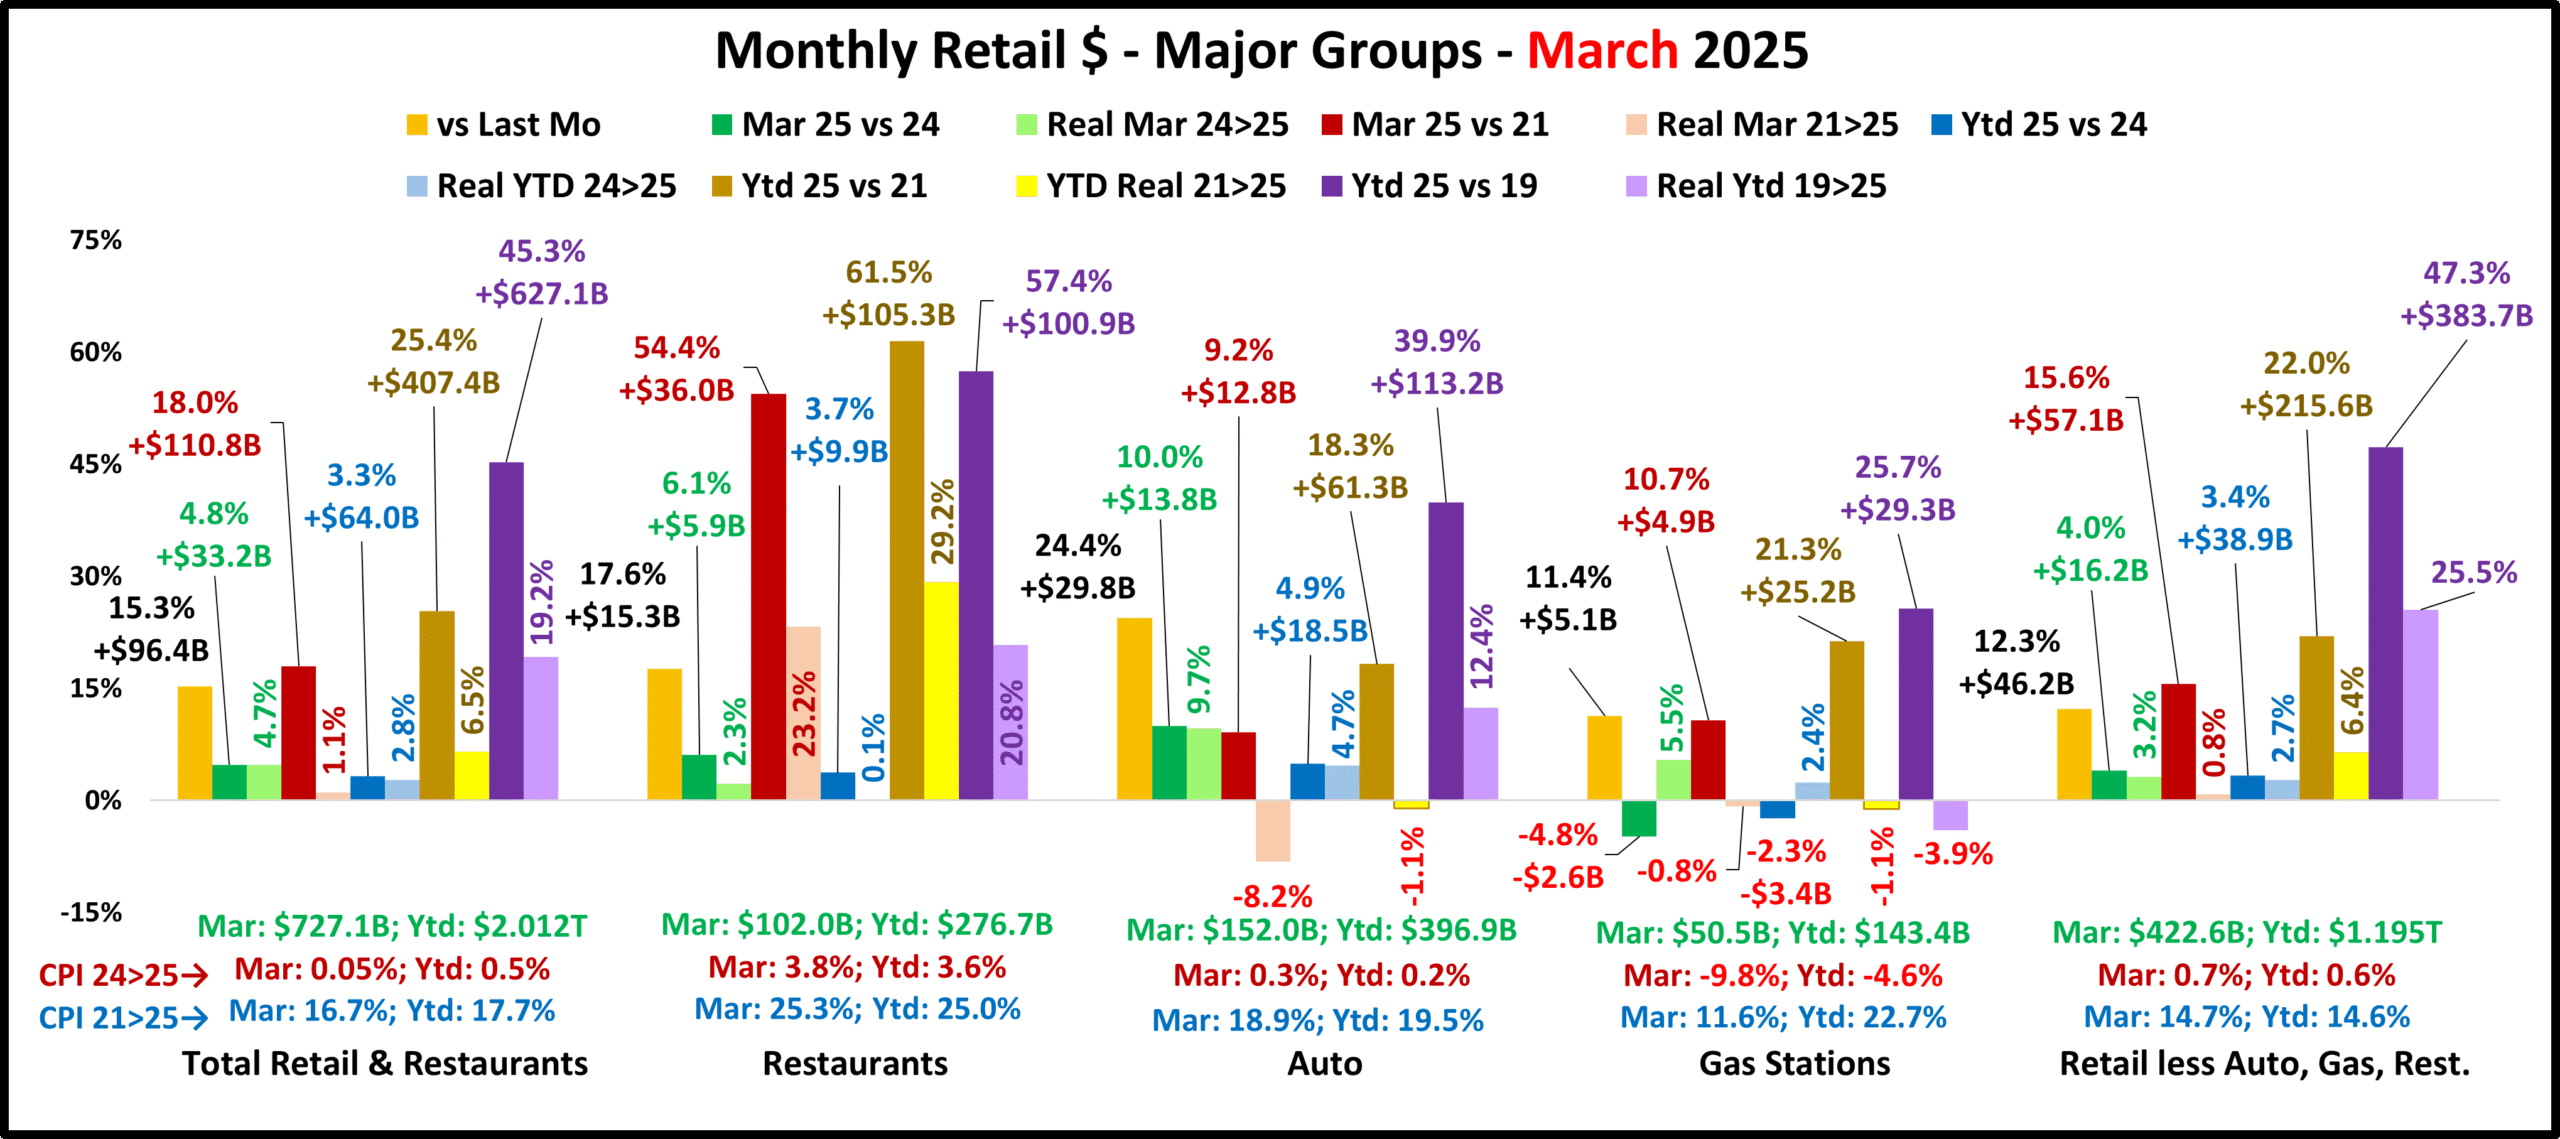
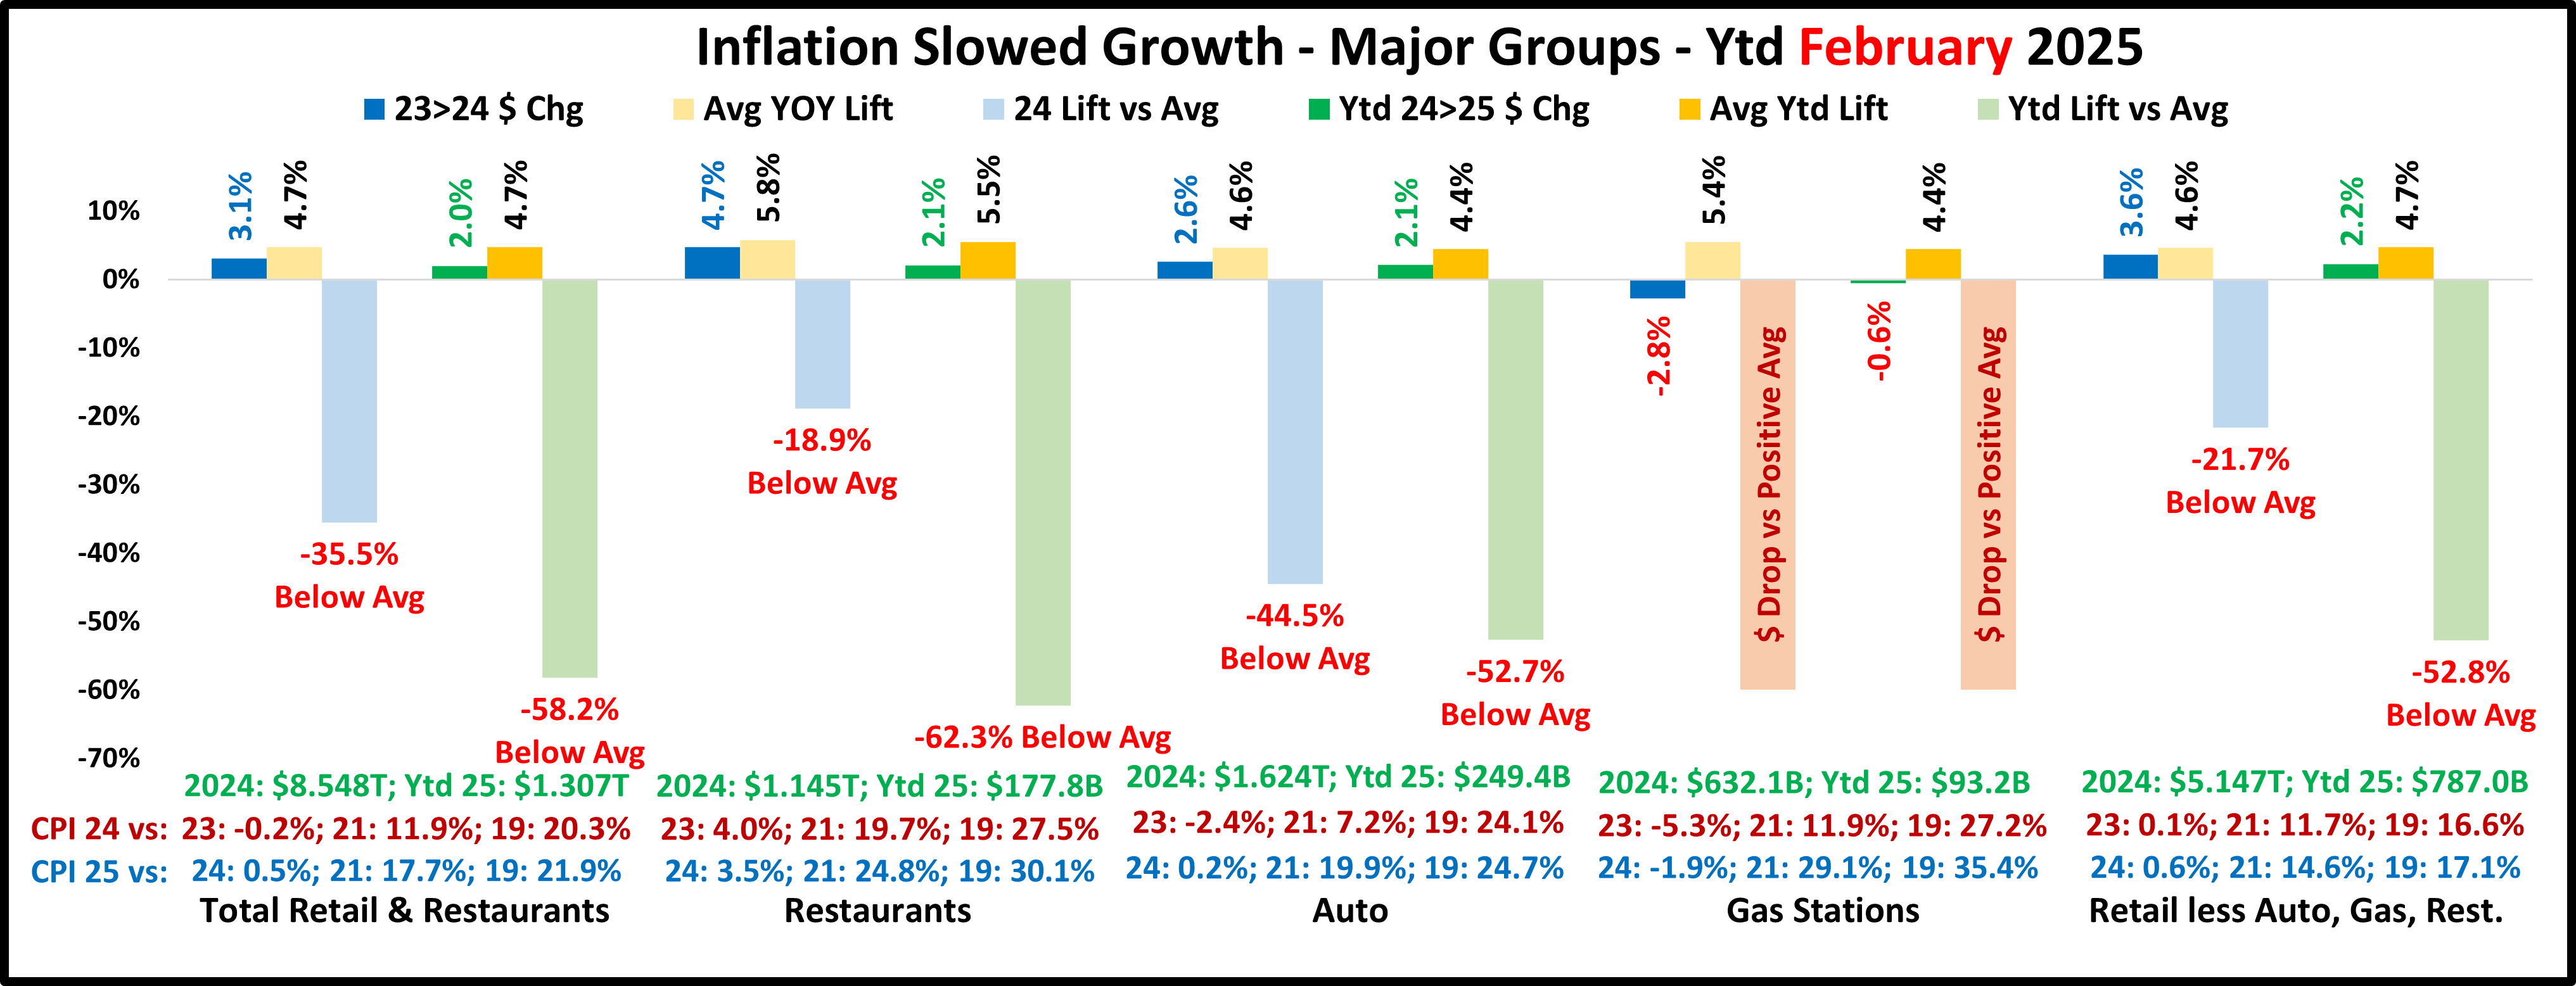
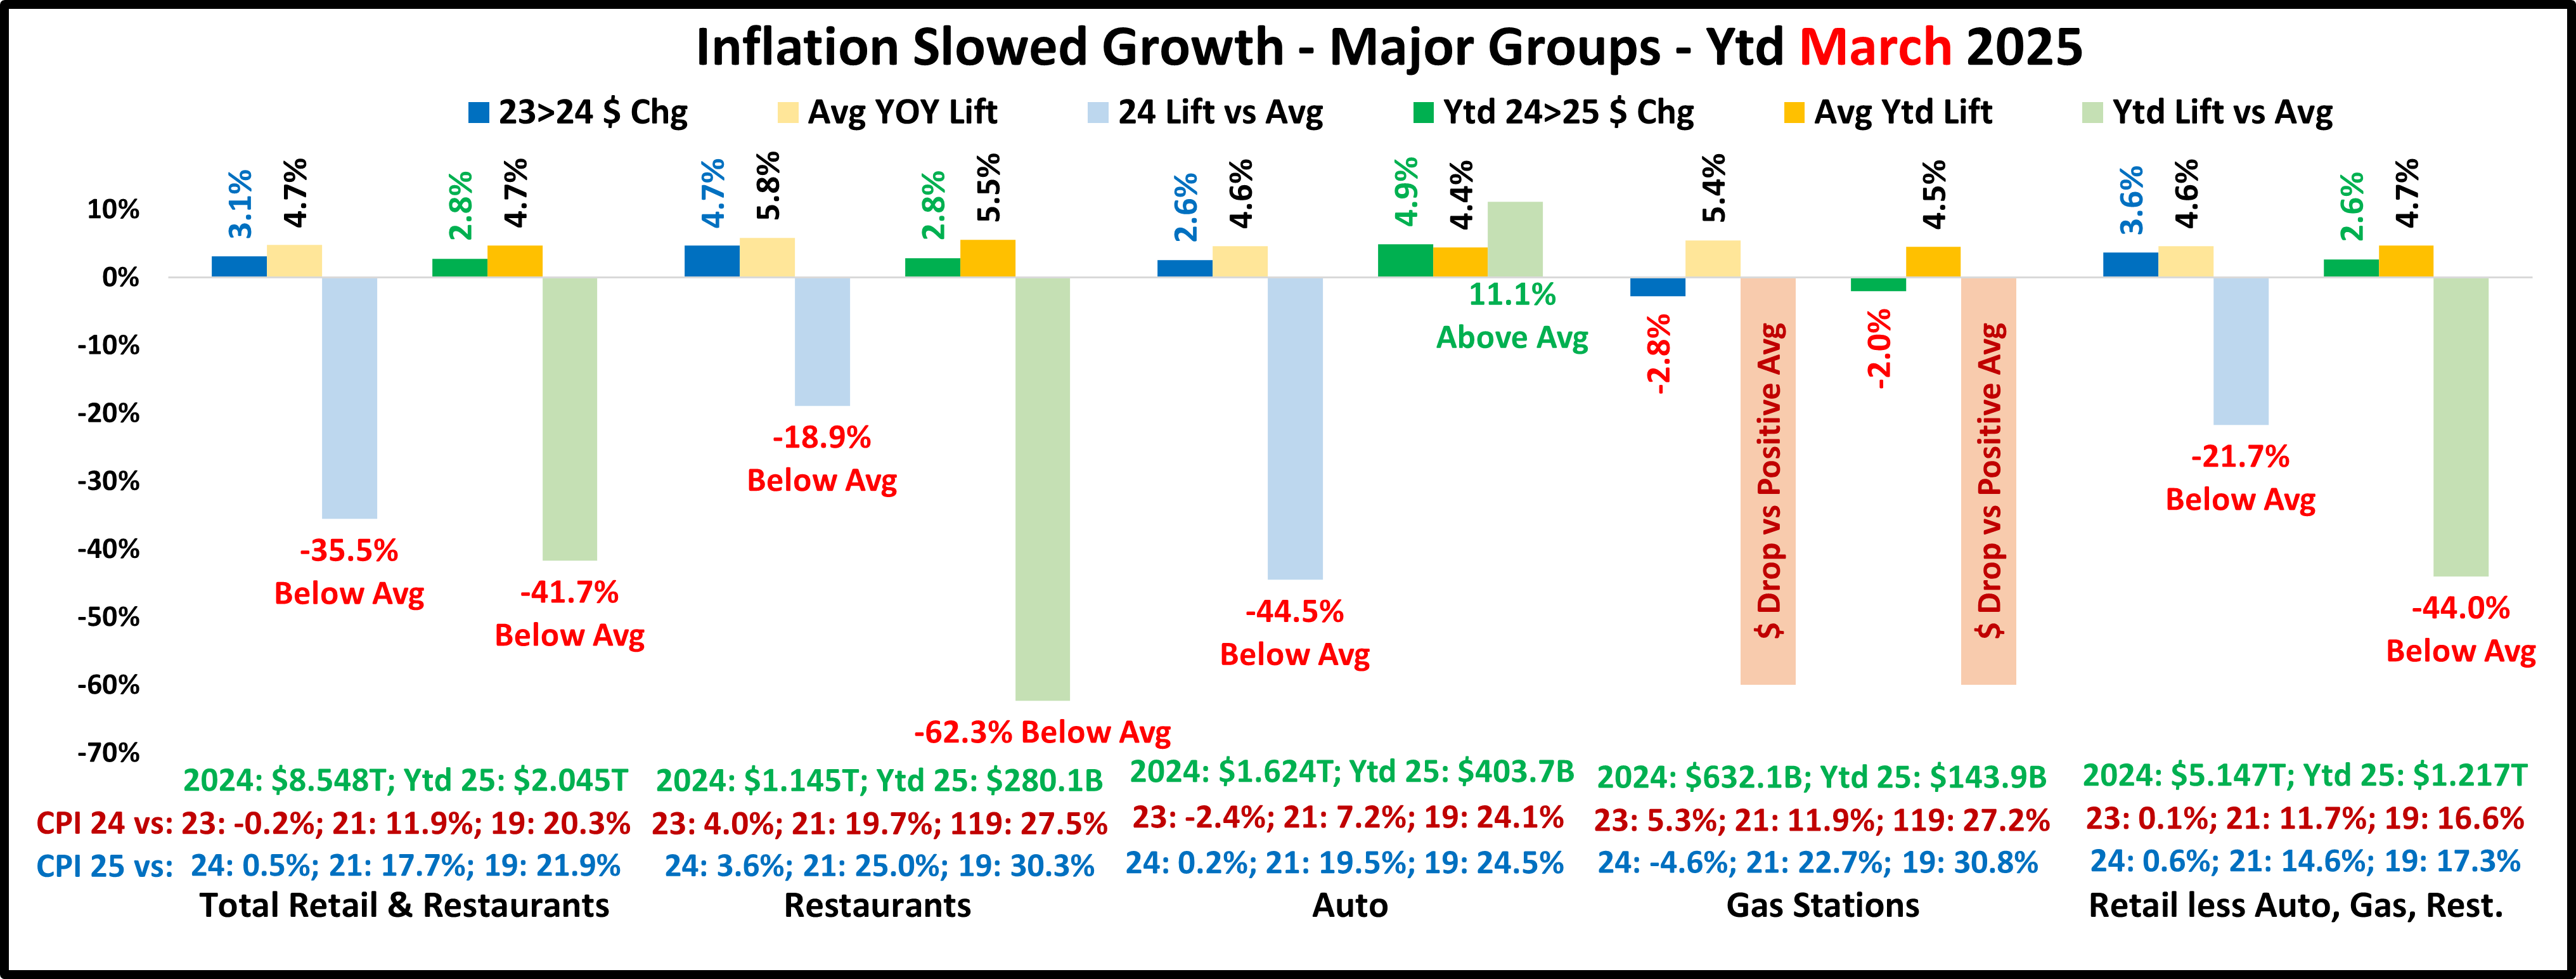
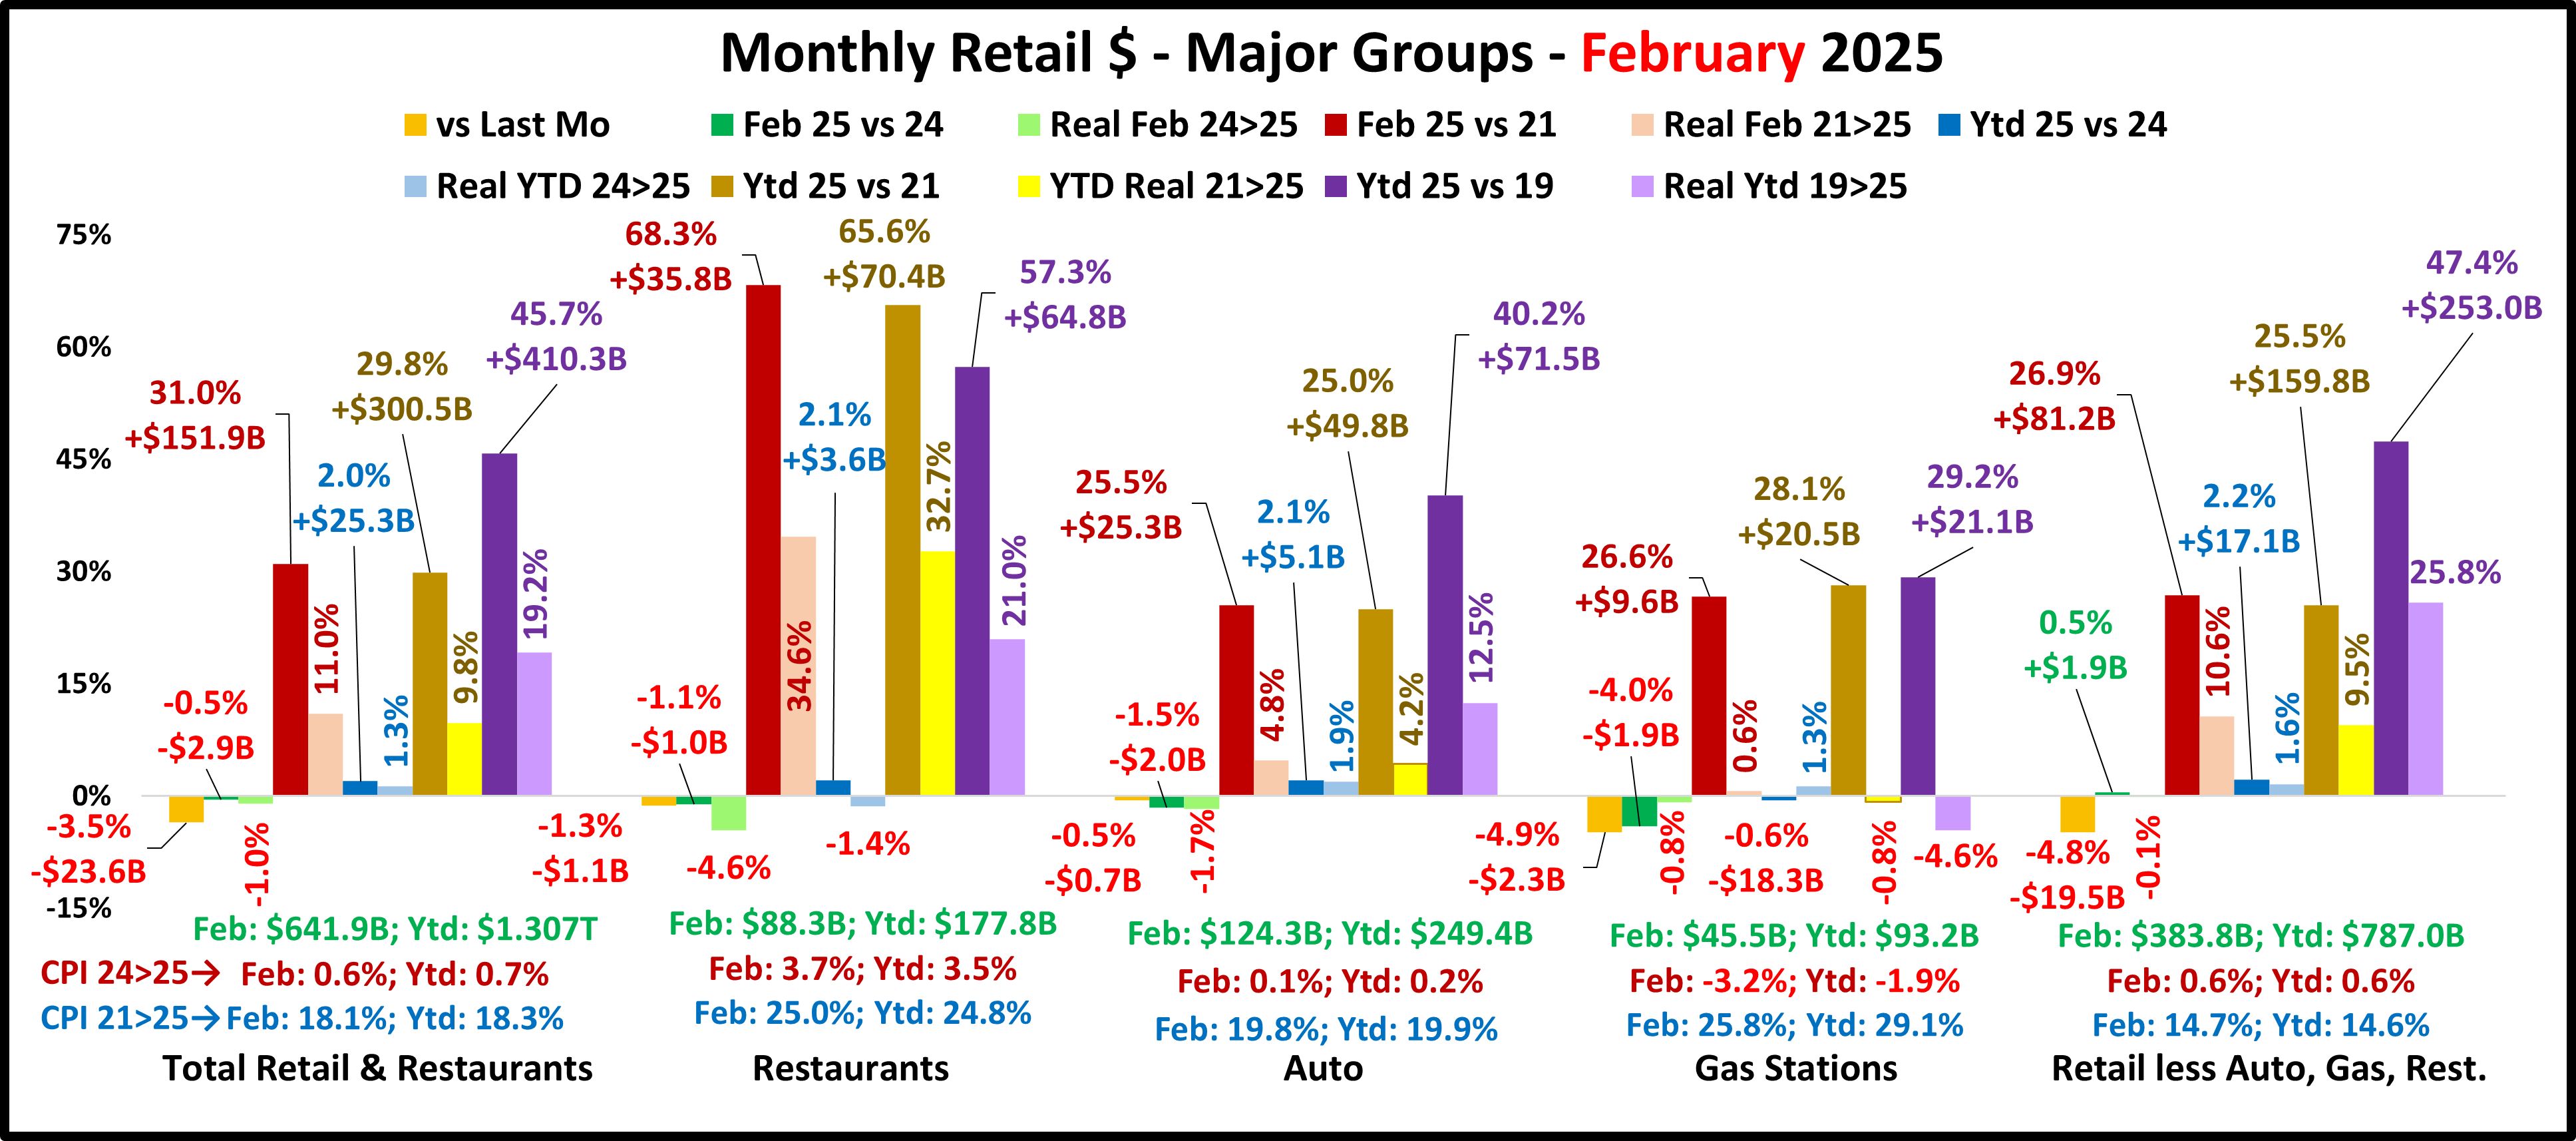
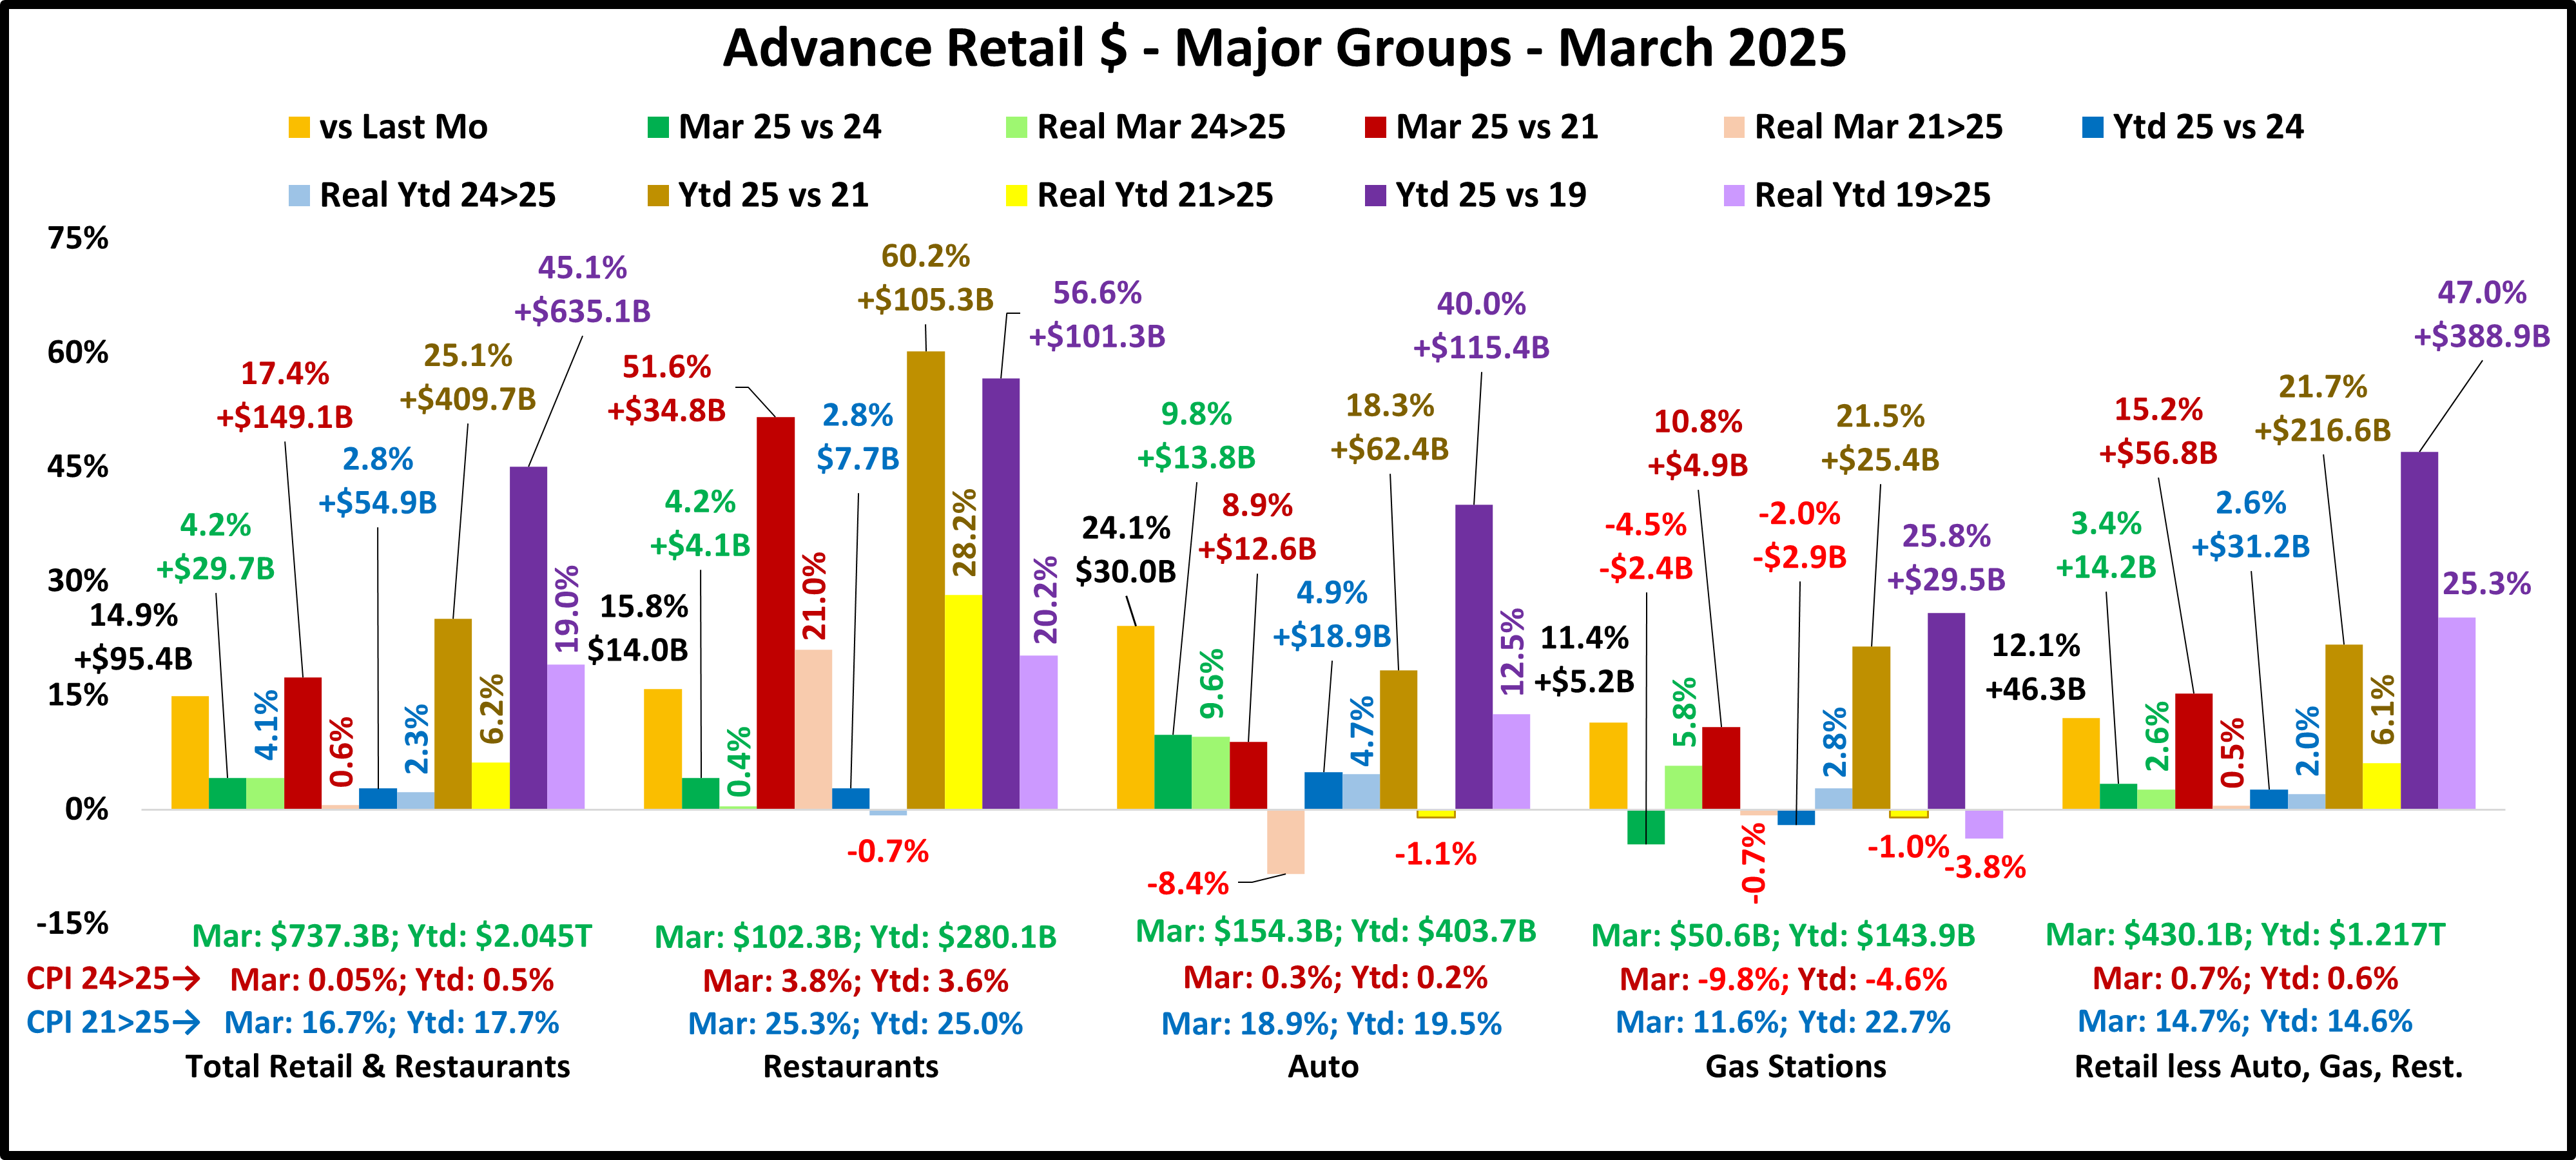
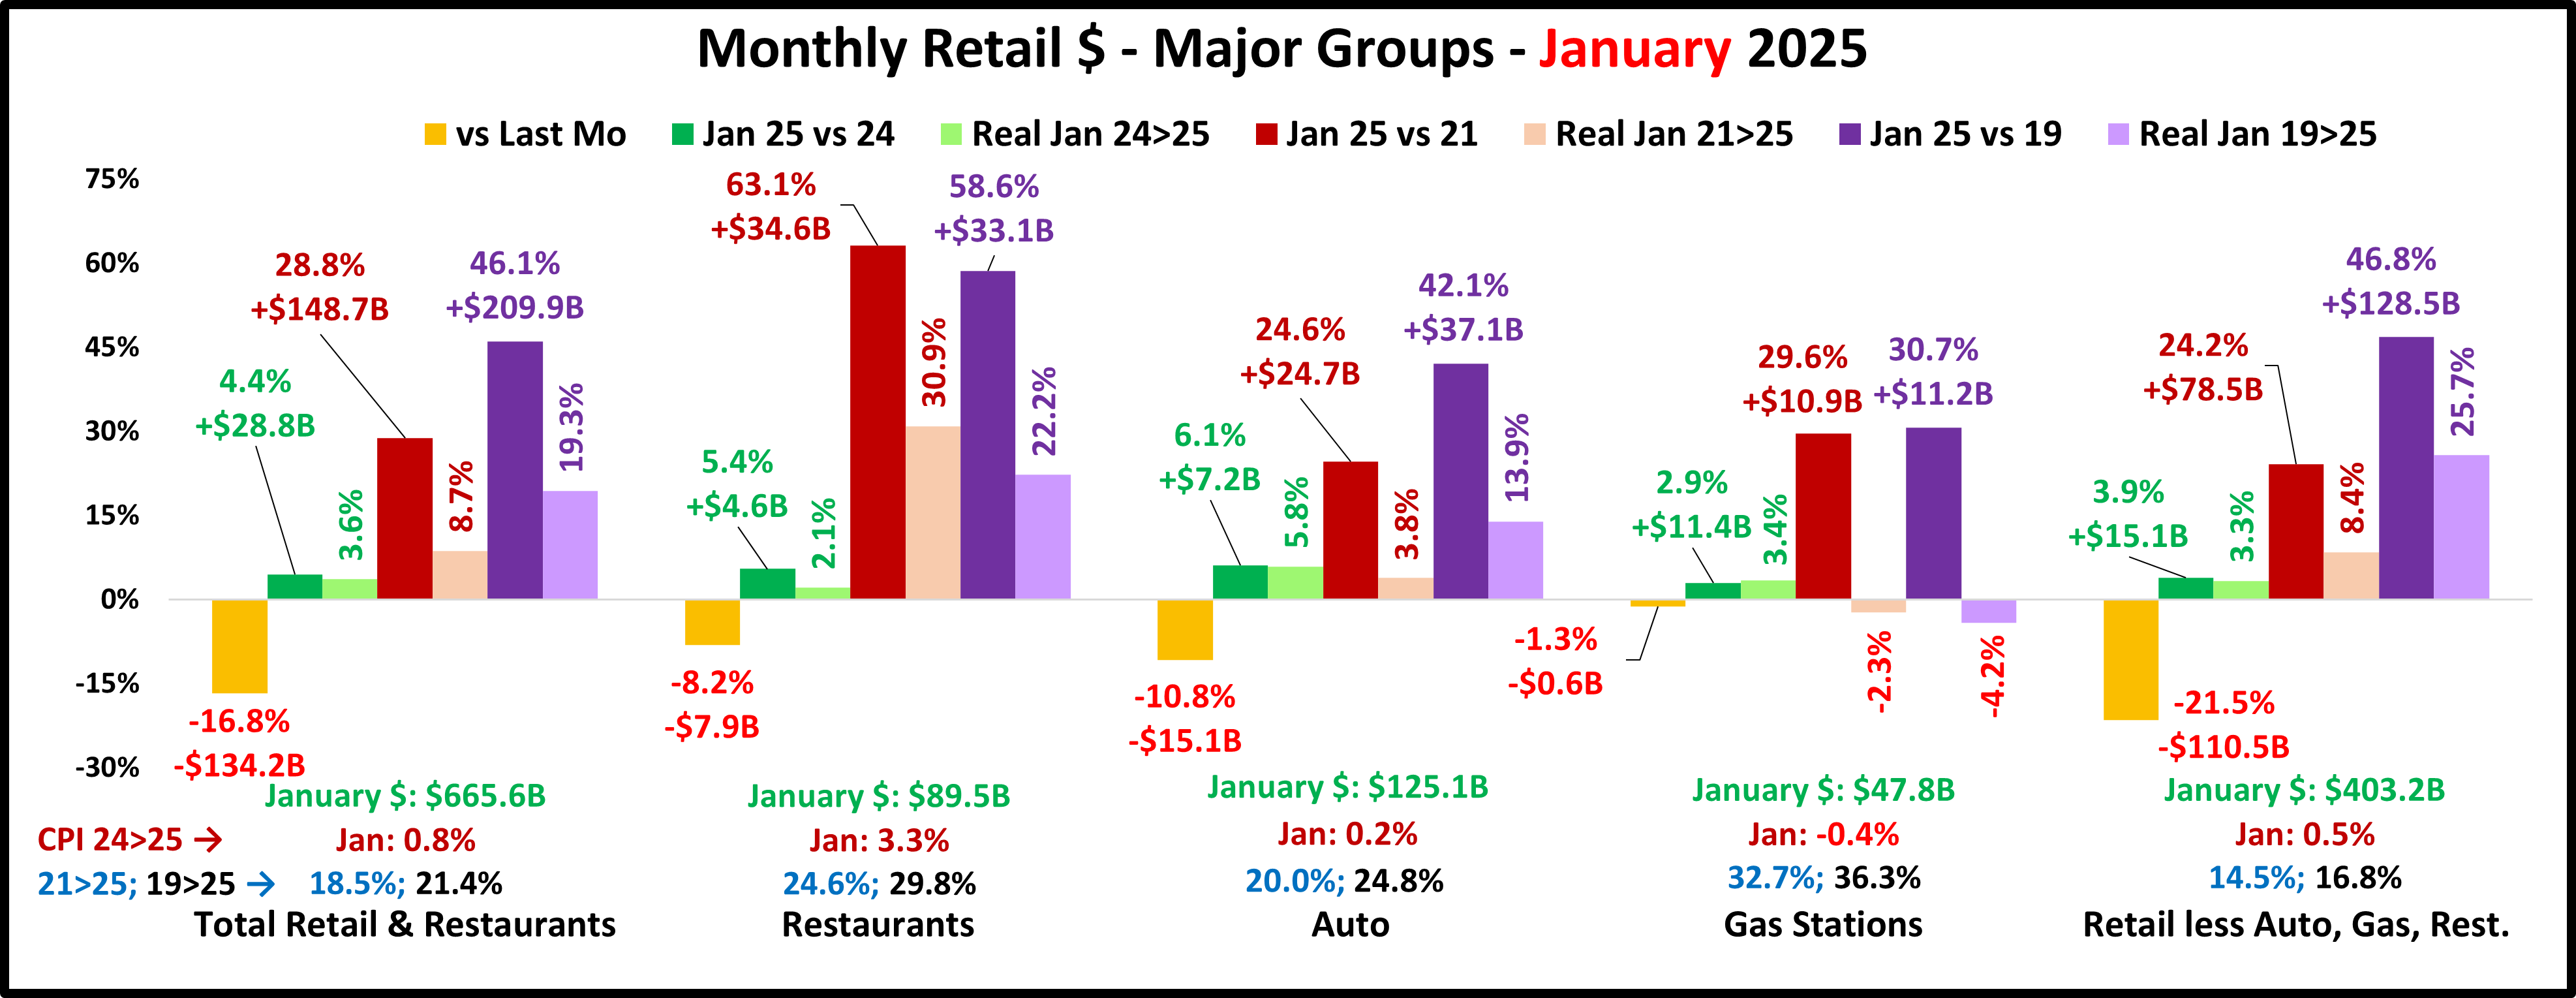
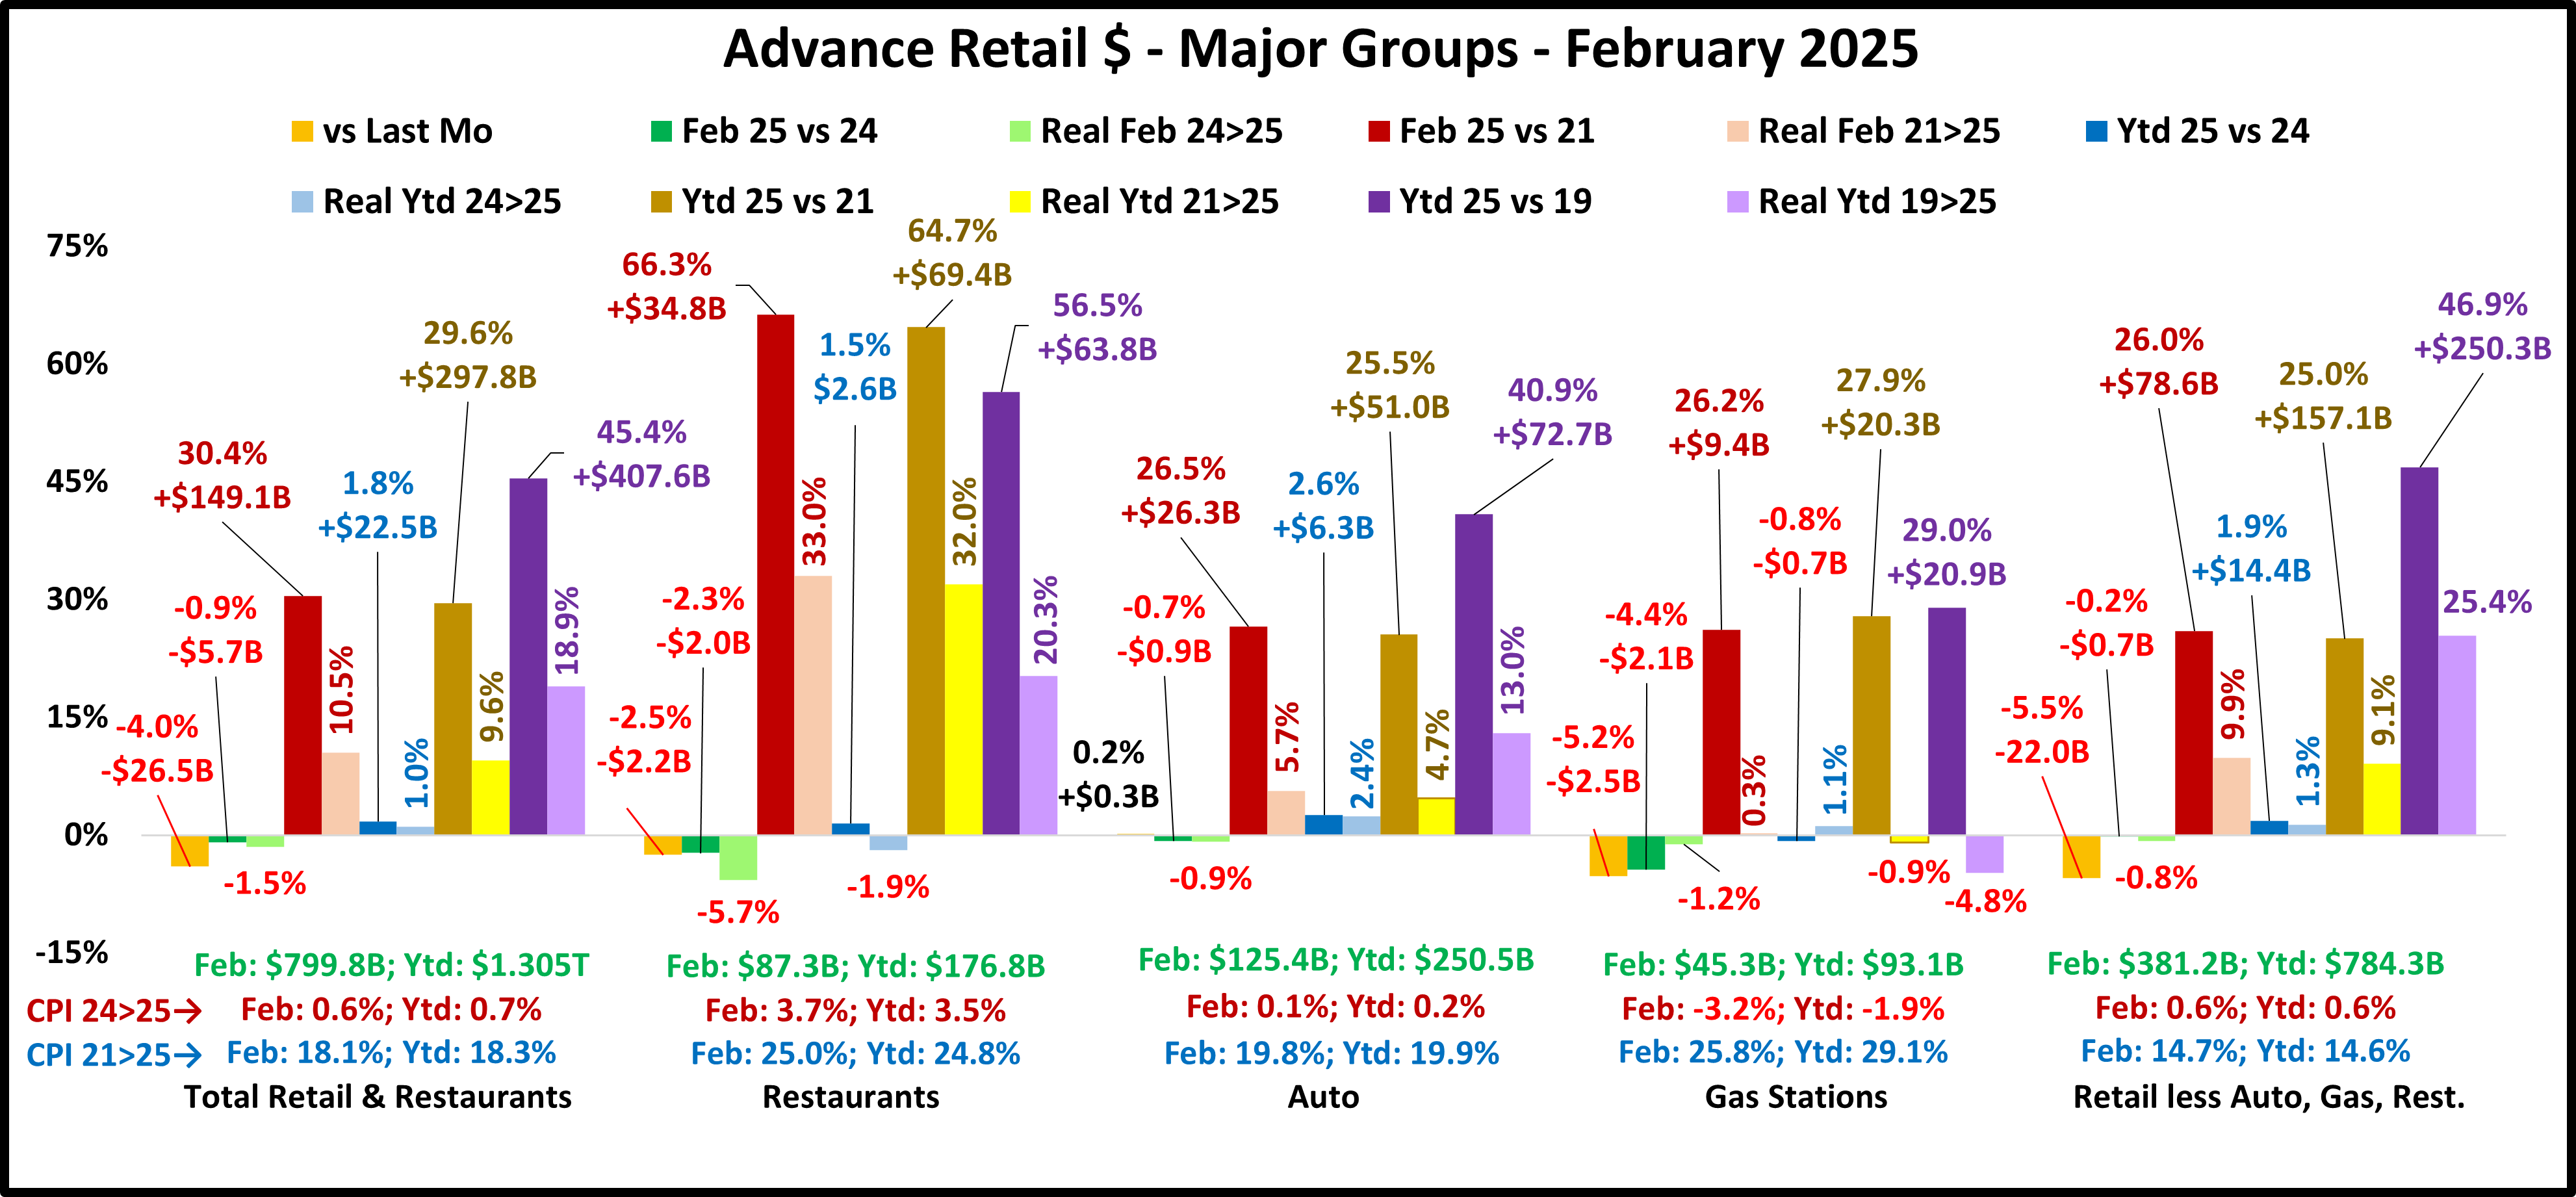
First the Jan>Jul Monthly Report for Big Groups (100% of U.S. Retail $)

We also included the Y/E numbers for 2024, both actual & average, to show our 1st goal – Beat these lifts!
Jan is arguably the best month, but Feb is definitely the worst. It is often the low point of the Retail year. In 25, the lift vs 24 was -78% below avg for Relevant Retail, but Total and all other groups had drops. A new positive is July. Gas Stations had their smallest monthly drop in 25, but all other groups had lifts, 3 above avg. April is still the best month of this period, with 1 drop but 4 above avg lifts, including Total. In May>Jun, the situation worsened. Still 1 drop, but only 1 above avg lift. June was a better than May, but the big improvement was in July, although the Total lift is still below avg.
Restaurants – The February drop was small and the Mar>May lifts were above avg. They peaked at 7.6% in May, 36.% above avg. Things worsened in June as their lift slowed to -1.0% below avg. July rebounded to +5.9%, 6.3% above avg.
Auto – Until May>Jun, their pattern was the same as Restaurants but with bigger changes, especially in Mar/Apr. The Mar/Apr lifts were basically double the avg. The 25% tariff was effective 4/3/25. Consumers saved thousands of dollars, but the binge buy ended in May, -59.7% below avg. Sales did bounce back in Jun/Jul, 14>27% above avg.
Gas Stations – They are definitely in turmoil. Sales fell Feb>Jul and until the -2.7% drop in July, all were bigger than 2024.
Relevant Retail – They do about 60% of Total Retail $. They have a similar pattern but now with 2 differences. The biggest is that they were +1% in Feb – no drop. #2 was in July. Their lift was 1.7% above avg while Total was -7.8% below avg. The Feb/Mar & May/Jun lifts were below avg while the Jan, Apr & Jul lifts were above avg. Their 23>24 lift was above Total Retail. In May & now July their lifts were much better than Total. Their progress continues.
Total Retail – They had a small drop in February, but March was basically equal to the avg. Jan & Apr were the only above avg months. All non-Feb months had lifts above the 3.0% 23>24 Y/E increase but the May lift was only +3.1%, -33.9% below avg. The situation improved in Jun>Jul, but the July lift is still -7.8% below avg.
7 MONTHS JAN>JUL SUMMARY: $↓: 9; ↑Avg: 15; ↓Avg: 11
Jan: $↓: 0; ↑Avg: 4; ↓Avg: 1; Feb: $↓: 4; ↑Avg: 0; ↓Avg: 1; Mar: $↓: 1; ↑Avg: 2; ↓Avg: 2; Apr: $↓: 1; ↑Avg: 4; ↓Avg: 0;
May: $↓: 1; ↑Avg: 1; ↓Avg: 3; Jun: $↓: 1; ↑Avg: 1; ↓Avg: 3; Jul: $↓: 1; ↑Avg: 3; ↓Avg: 1;
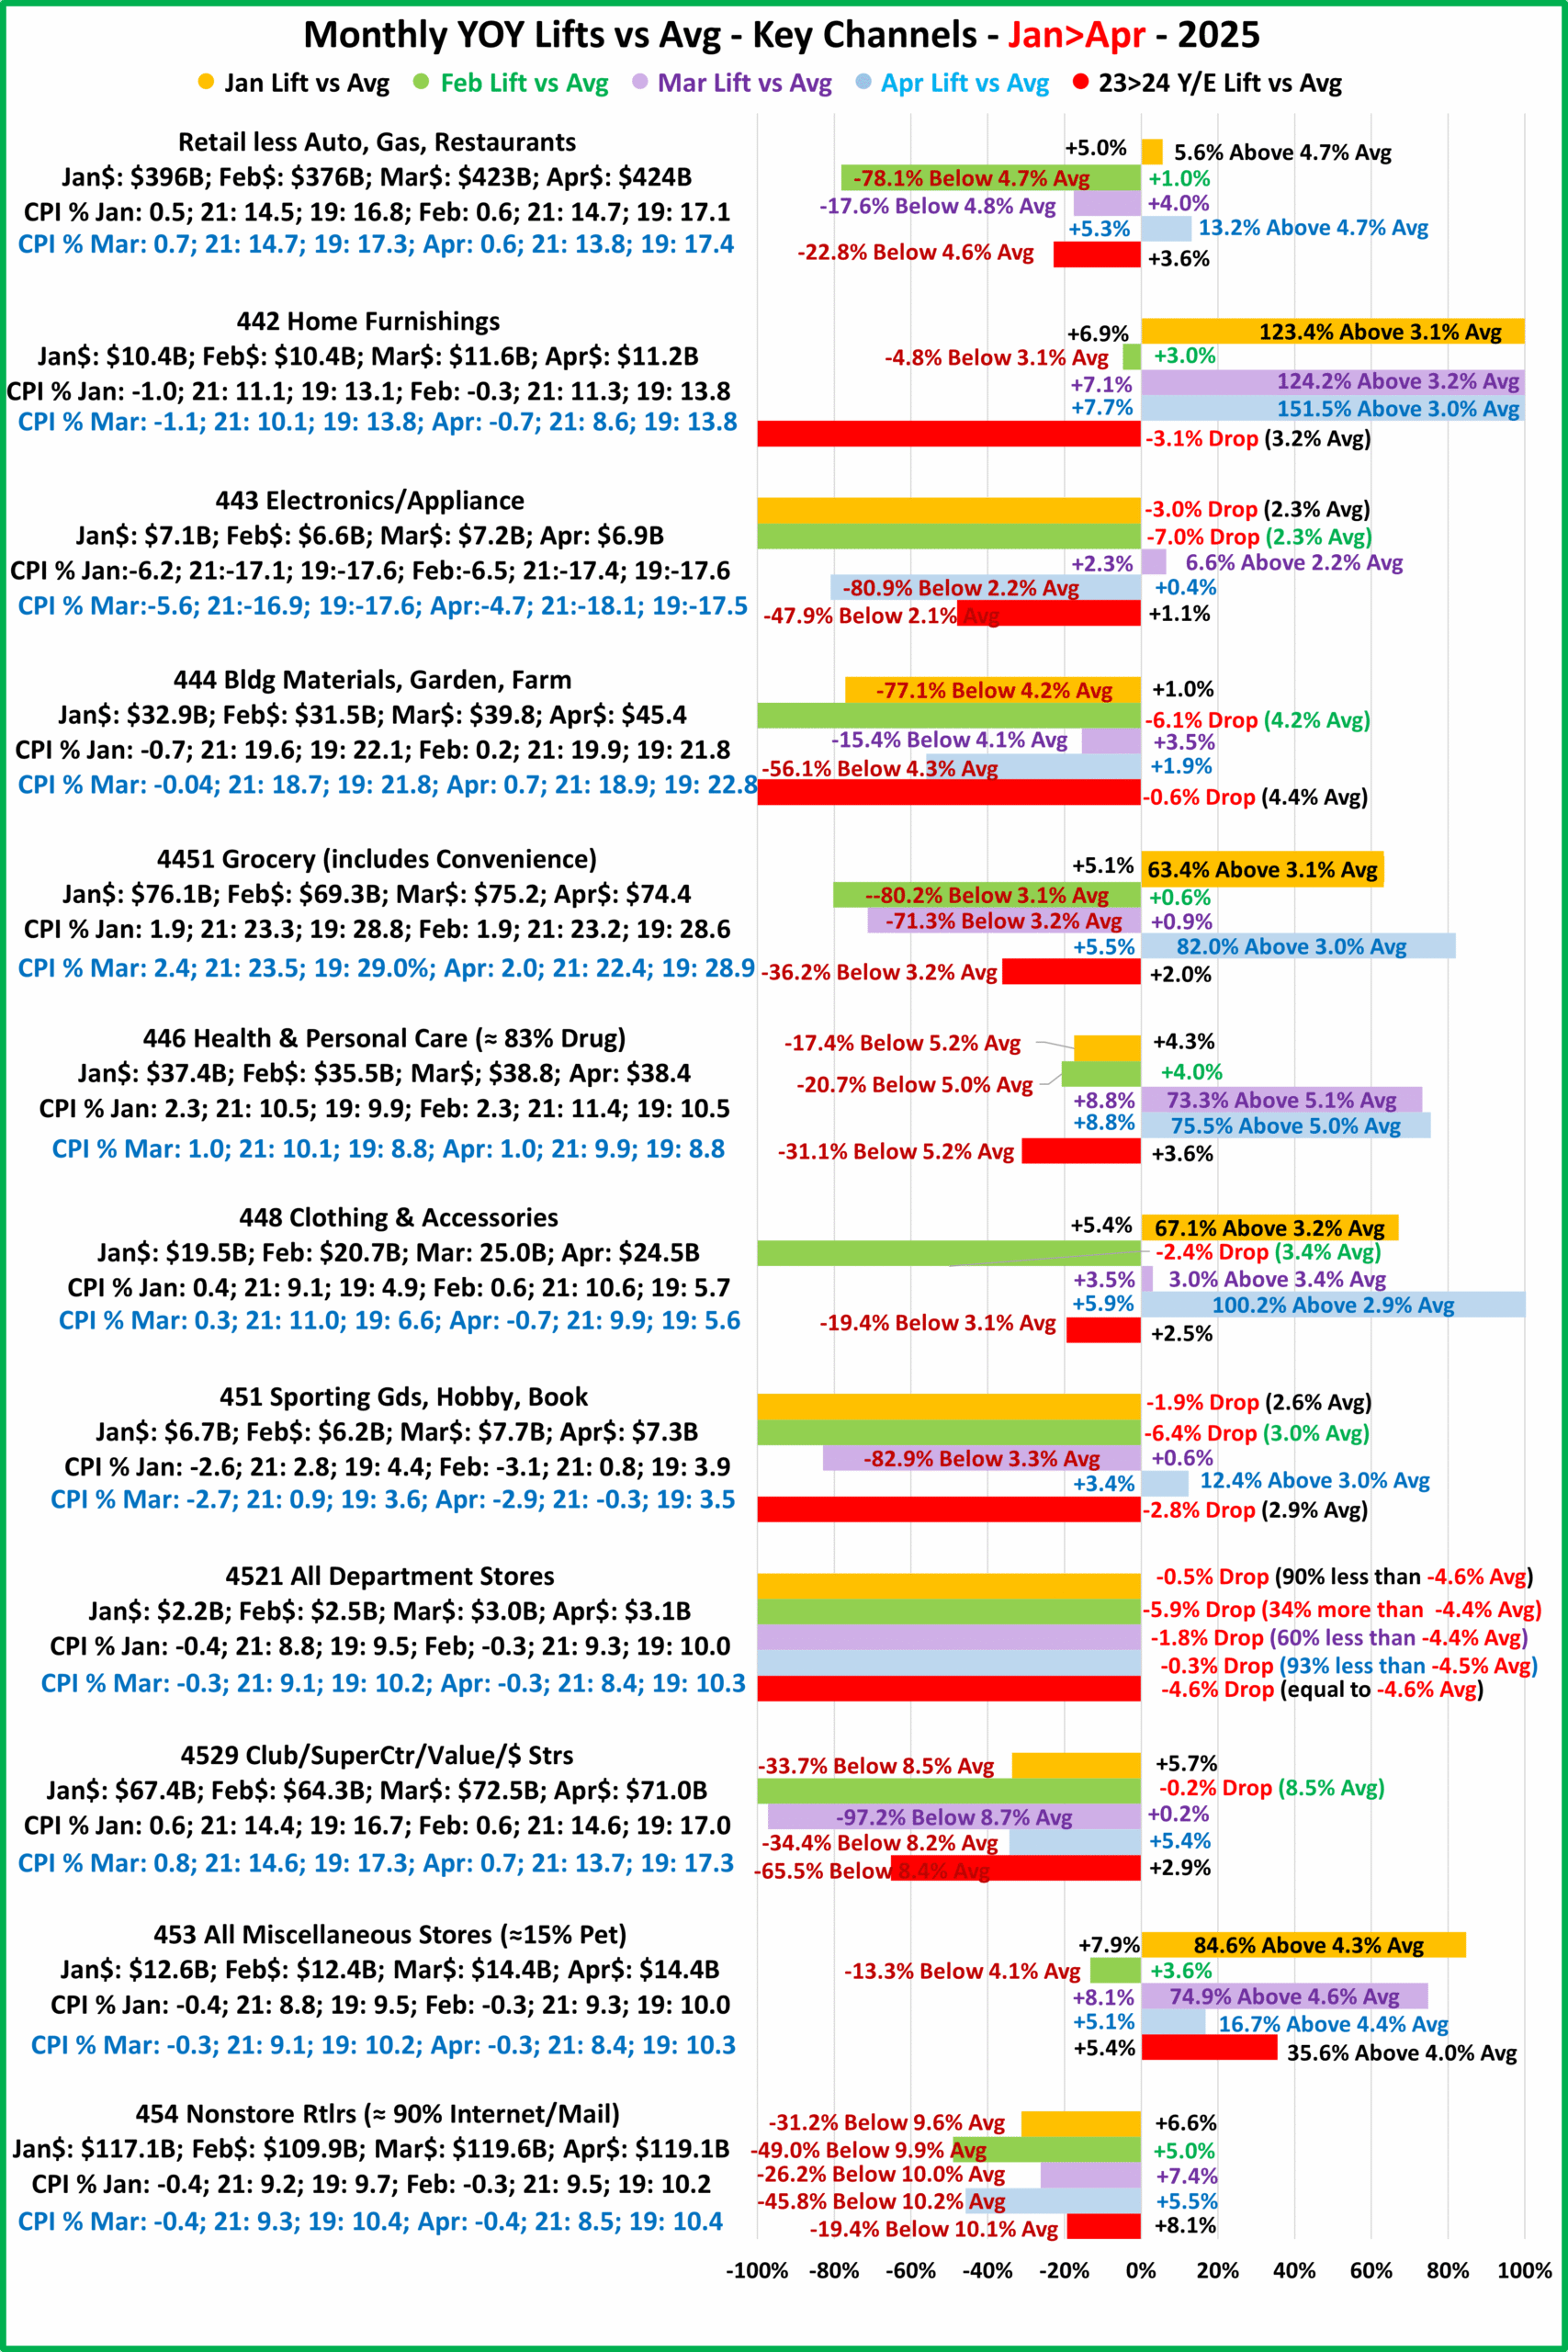
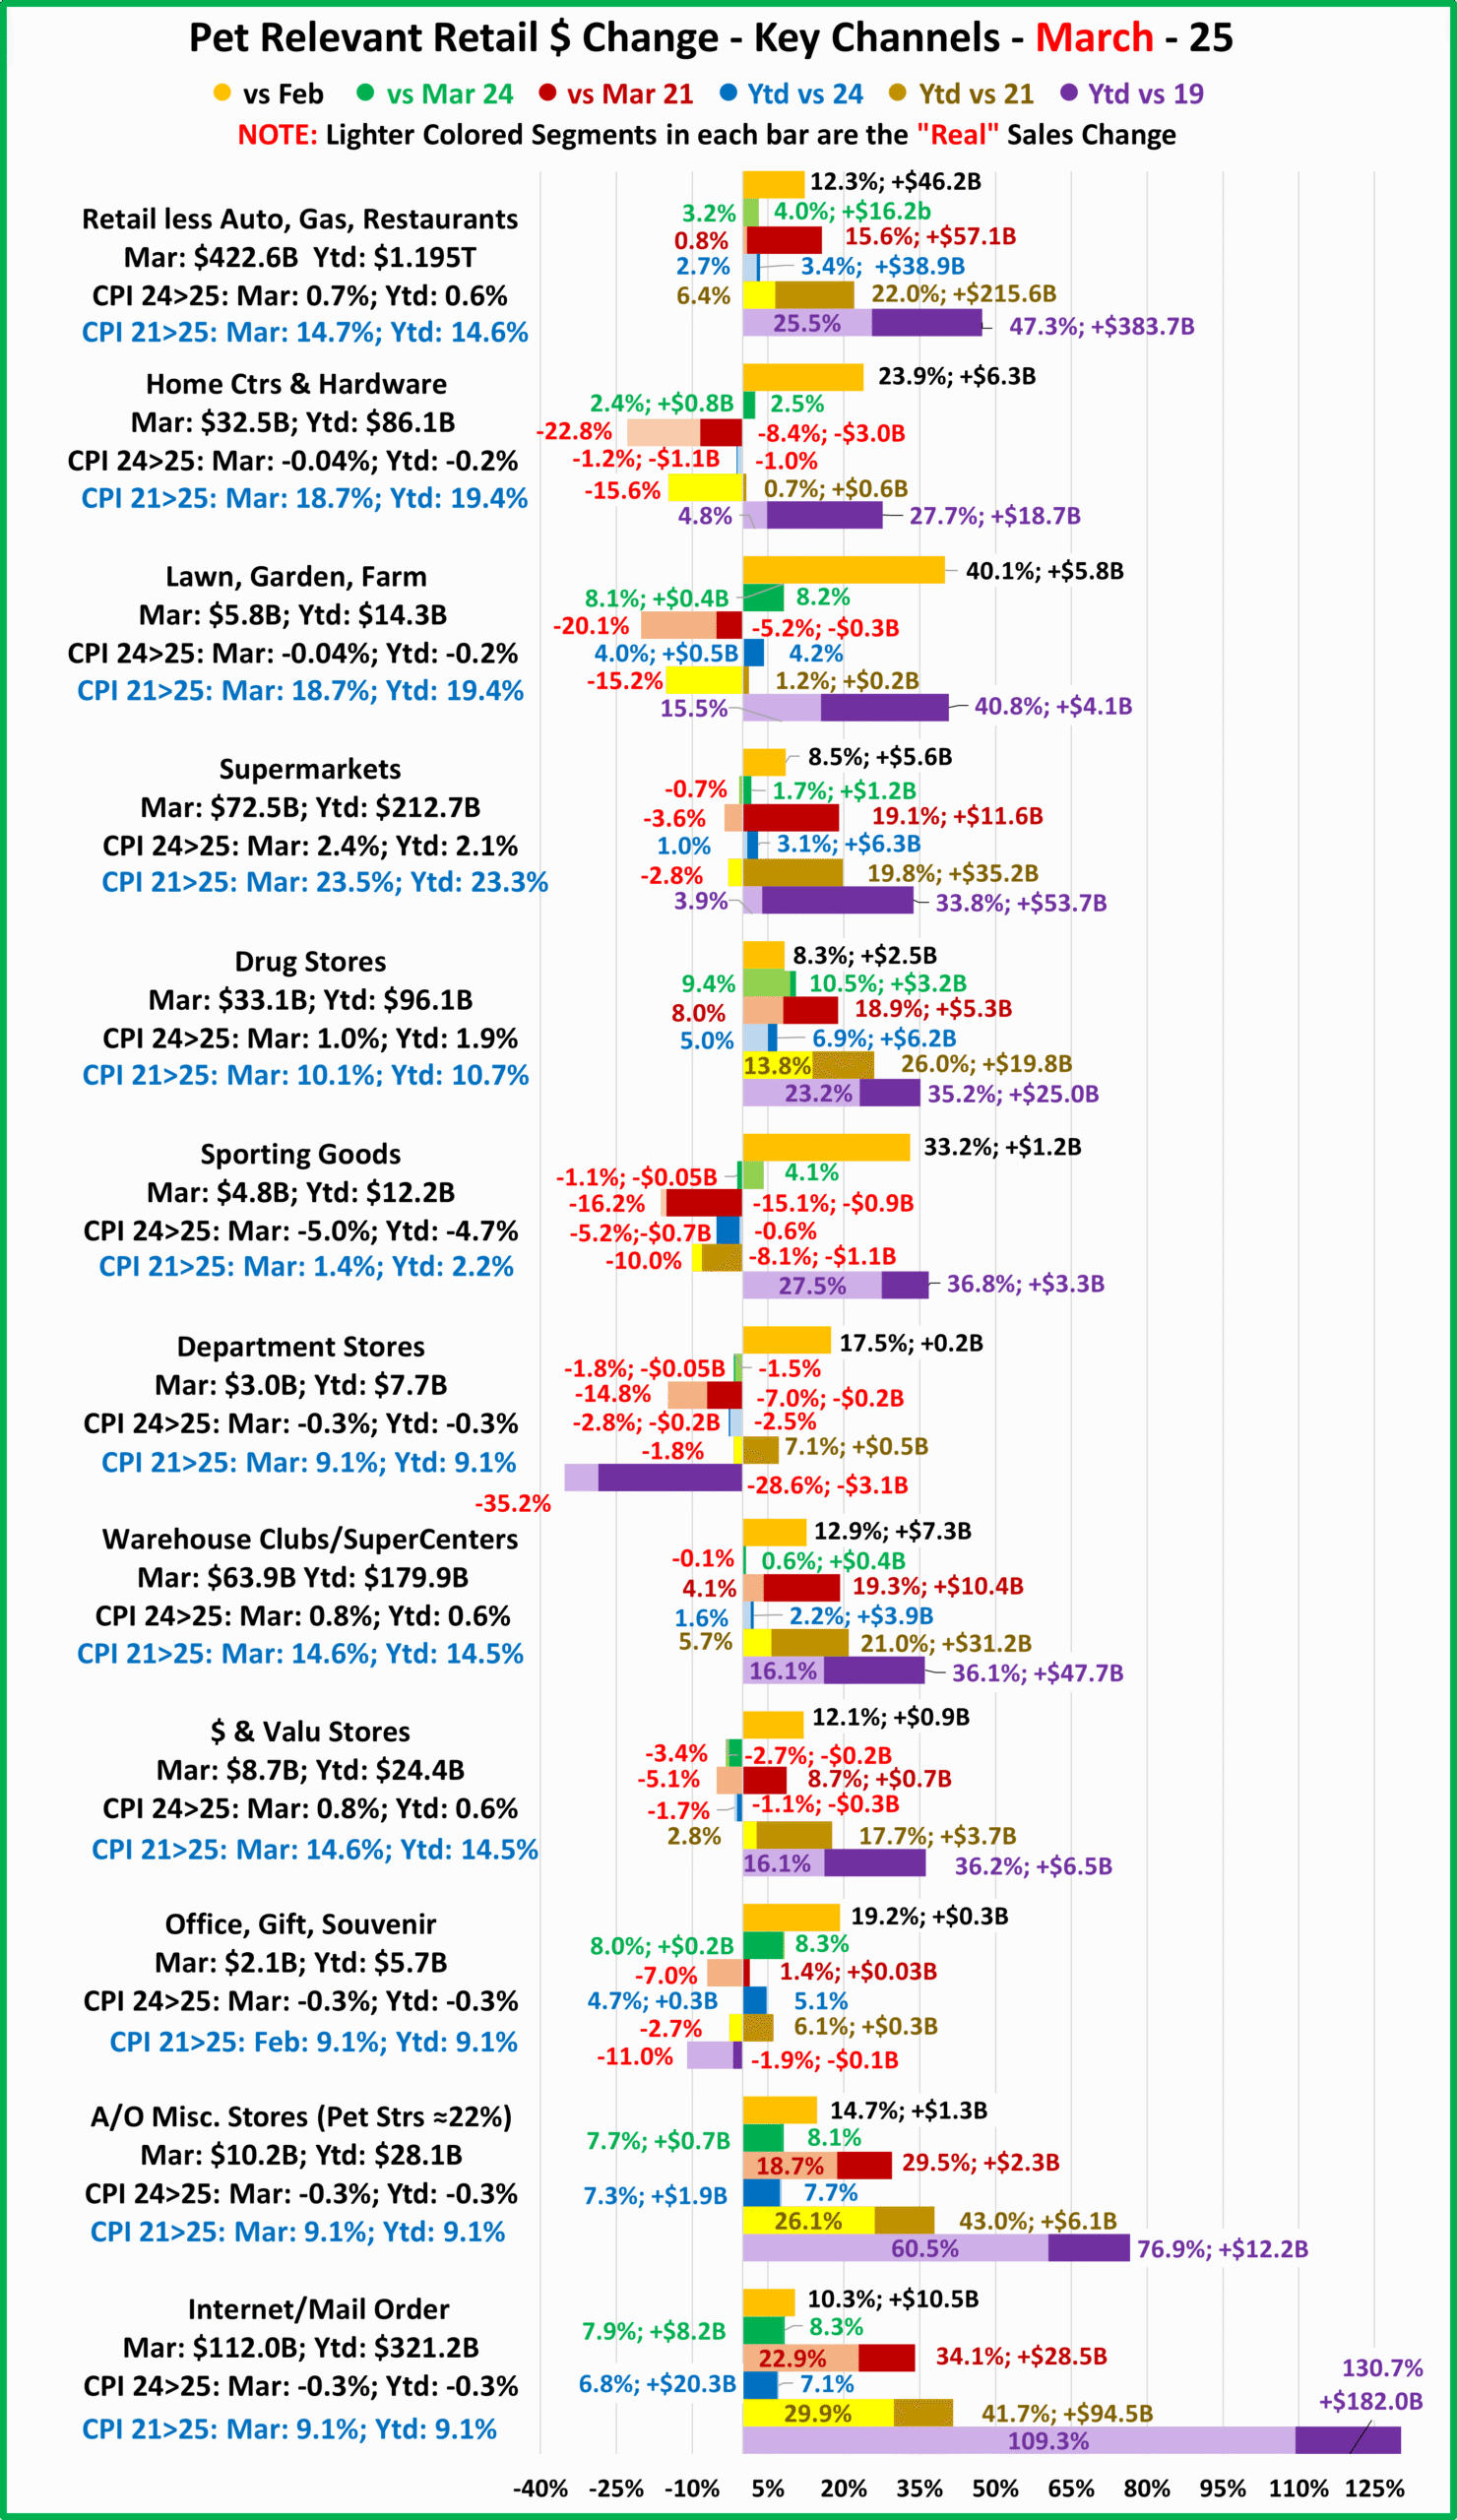
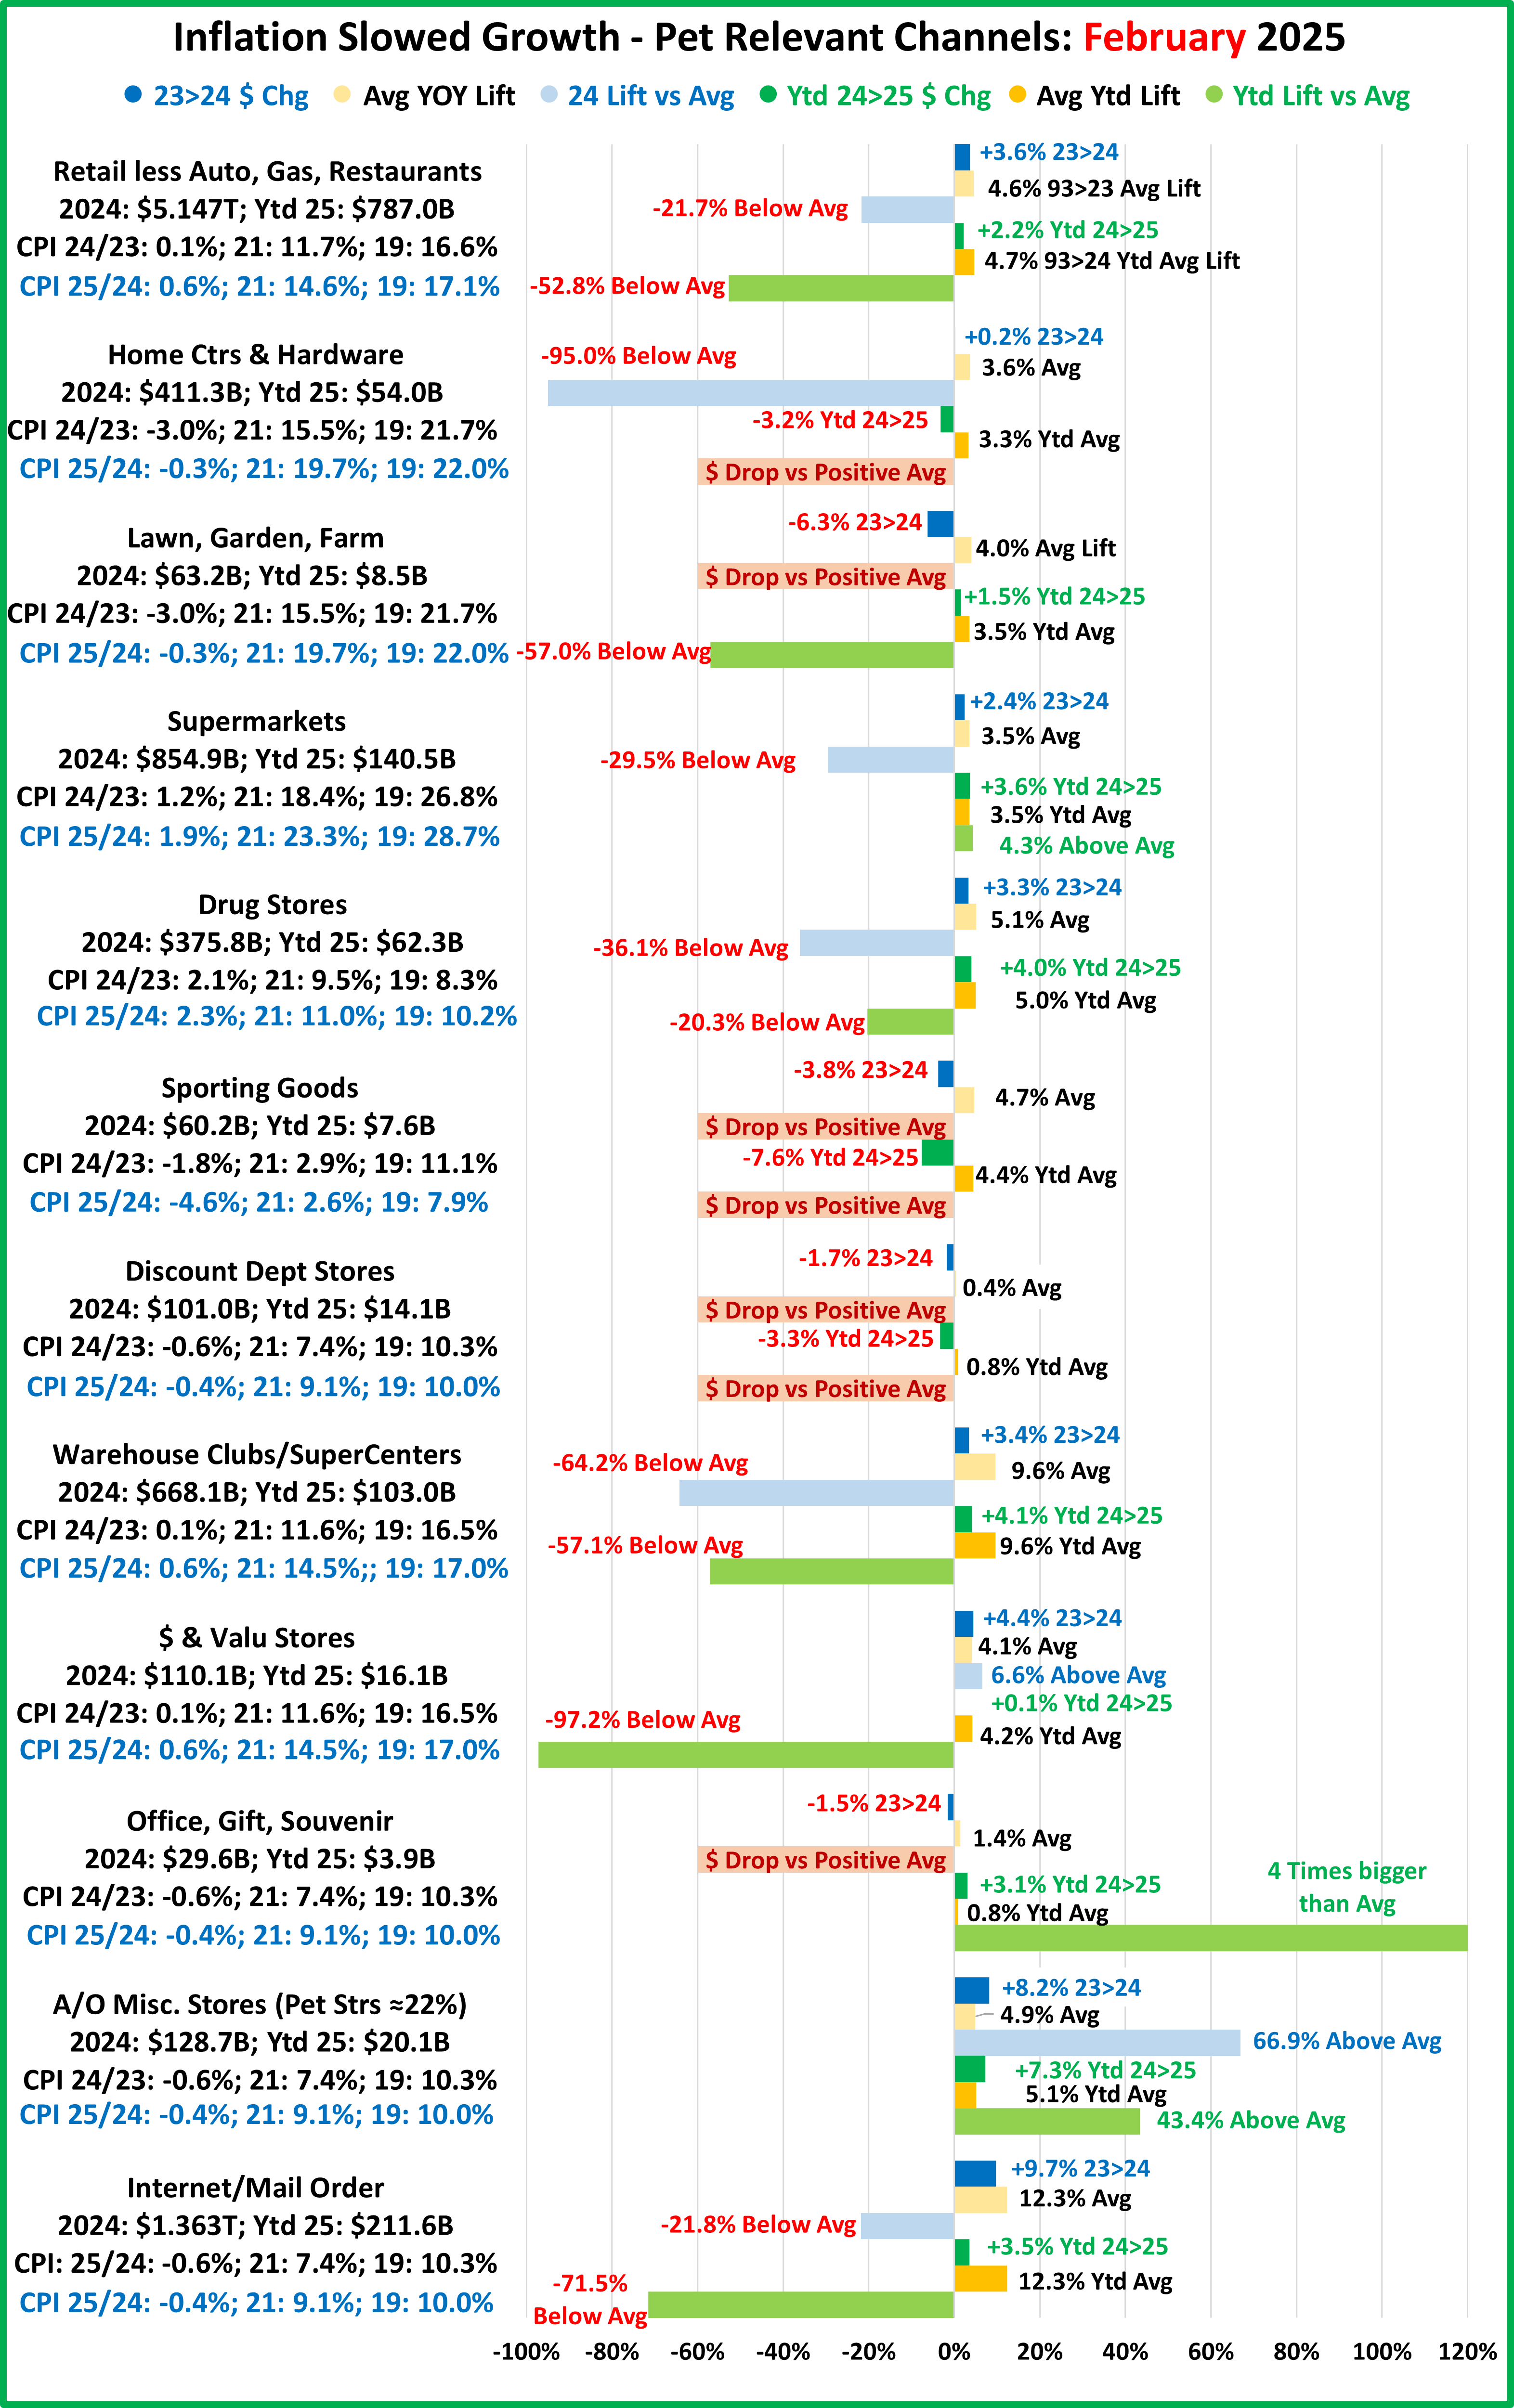
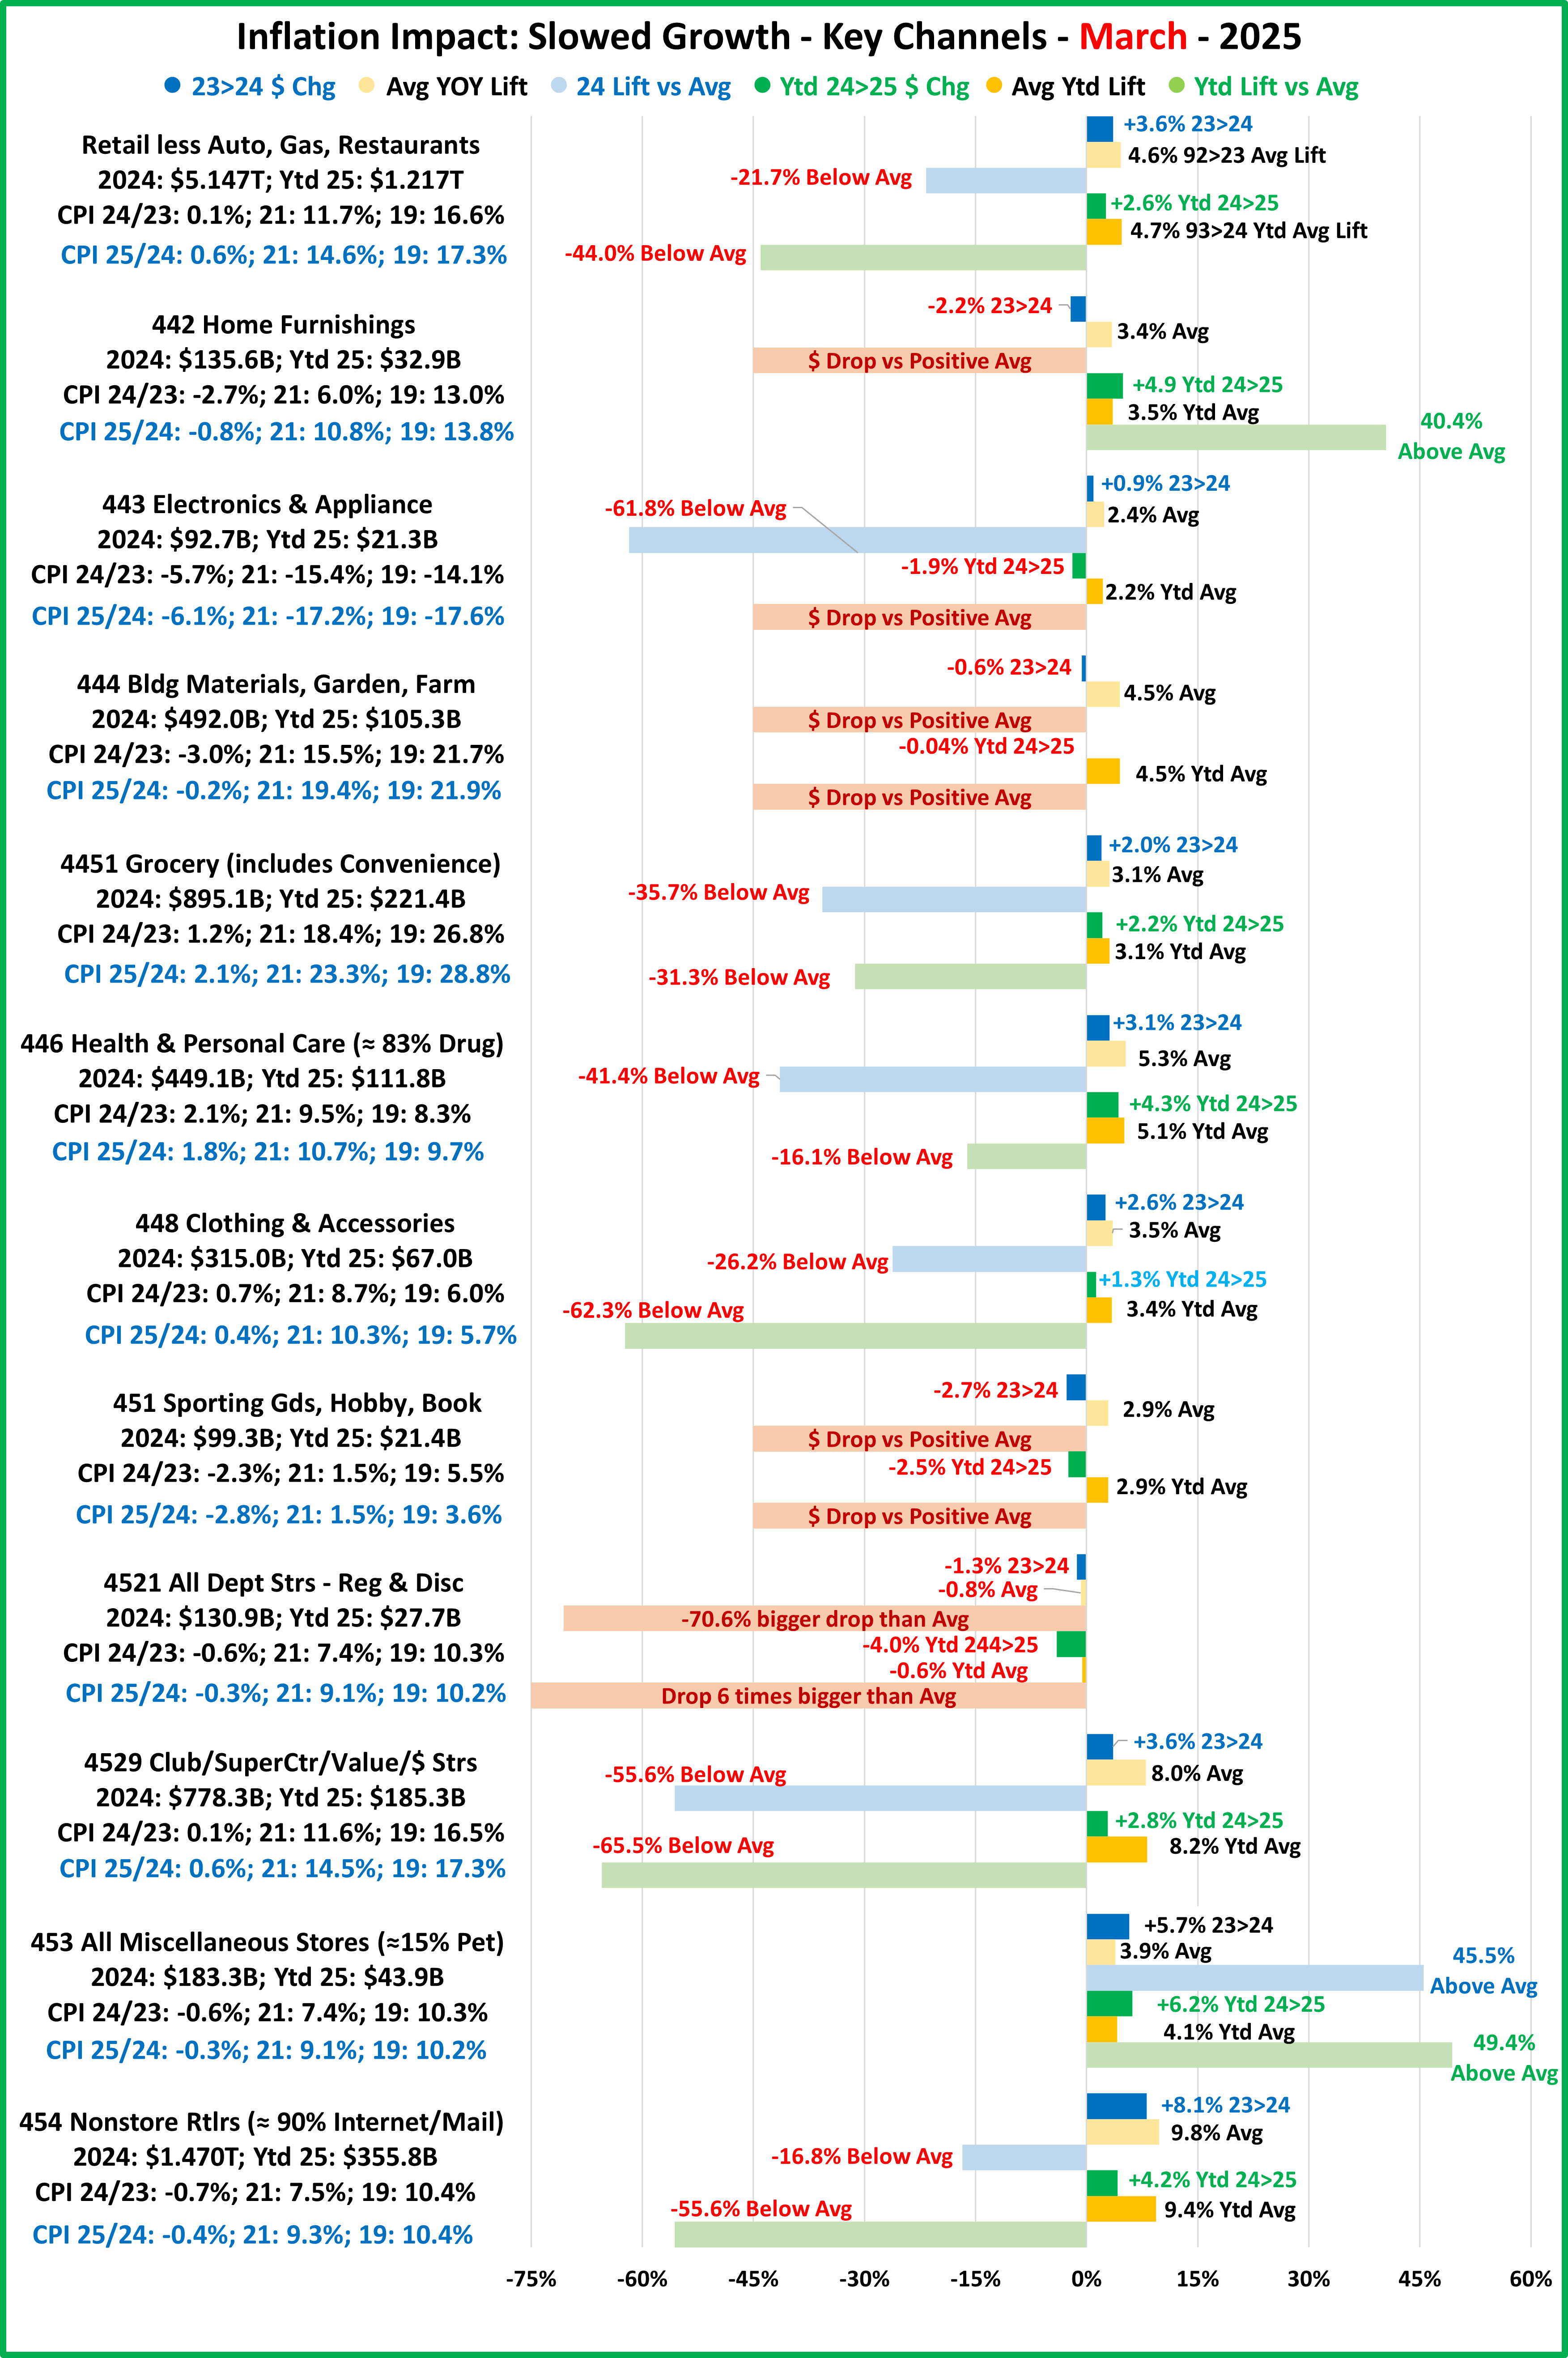
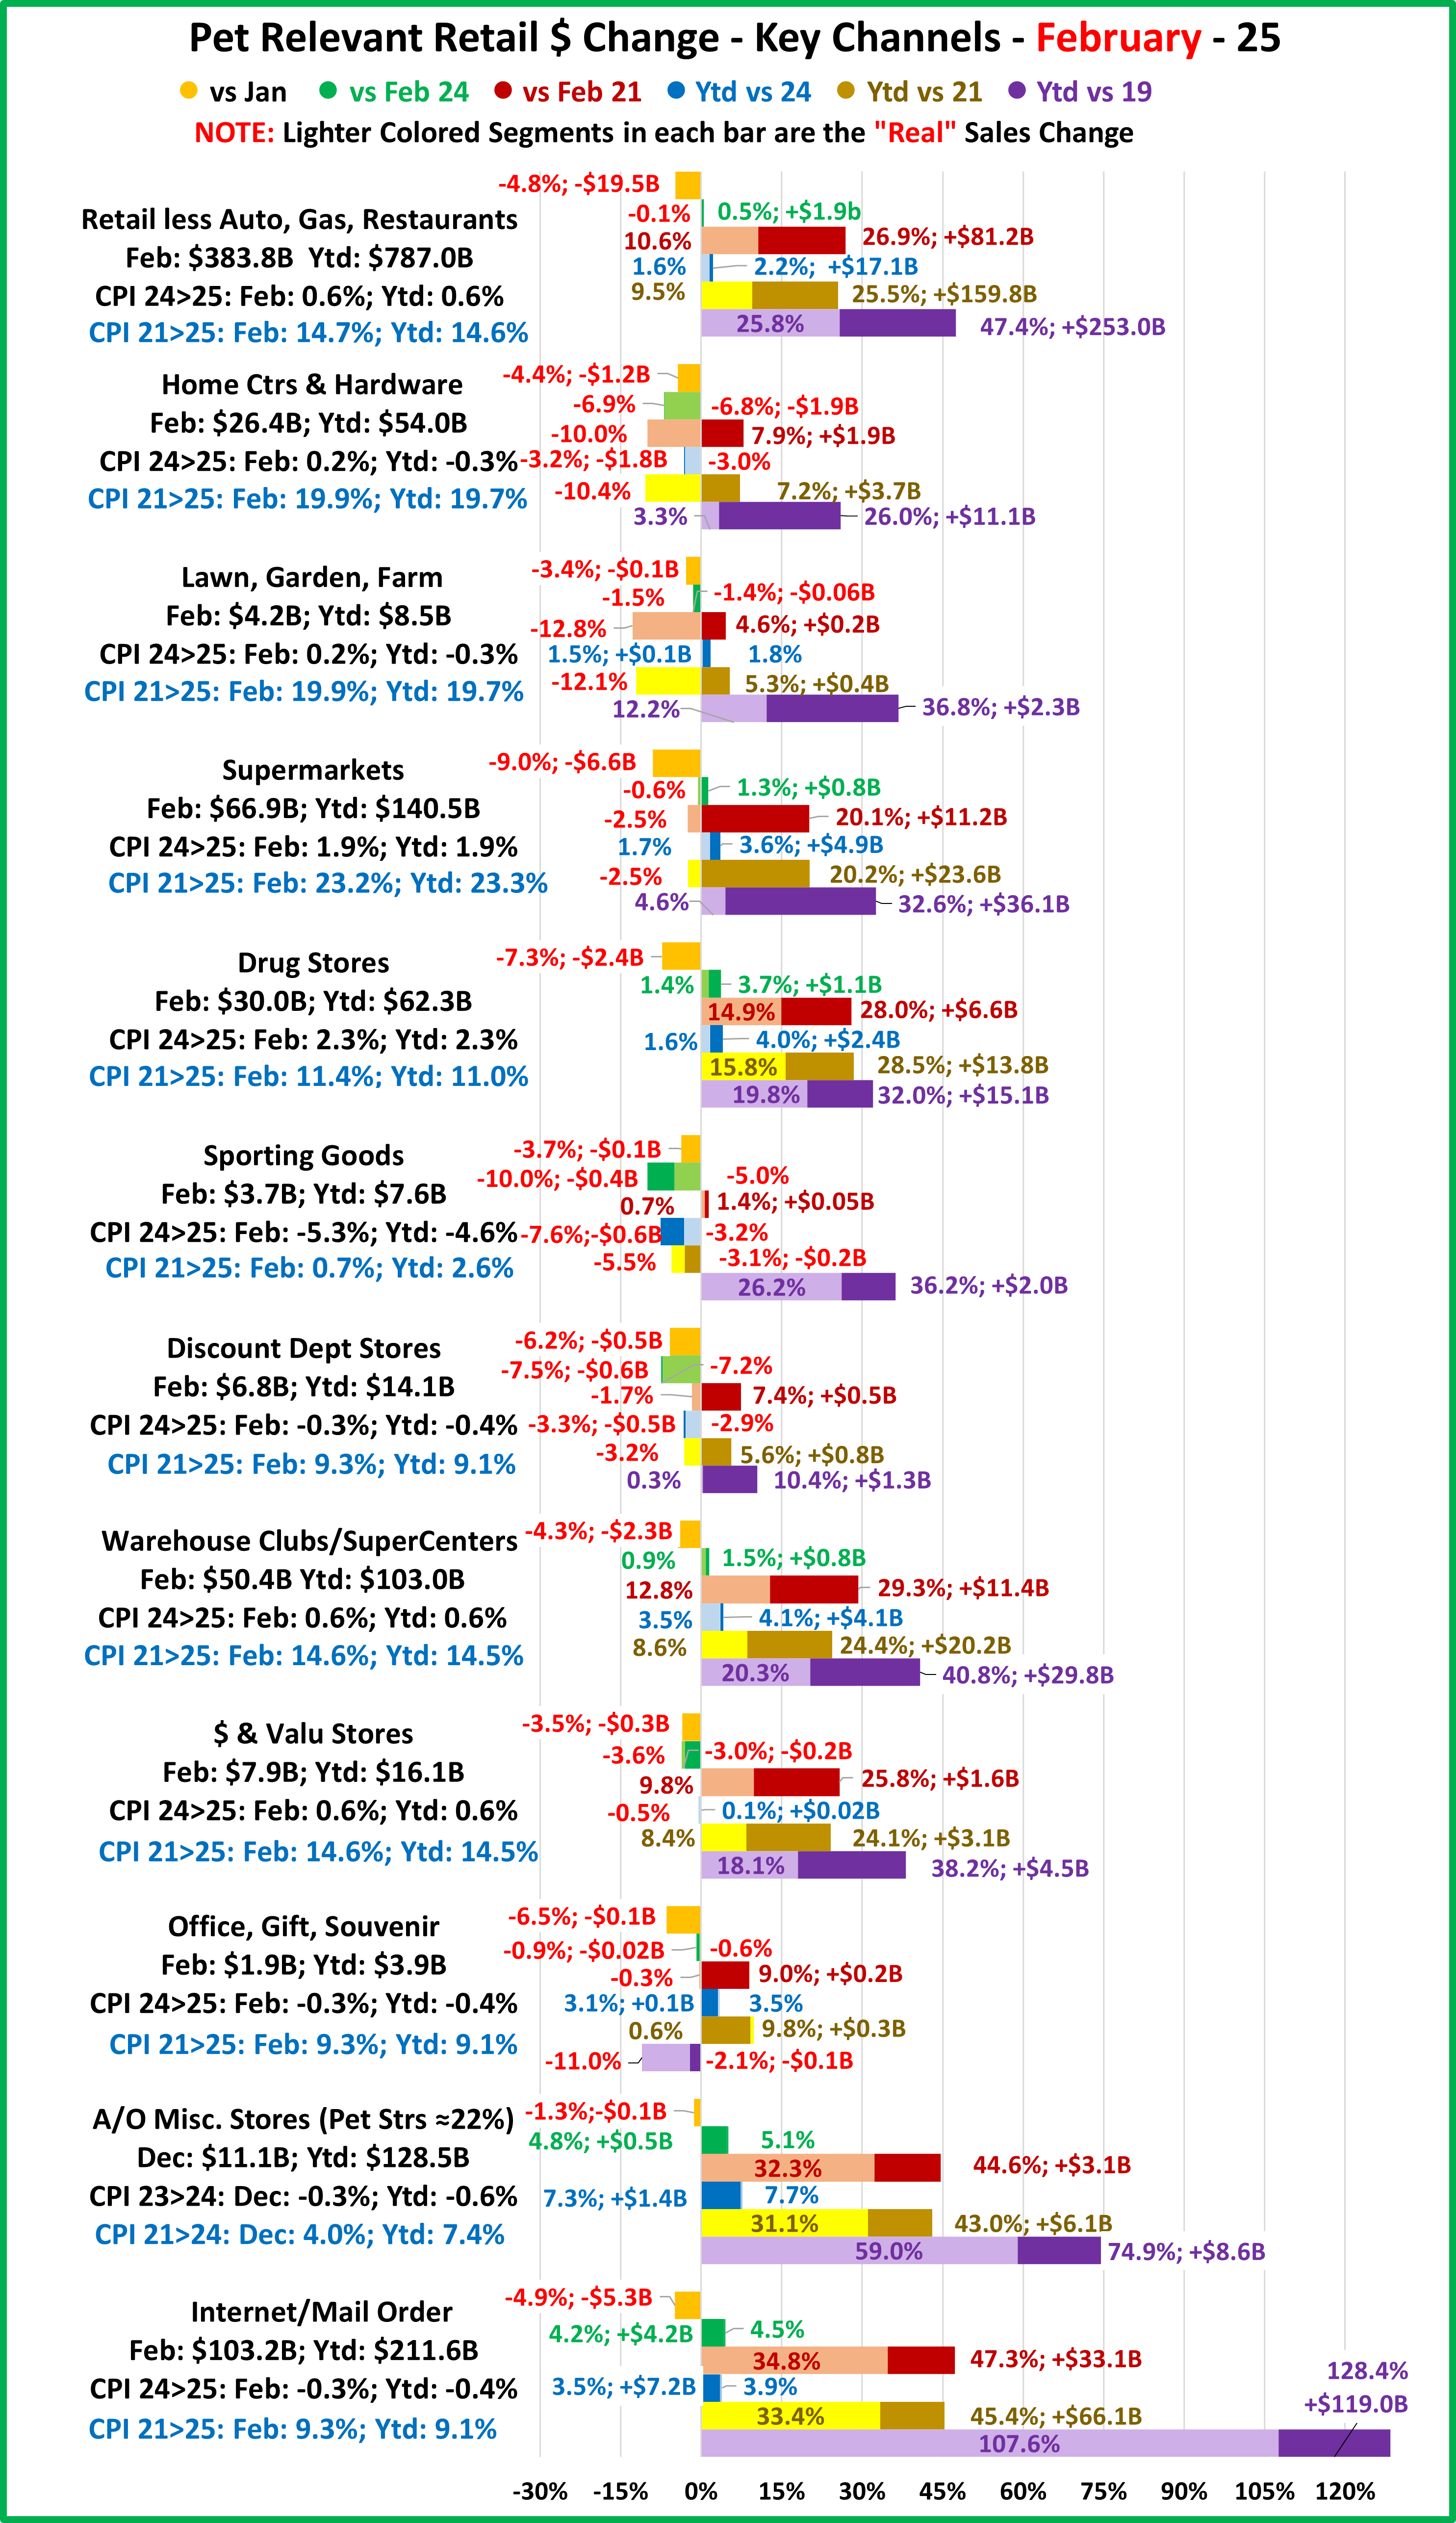
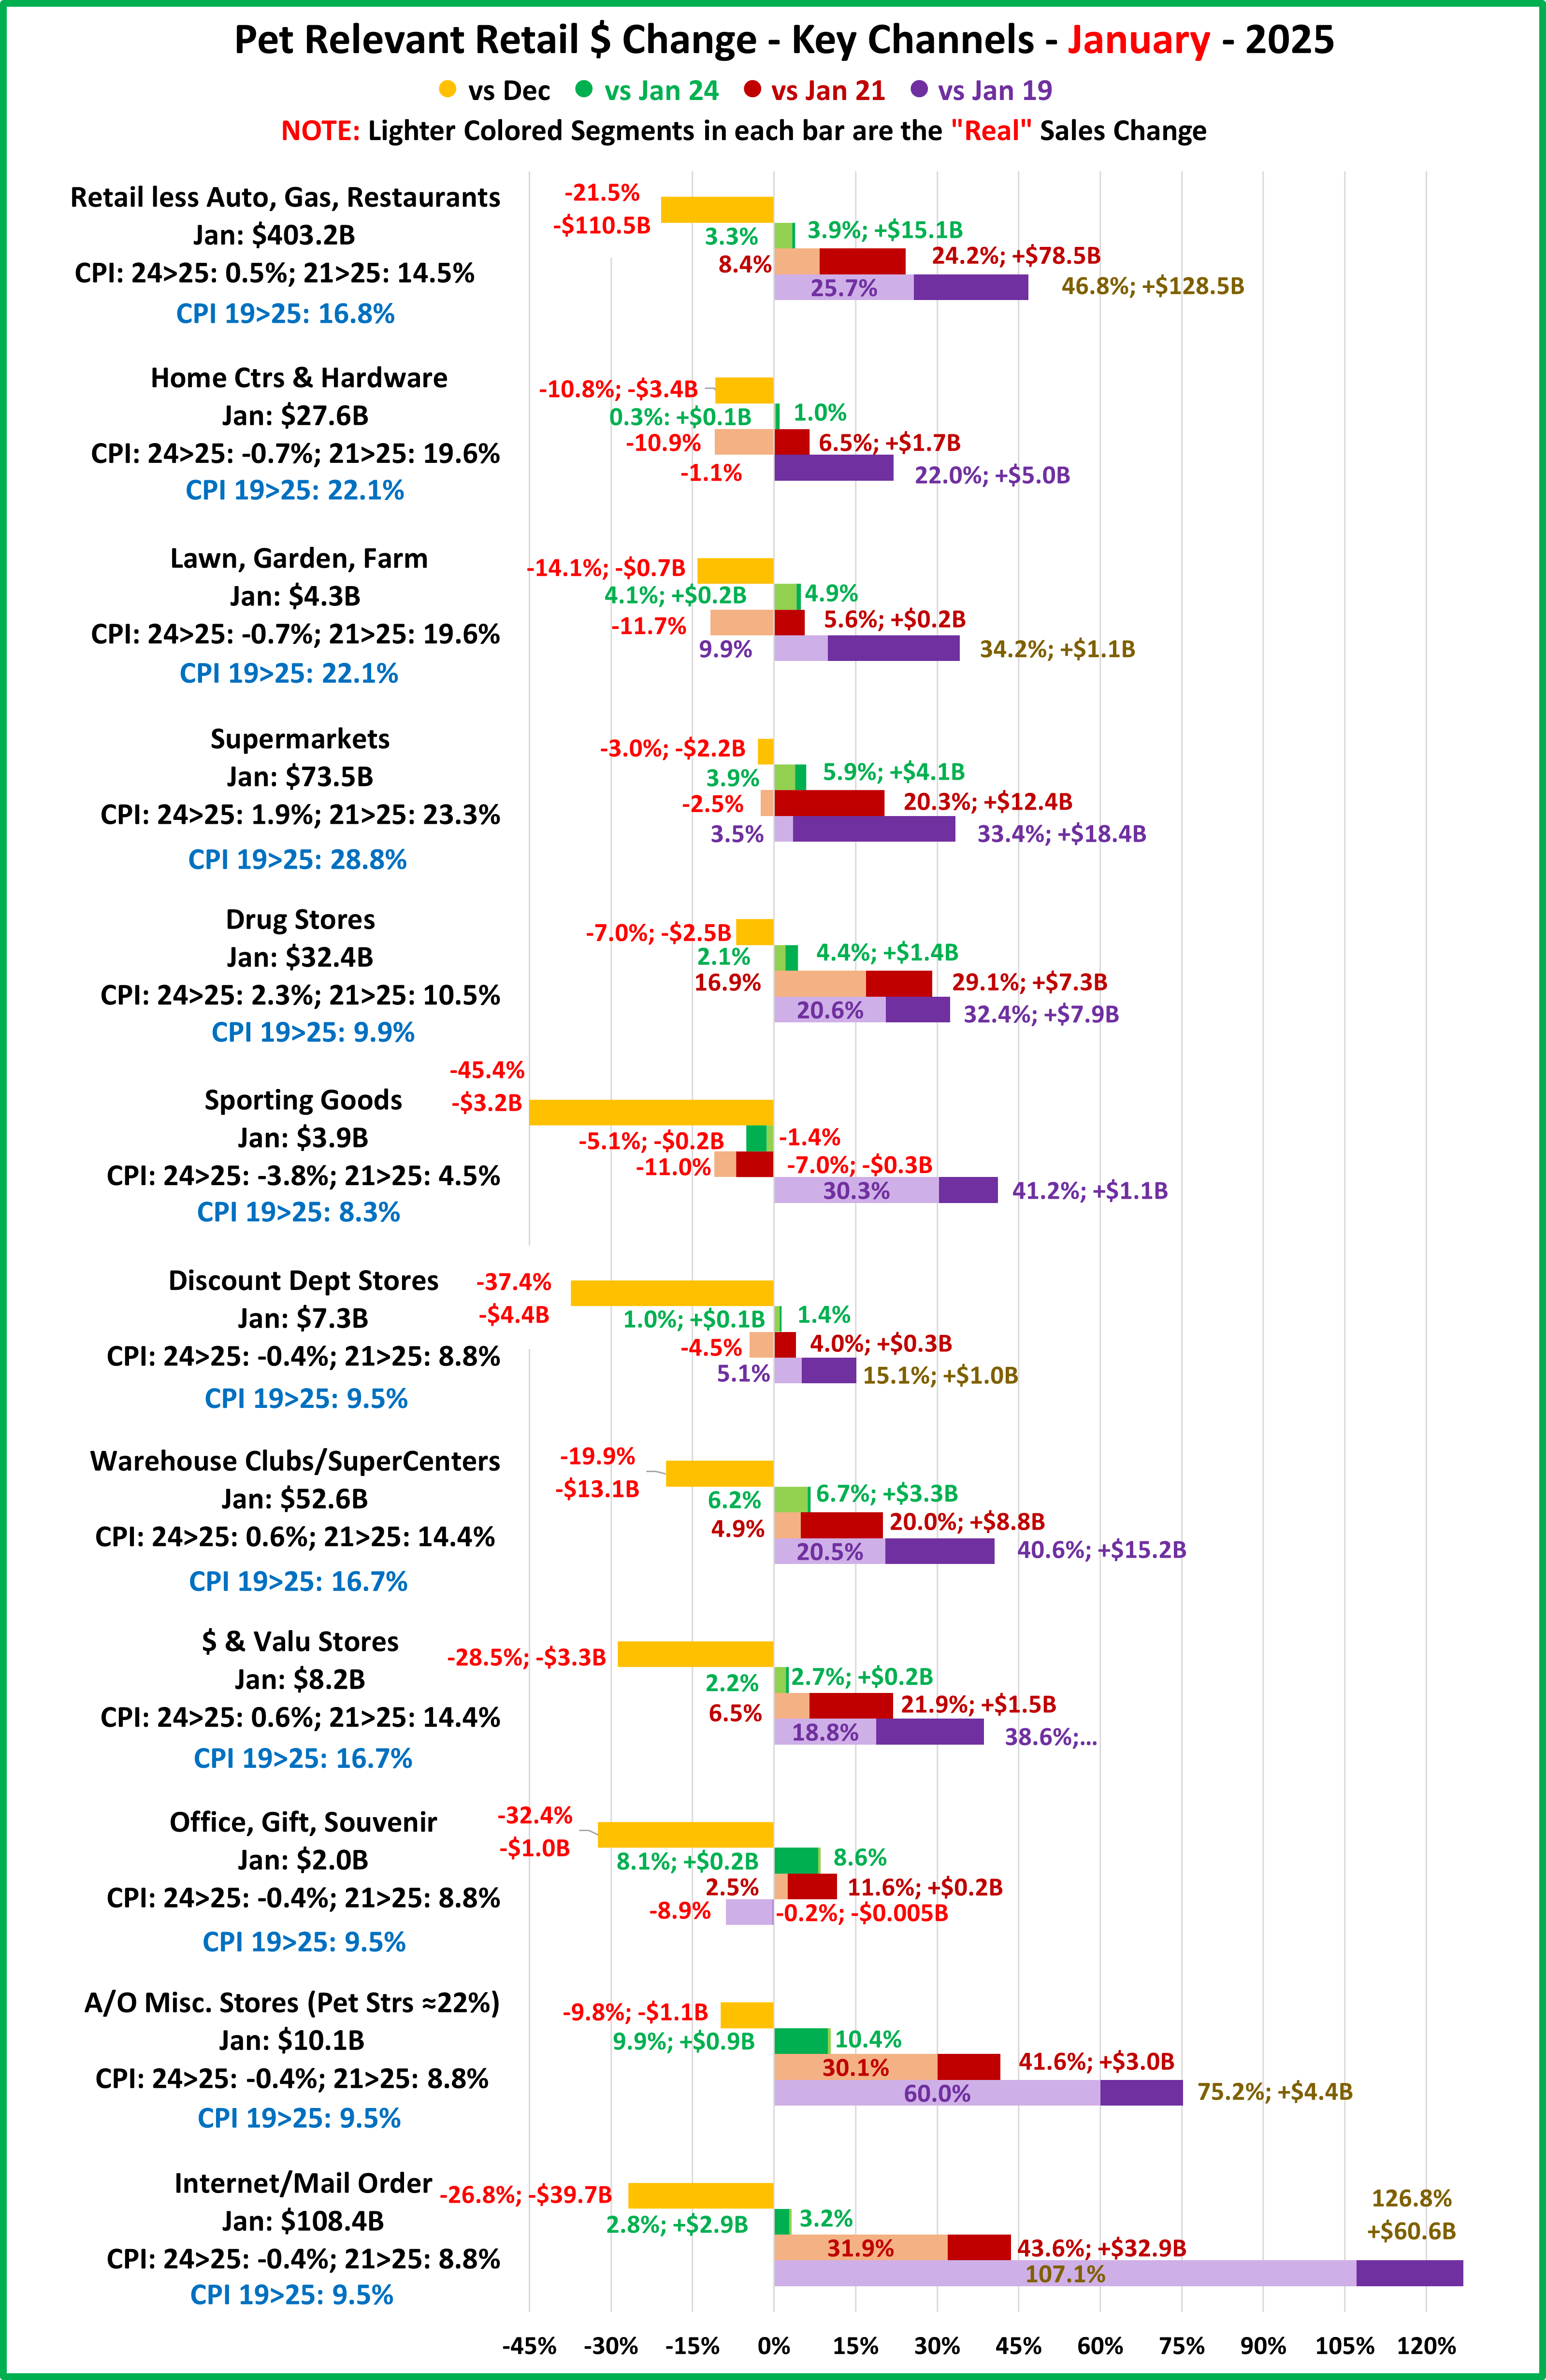
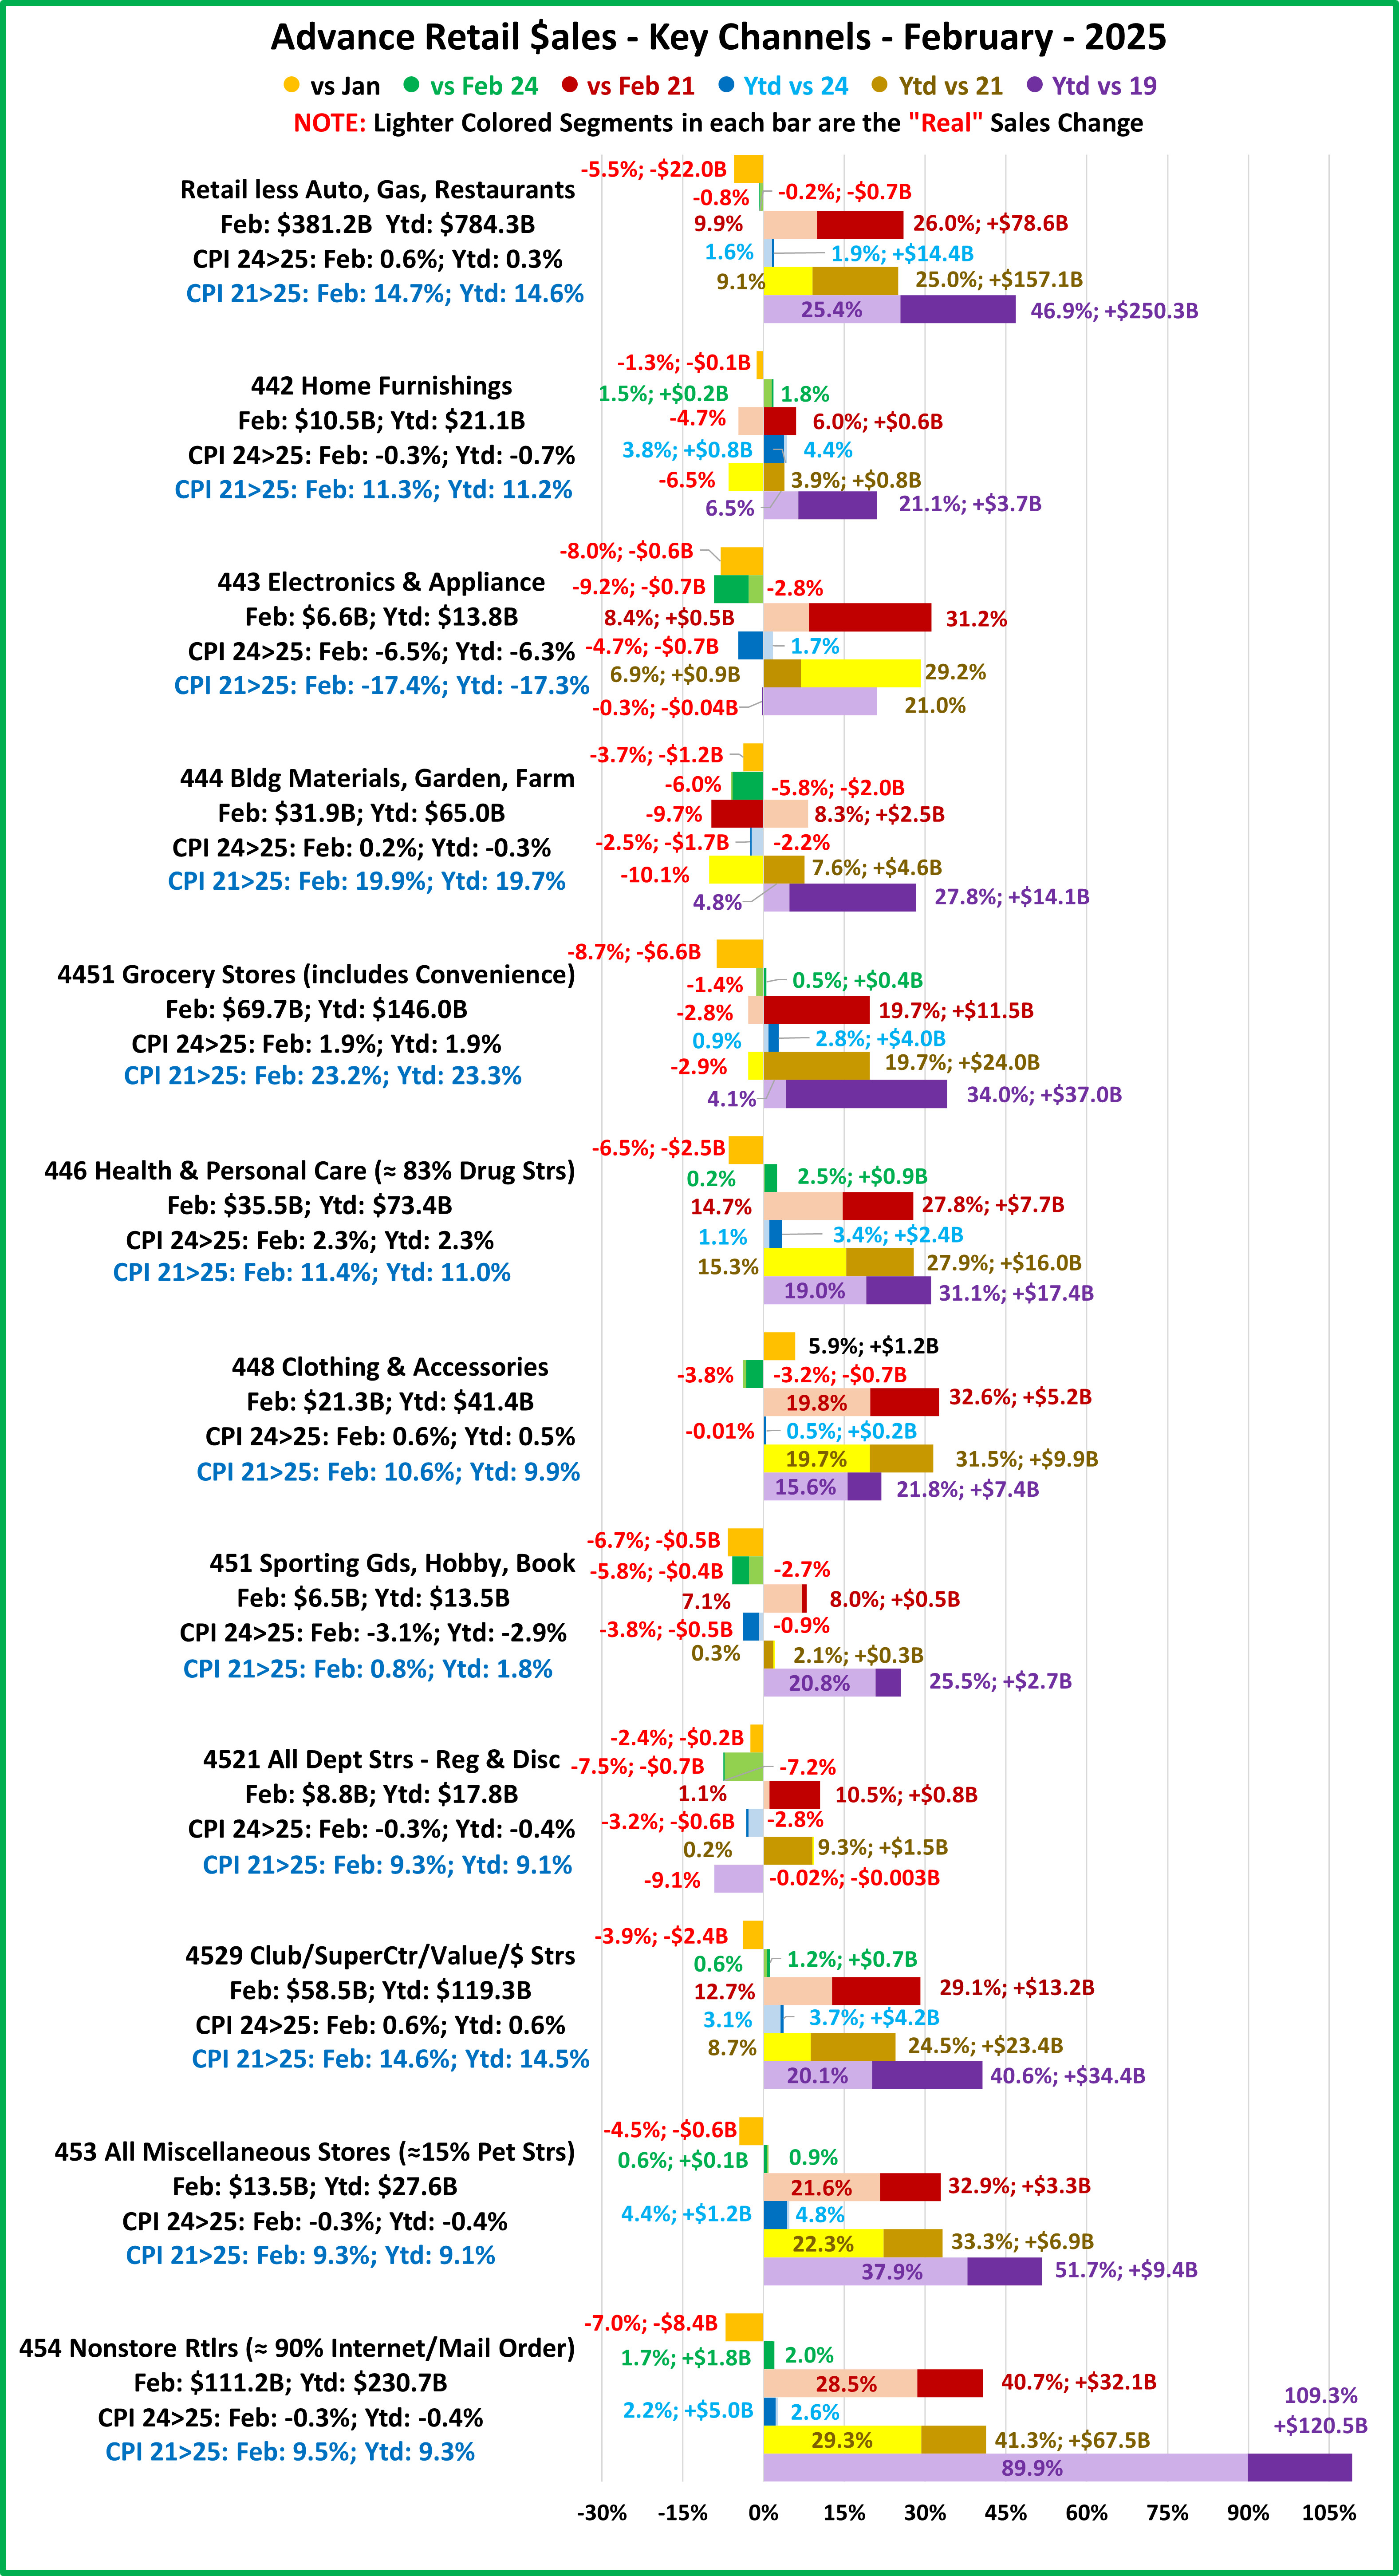
Now let’s take a closer look at Relevant Retail. We will report on the 11 channels in our Advance report.

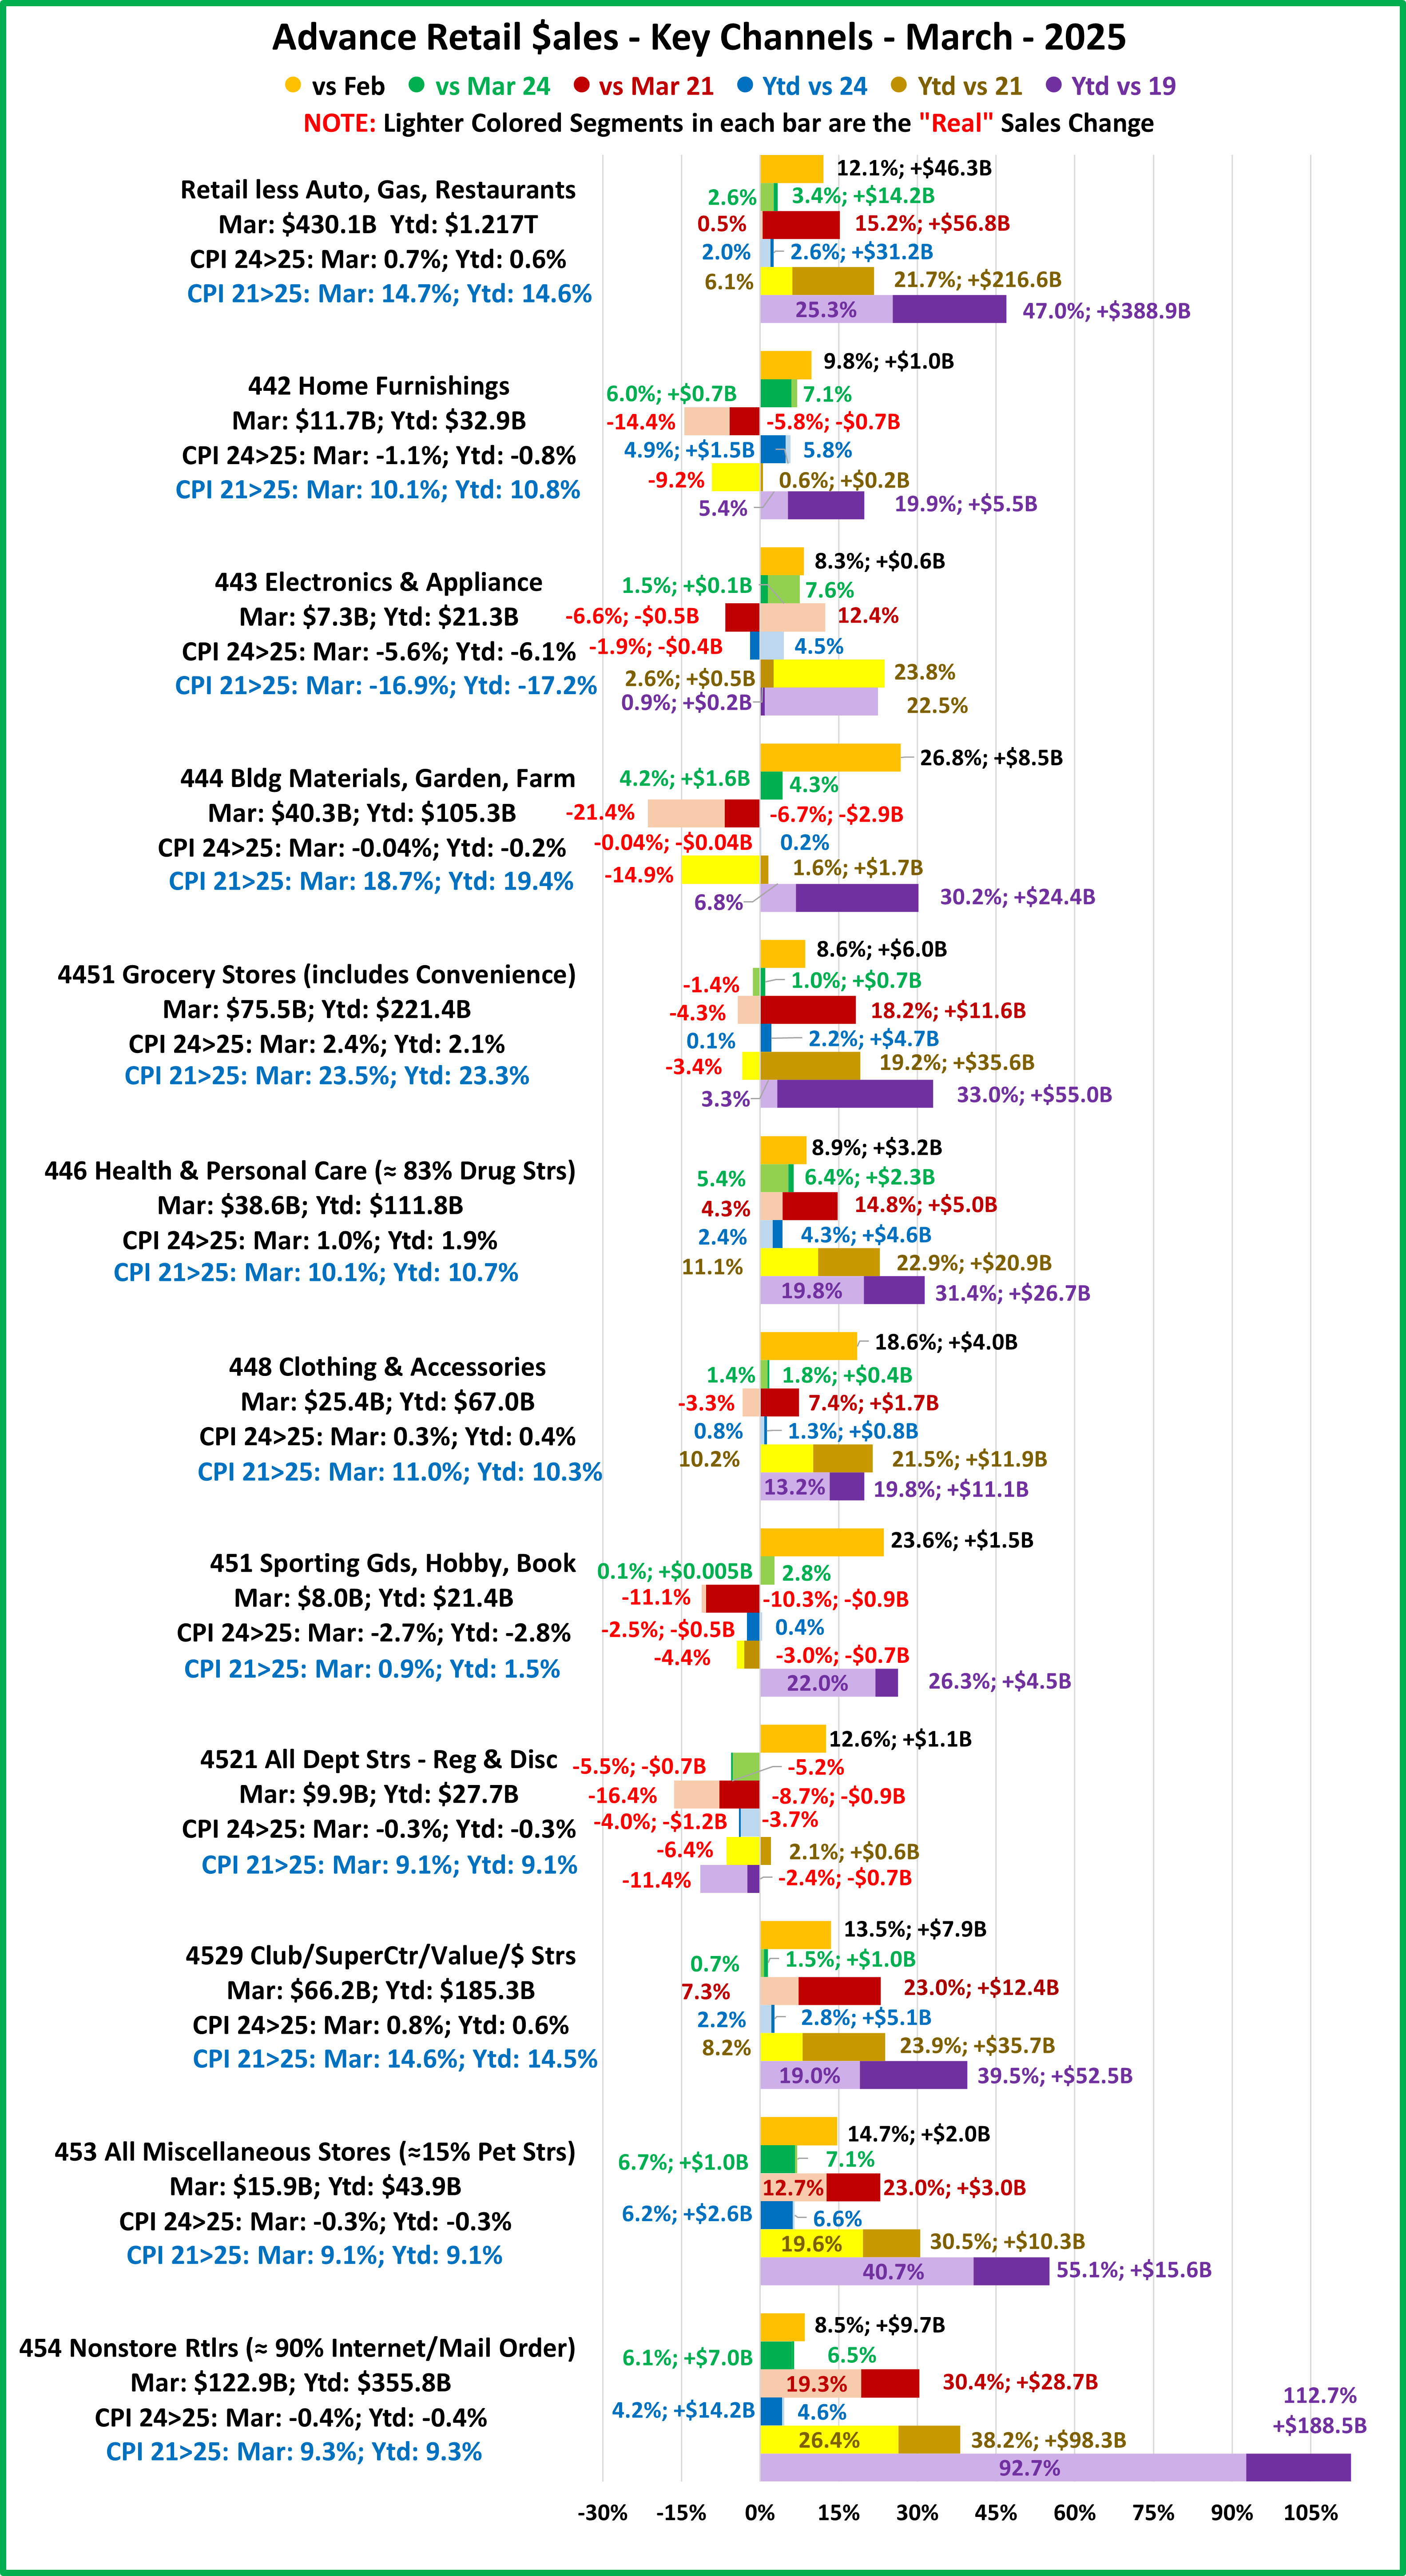
11 Relevant Retail Channels (98% of Ytd Rel Rtl $)
Relevant Retail – Their +3.6% lift in 24 was -22.8% below average. No drops in 25. The lifts for February, March, May & June were below average, but Jan, April & July were above average. The July lift is +4.8%, 1.7% above avg.
Furniture – No drops. Lifts were double the average in January, March & April but still big in May>Jul. The huge lifts in Mar>Jul were probably due to fear of skyrocketing prices from impending tariffs.
Electronics/Appliances – They have ongoing high deflation. $ Drops in both January & February. Sales turned positive in Mar, dropped in Apr>May, returned to positive, +0.7% in Jun, then dropped -1.7% in July. The 2 lifts were both below avg.
Bldg Matl/Garden/Farm – They had the smallest of the 4 drops in 23>24, -0.6%, but the 3rd biggest decrease (of 6) in Feb, -6.1%. They had lifts in Jan, Mar, Apr & Jun but all were below avg. The Jan, Apr & Jun increases were over 70% below avg. May (-2.8%) & July (-1.5%) brought 2 more drops but Feb was still the biggest of the year.
Grocery – Sales were only +2.0% in 24, -36% below average but they surged in Jan, 63% above avg. Growth slowed to 1% or less in Feb>Mar, 70+% below avg. They had a strong rebound in Apr. Sales were +5.8%, 93% above avg. The lifts slowed markedly in May>Jun, but increased in July to +3.4%, 10.6% above avg.
Health/Drug – Sales were +3.6% in 24, -31% below avg. The lifts grew to 4+% in Jan/Feb, surged in Mar/Apr to +8.9%, 75+% above avg, then slowed to +7.3% in May. In June, $ were +11.1%, 123% above avg. July was +5.4%, 3% above avg.
Clothing – 24 $: +2.5%, -19% below avg. A strong start to 25, but Sales fell -2.4% in Feb. However, the Mar lift was 1% above avg, then Sales “took off” in Apr to +6.9%, more than double the avg lift. The strong lift continued in May, +5.3%, 60% above avg. The binge buying ended in Jun as the lift slowed to +2.9%, but resumed in July, +7.4%, 127% above avg.
Sport/Hobby/Book – They were -2.8% in 24. This trend continued and hit bottom at -6.4% in Feb. In Mar>May they turned slightly positive, peaking at +2.0% in May, -39% below avg. June fell -1.1%, but July rose to +2.3%, 27% below avg.
Department Strs – It’s difficult to find something positive. They were -4.6% in 24 and had drops Jan>Jul in 25. The biggest drop was -5.9% in Feb and the smallest was -0.2% in July. Sort of good news: 5 of 7 drops in 25 were less than avg.
Clubs/SupCtrs/Value/$ – They offer value & convenience – 1 stop shopping. They have had strong growth from the start. COVID accelerated growth so it is no surprise that all lifts are below avg. They even had small <-0.3% drops in Feb/Mar. April improved to +5.3% but sales slowed to +3.5% in May and +1.4% in Jun. July rebounded to +3.3%, -61% below avg.
Miscellaneous – Pet Stores account for 15+% of this group’s sales. They had 2 below avg lifts, Feb & Apr. The Jan & Mar lifts were 80+% above avg and the May>Jul lifts were more than double the avg. They have the 2nd best performance of any channel, behind Furniture Stores, and they achieved it without the benefit of a pre-tarifflation buying surge.
Nonstore – 90% of $ are from internet/mail order (vast majority is internet). The Internet has had strong sales growth since its inception, but it skyrocketed due to COVID’s “stay at home” behavior. They have an avg lift of about 10%. Their 24 lift was +8.1%. From Jan>Jun, all lifts in 25 were below this and below average – no surprise. That partially changed with the +8.3% lift in July but it was still -20.9% below avg. Low: Feb +5.0%; High: Jul +8.3%
SUMMARY
23>24: $↓: 4; ↓Avg: 6; ↑Avg: 1
7 MONTHS JAN>JUL: $↓: 21; ↓Avg: 32; ↑Avg: 24
Jan: $↓: 3; ↓Avg: 4; ↑Avg: 4; Feb: $↓: 6; ↓Avg: 5; ↑Avg: 0; Mar: $↓: 2; ↓Avg: 5; ↑Avg: 4; Apr: $↓: 2; ↓Avg: 5; ↑Avg: 4;
May: $↓: 3; ↓Avg: 4; ↑Avg: 4; Jun: $↓: 2; ↓Avg: 6; ↑Avg: 3; Jul: $↓: 3; ↓Avg: 3; ↑Avg: 5;
In the above Summary, regarding Drops and Above Average lifts, a green number indicates the best and a red number is the worst. The best months are Mar, Apr & Jul. The worst is Feb. However, the biggest positive change occurred in March. 4 channels with drops turned positive. 3 became below average and 1 above average. 3 with below average lifts moved up to above average. The classification of 4 were unchanged so 7 fueled the improvement. April was the same as Mar. May was worse than April due to 3 drops. In Jun, Drops fell to 2 but above avg fell to 3. Note: 4+ has become the norm in above avg lifts. We can’t forget January. The number of positive lifts vs Y/E 24 moved up from 7 to 8 but the number with above avg lifts rose from 1 to 4 – a big change. Even with 6 drops/below avg lifts, the situation in July has greatly improved from 11 in Feb. The overall July CPI is low and stable from June, and 5 lifts are above avg, but the channels still had mixed performances.
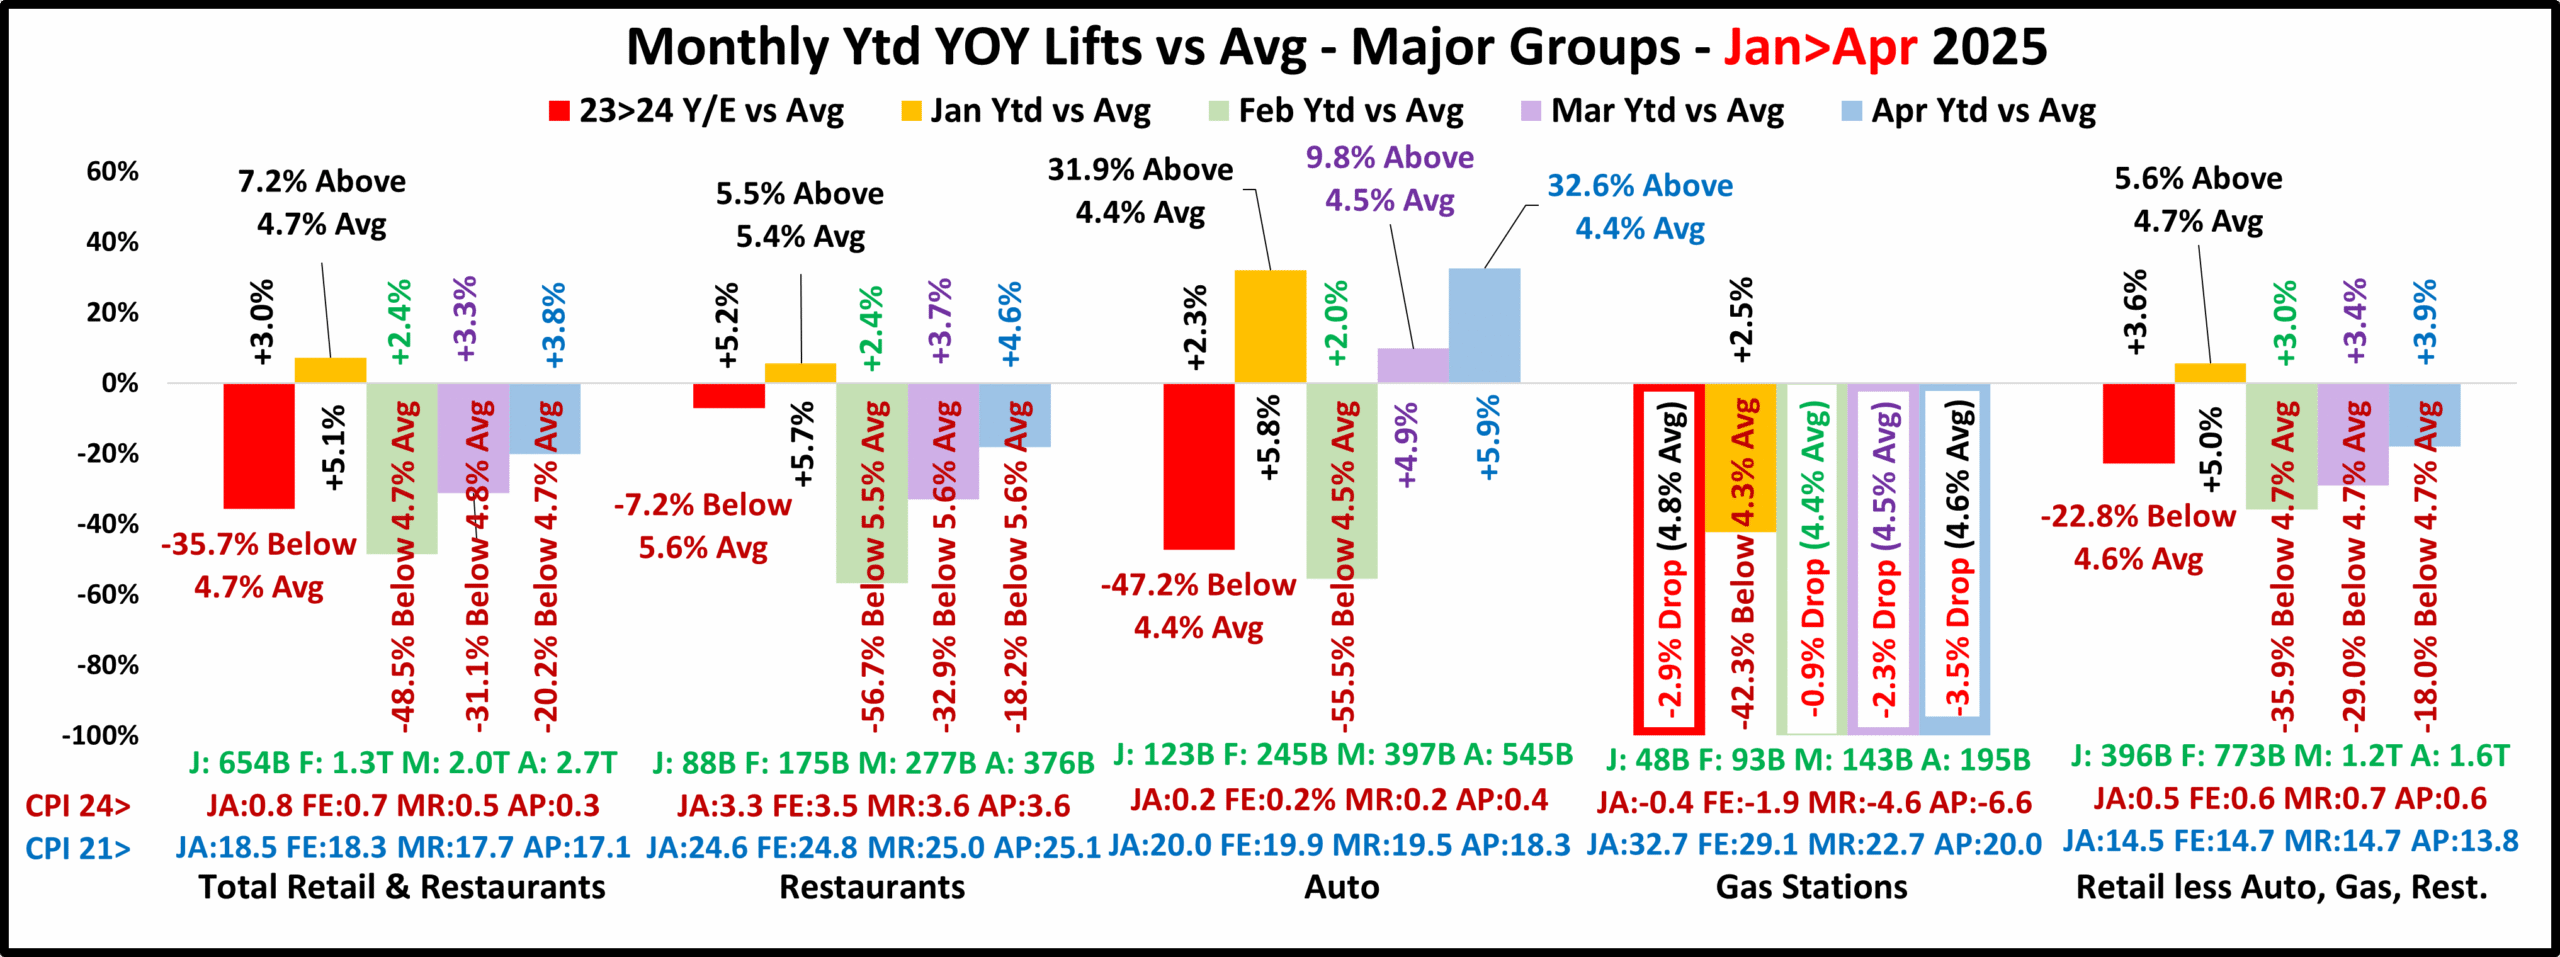
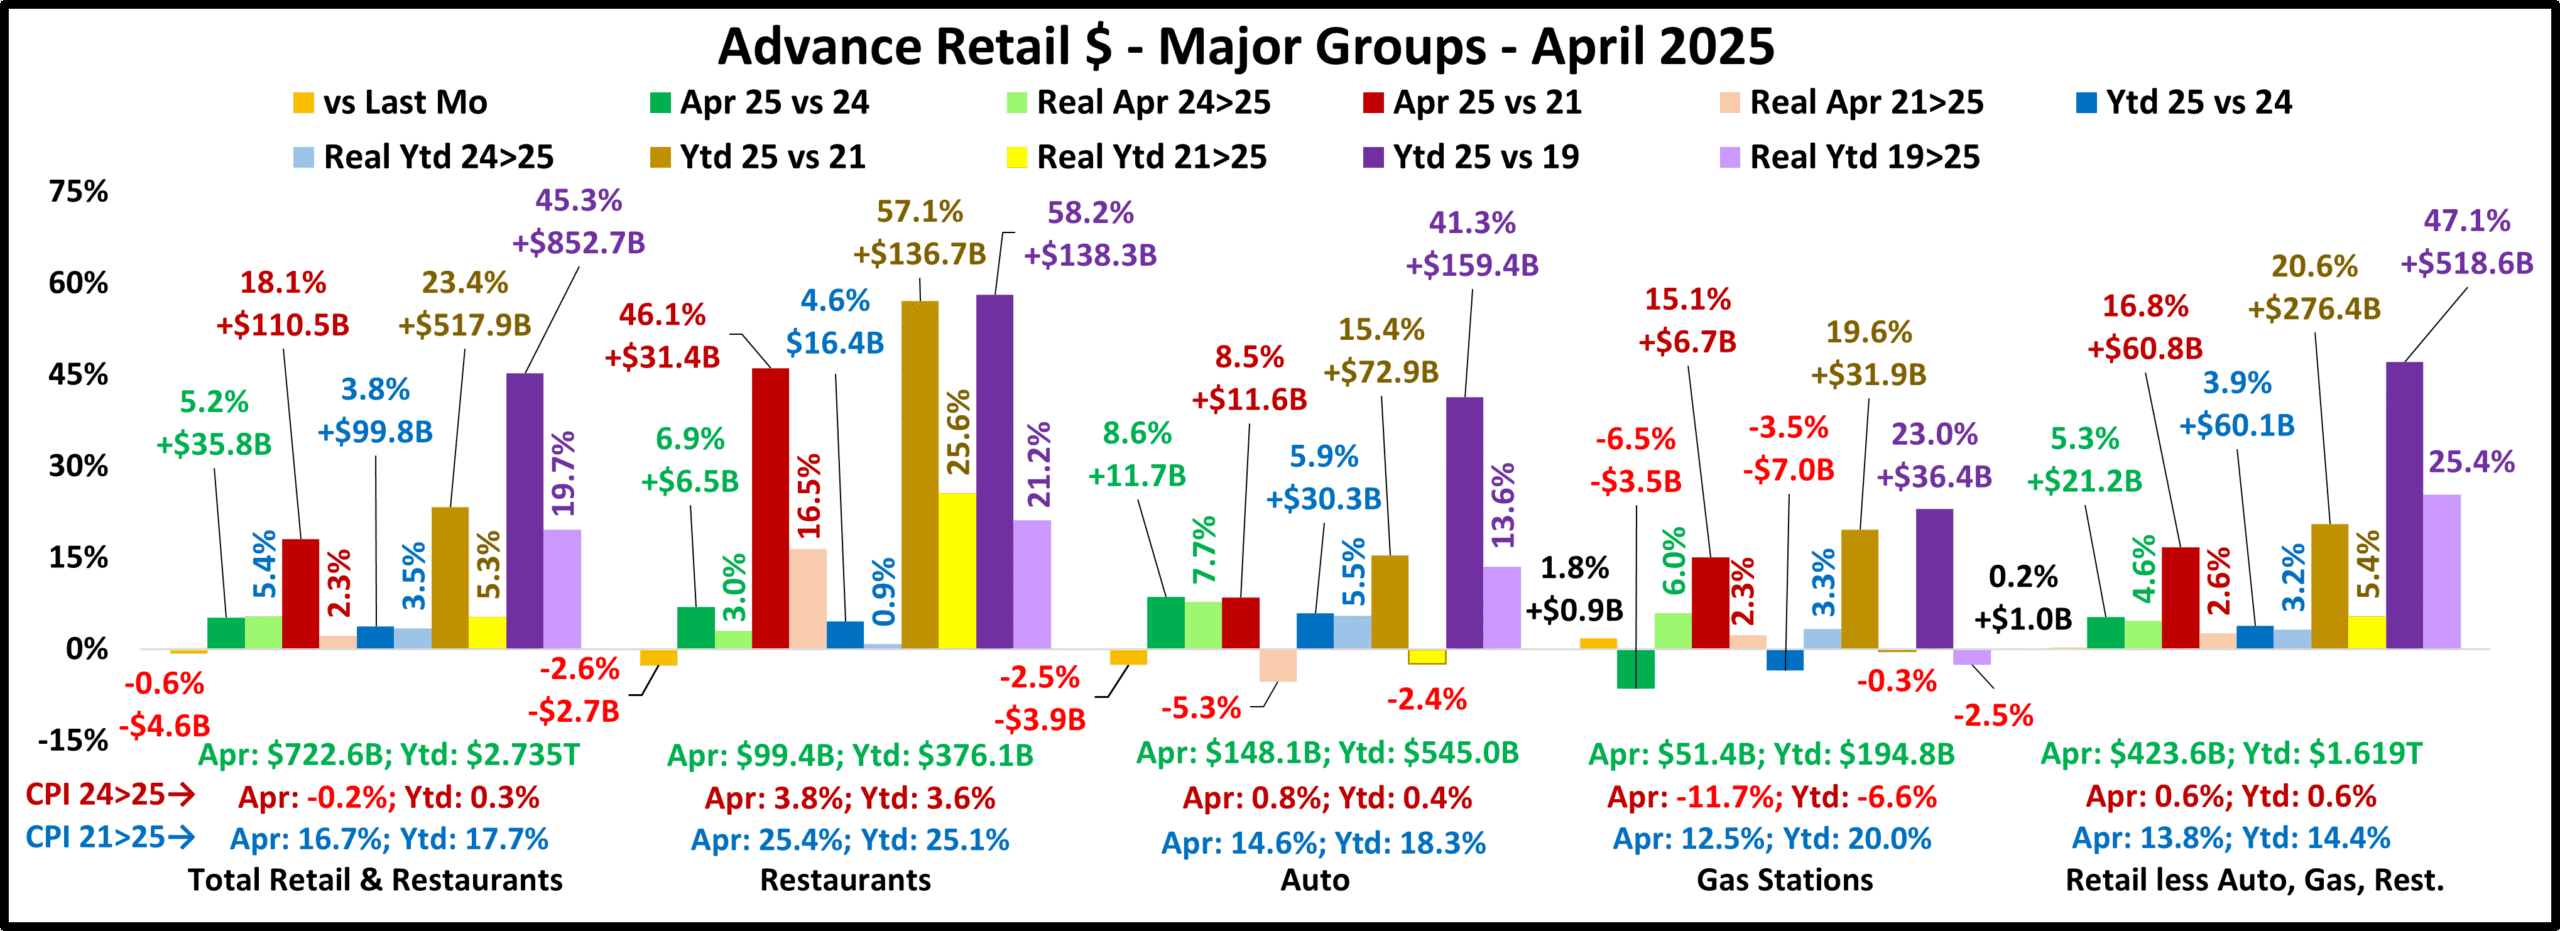
Now let’s take a different view of the data from the Big Groups and the same 11 channels. Rather than monthly sales, we will look at Ytd numbers. We will still view them monthly so we can see any trends.
The Ytd numbers are arguably the most important. In December, they become Year-End, which is the most quoted and remembered data in any year. While the monthly data shows what’s happening in the marketplace right now, the Ytd data consolidates the data. This blending extends the impact of big sales spikes – positive or negative. This can be either good or bad. The impact of the big drop in February 25 was lessened by the widespread Above Average January lift. It can also work the other way. The big February drop reduced the positivity of stronger lifts in Mar>Jul. Overall, progress stalled in May/June, then restarted in July. We’ll begin our analysis with the Big Retail Groups.

You notice that the spending patterns for Relevant & Total Retl are almost identical. Jan was good for all – 5 lifts, 4 above avg. Feb was bad. Gas Station $ dropped while the others had their most Below Avg lift. In Mar>Jul, only Auto had Above Avg lifts and only Gas Stations had any drops. Restaurants steadily improved but the others’ progress paused in May>Jul.
Restaurants – Sales for 24 were +5.2%, -7% below average. They flipped to above avg in Jan, then the lift radically slowed in Feb to +2.4%, -57% below avg. The situation steadily improved in Mar>May, then the progress slowed in Jun>Jul. Their YOY lift essentially stabilized at about +5%, -6>10% below avg for May>Jul. They did beat 24’s +5.18% with +5.22% in July.
Auto – Sales were +2.3% in 24, -47% below avg and the worst “positive” performance of any group. They turned it around in Jan with an above avg lift. The lift dropped to +2.0% in Feb, -56% below avg and the smallest lift of any positive big group. Their pre-tarifflation buying lift started in Mar/Apr, peaking at +5.9% in April, 33% above avg. In May>Jul the surge slowed, and the lift fell to ≈5%. They are the only Group with Mar>Jul above avg lifts.
Gas Stations – Whether you look at the data monthly or Ytd, they are doing bad. The Apr>Jul Ytd sales drops of over -3.4% are significantly worse than the -2.9% at Y/E 24. That does not bode well for 2025.
Relevant Retail – Except for Jan, +5.0% and now July, +4.1%, their YOY lift was stuck in the 3% range. Thanks to an Above avg monthly lift, April Ytd, +3.9%, did finally exceed the +3.6% of 2024. The lift stayed at about +3.9% in May>Jun, -16% to -18% below the Ytd avg. A strong, +4.8% July lift restarted their Ytd progress to +4.1%, only -14% below avg.
Total Retail – The pattern matches Relevant Retail but the YOY changes for all, but Jan & Mar are smaller. With similar avgs, Total has bigger disparities. Total includes Auto & Gas Stations which have had extreme lifts & drops. Their Mar>Apr progress also paused in May>Jun and increased slightly in July, but their Ytd YOY lift has been above 24 from Mar>Jul.
Summary and Comparison of Jan>Jul Monthly to Ytd
Monthly: Drops: 9; Below Avg Lifts: 11; Above Avg Lifts: 15
Ytd: Drops: 6; Below Avg Lifts: 20; Above Avg Lifts: 9
Mon: Jan: $↓: 0; ↓Avg: 1; ↑Avg: 4; Feb: $↓: 4; ↓Avg: 1; ↑Avg: 0; Mar: $↓: 1; ↓Avg: 2; ↑Avg: 2; Apr: $↓: 1; ↓Avg: 0; ↑Avg: 4;
Ytd: Jan: $↓: 0; ↓Avg: 1; ↑Avg: 4; Feb: $↓: 1; ↓Avg: 4; ↑Avg: 0; Mar: $↓: 1; ↓Avg: 3; ↑Avg: 1; Apr: $↓: 1; ↓Avg: 3; ↑Avg: 1;
Mon: May: $↓: 1; ↓Avg: 3; ↑Avg: 1; Jun: $↓: 1; ↓Avg: 3; ↑Avg: 1; Jul: $↓: 1; ↓Avg: 1; ↑Avg: 3
Ytd: May: $↓: 1; ↓Avg: 3; ↑Avg: 1; Jun: $↓: 1; ↓Avg: 3; ↑Avg: 1; Jul: $↓: 1; ↓Avg: 3; ↑Avg: 1
The Ytd report levels the Feb>Jul data. You can see this in the orange numbers in the February Drops and the March, April & July Above Average Lifts. The Ytd situation isn’t good but it’s better than 24 for all but Gas Stations. Monthly, the Big Groups were stable May>Jun then improved in July. In Ytd data, Mar>Jul was stable.
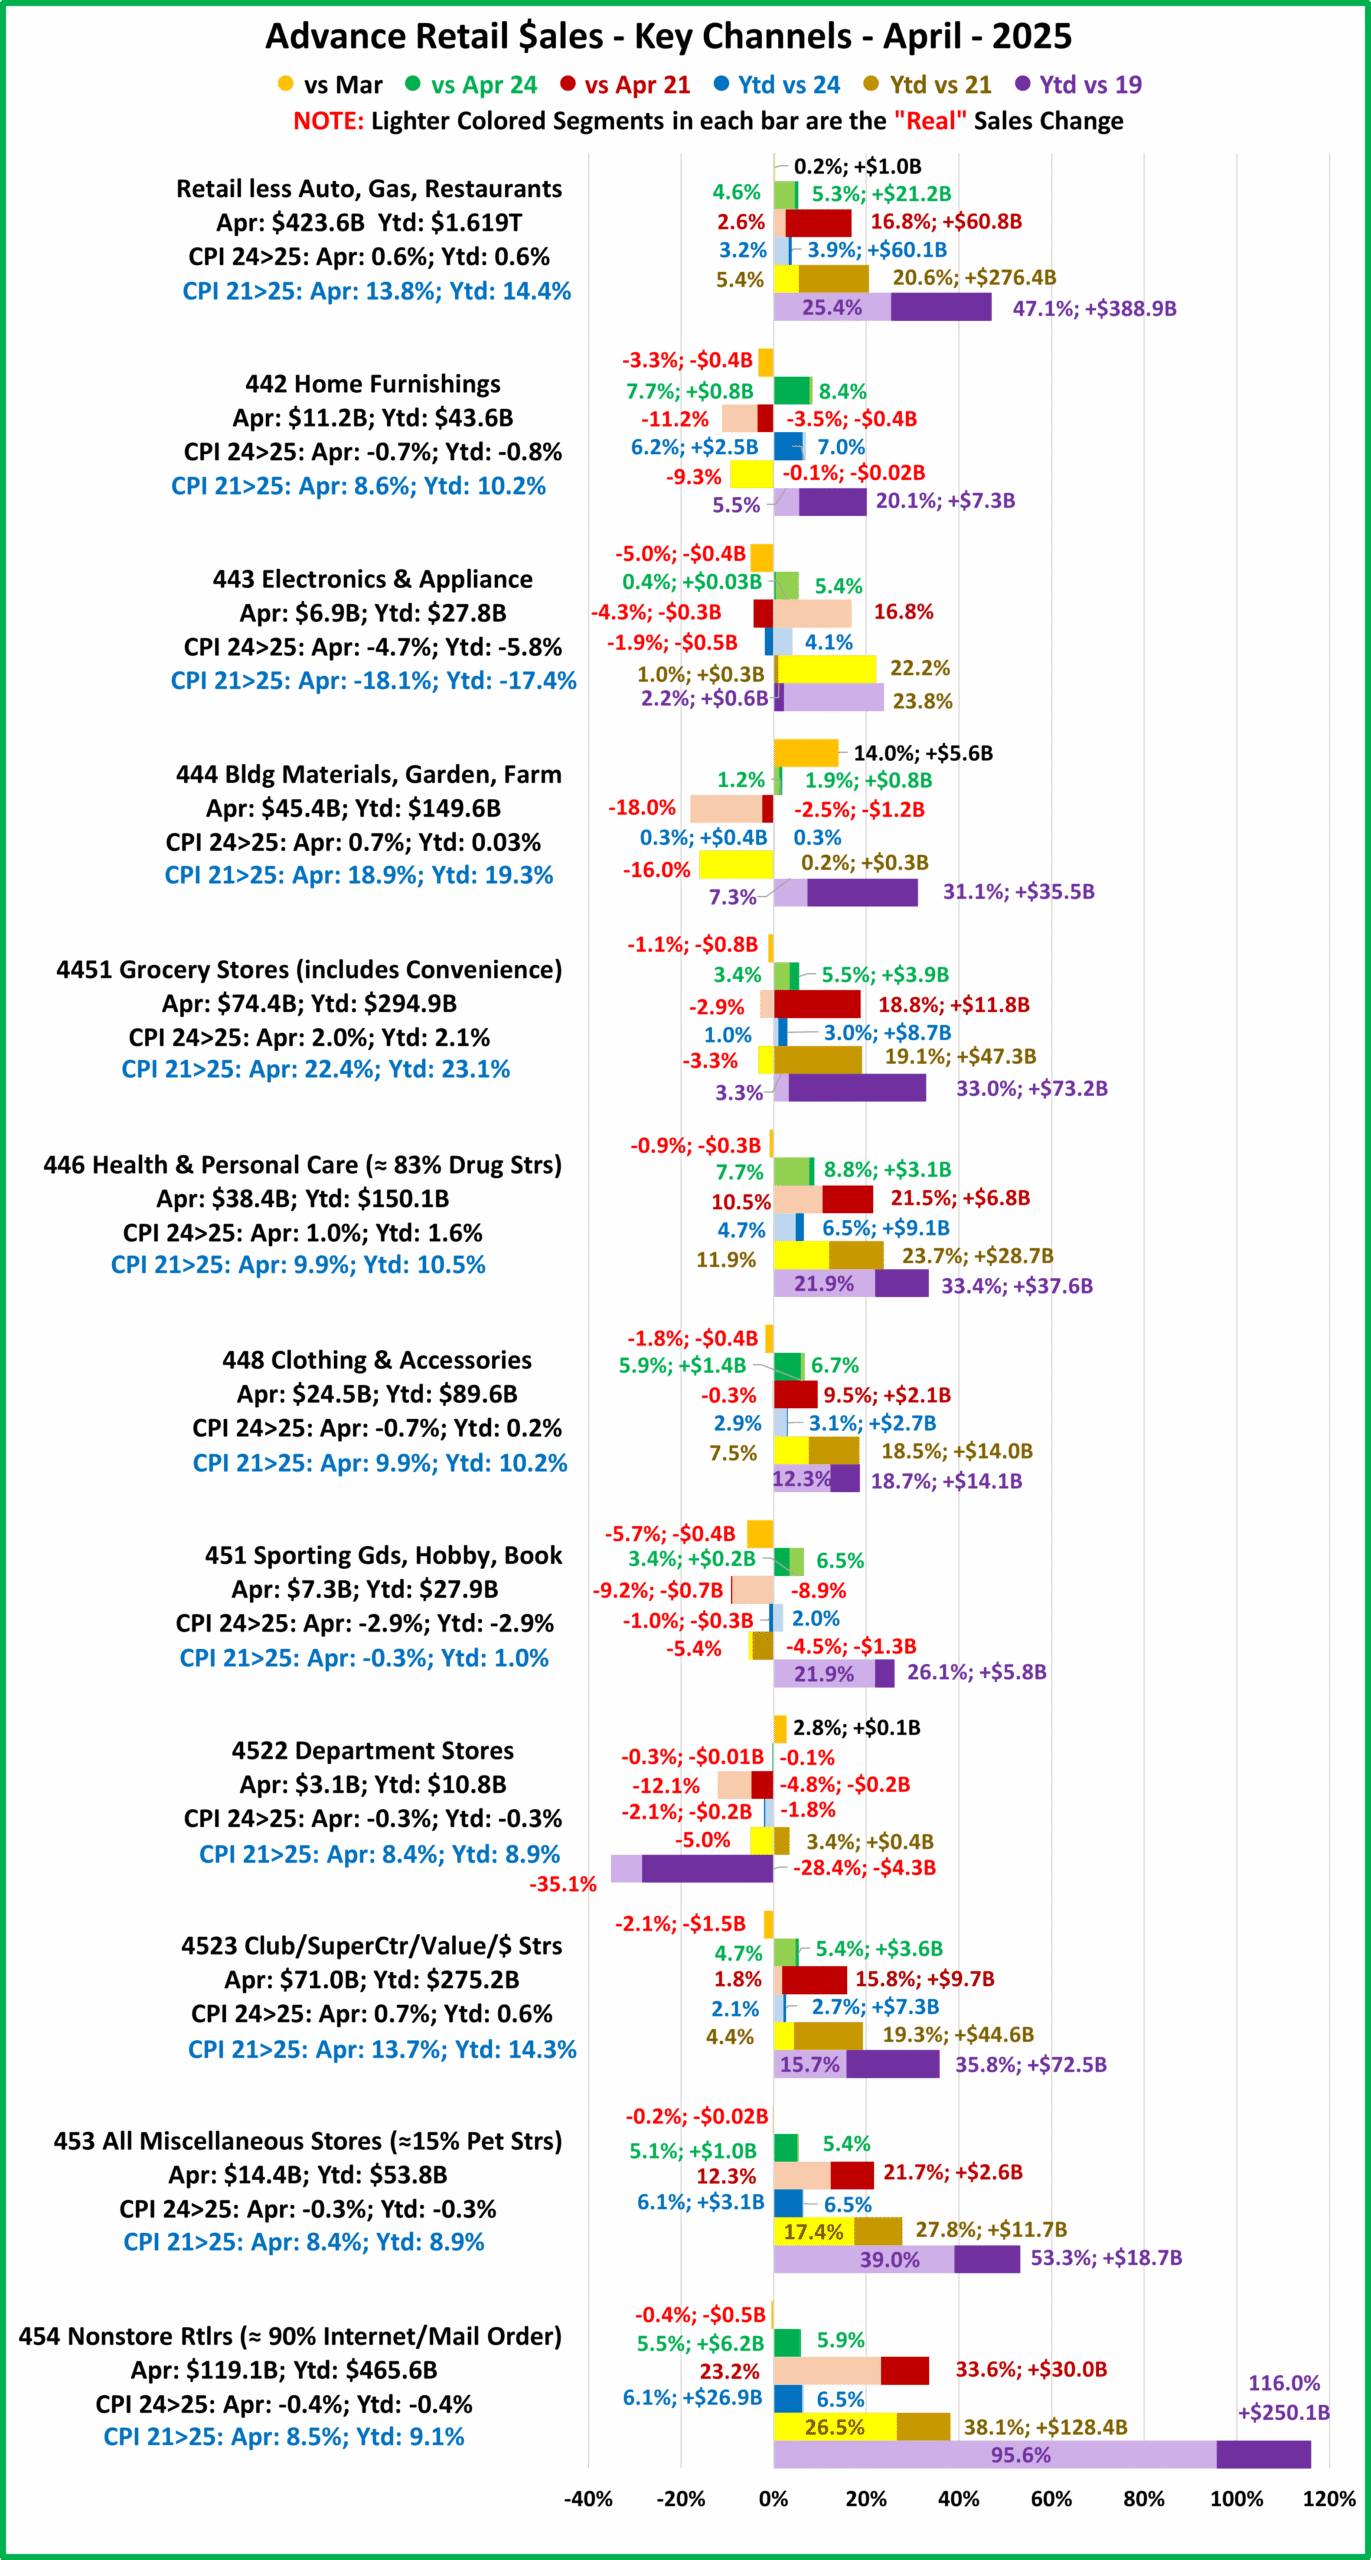
Now, Let’s look at Ytd Sales for Key Relevant Retail Channels

The Ytd chart looks a little more consistent than the Monthly chart. This is true. Ytd extends the impact of big lifts or drops. The Ytd version has 22% less Below Avg lifts (middle ground), but 24% more Drops and 8% more Above Avg lifts. The result is balance. Ytd also has 3 channels that had drops every month in 2025. Monthly has only 1. However, Ytd has 2 channels with Above Average lifts every month. Monthly has none. It’s a complex situation. Let’s get into the specifics.
Furniture Stores – They are going strong. Their huge January lift pushed the February Ytd lift from below to above avg. Now, all months are above average. Tarifflation fear caused binge buying in Mar>Jul so the current lift is still huge.
Electronics/Appliance – Ytd they are all negative. This version hides the small Mar & June lifts. The positive impact in the Ytd chart was that their YOY drop slowed from -5.0% in February to -1.6% in Jun/Jul
Bldg Matl/Garden/Farm – Their big February drop turned March from a below average monthly lift to a -0.4% Ytd drop. In a reversal, Mar/Apr lifts made Ytd April slightly positive, +0.1%. Sales fell in May & Jul so Ytd May>Jul was negative.
Grocery – Their big Jan lift made their Ytd situation look much better. However, Ytd essentially hid the huge above average lift in April and smaller one in July. Note: Ytd they have been above 24 Y/E in every 2025 month.
Health – Monthly & Ytd have a similar pattern – Jan/Feb, below avg; Mar>Jul, above avg. The June lift was huge, more than double the avg. The July lift was small, but Ytd is still 40% above avg and 97% better than 2024.
Clothing – Their big Jan lift eliminated the Feb drop in Ytd, but the Feb drop changed Mar from above to below average in Ytd. Huge lifts in Apr & Jul kept Ytd above avg and above 24 from Apr>Jul.
Sport/Hobby/Book – They had drops in Jan>Feb. Feb was -6.4%. This turned Ytd all negative. Mar>May had increasing monthly lifts. June $ dropped but July was +2.3%, the biggest lift in 25. Ytd is -0.4%, much better than -2.8% in 24.
Department Strs – Both reports show drops every month, but Ytd is better than 24. Their fade continues.
Club/SupCtr/Value/$ – They offer value and convenience, the biggest shopping drivers. Some $ stores are struggling but SuperCenters/Clubs are still going pretty strong. Besides the internet, one problem in sustaining strong growth is that they are running out of new customers. The Monthly report had a -0.2% drop in February and a -0.3% drop in March. The Ytd numbers look better. There are no drops, but the July Ytd lift is only +2.6%, 69% below avg and 10% below 24.
Miscellaneous – This is probably our favorite channel because it includes pet stores. They also have great performance. In the Monthly report, only the YOY lifts for Feb & Apr are below avg. All others are above avg. The Ytd report is even better. All months are above avg and July is +8.2%, 91% above average and 52% more than Y/E 24.
Nonstore – They are driven by the internet which has had the strongest growth and became the biggest $ channel in 2020. The Monthly & Ytd reports have similar patterns – all months below avg. July Ytd is +6.7%. That sounds great but it is -33% below avg & -17% less than 24. It is difficult, if not impossible to maintain double digit growth…forever.
Relevant Retail – They had no drops and 3 above avg monthly lifts – only 1 (Jan) in Ytd. Ytd shows Mar>Apr growth, a May>Jun pause and a small lift in July. The group’s Ytd performance in Apr>Jul exceeds +3.6% in 24 and July is +4.1%, only -14% below avg. Here is a summary and comparison of Jan>Jul Monthly to Ytd for the 11 channels.
Monthly: Drops: 21; Below Avg Lifts: 32; Above Avg Lifts: 24
Ytd: Drops: 26; Below Avg Lifts: 25; Above Avg Lifts: 26
Mon: Jan: $↓: 3; ↓Avg: 4; ↑Avg: 4; Feb: $↓: 6; ↓Avg: 5; ↑Avg: 0; Mar: $↓: 2; ↓Avg: 5; ↑Avg: 4; Apr: $↓: 2; ↓Avg: 5; ↑Avg: 4
Ytd: Jan: $↓: 3; ↓Avg: 4; ↑Avg: 4; Feb: $↓: 4; ↓Avg: 5; ↑Avg: 2; Mar: $↓: 4; ↓Avg: 4; ↑Avg: 3; Apr: $↓: 3; ↓Avg: 3; ↑Avg: 5
Mon: May: $↓: 3; ↓Avg: 4; ↑Avg: 4; Jun: $↓: 2; ↓Avg: 6; ↑Avg: 3; Jul: $↓: 3; ↓Avg: 3; ↑Avg: 5
Ytd: May: $↓: 4; ↓Avg: 3; ↑Avg: 4; Jun: $↓: 4; ↓Avg: 3; ↑Avg: 4; Jul: $↓: 4; ↓Avg: 3; ↑Avg: 4
The key differences between the Monthly & Ytd reports are in the lingering Ytd impact of big drops and lifts. Both views are critically important. Monthly shows what is currently happening in the marketplace and Ytd puts it into perspective. They also show trends over time. Ytd provides an overview while Monthly shows the details fueling the movement.
Inflation negatively affects retail growth both in the short term, with spikes or drops, and in the long term, with cumulative high prices. It can even have an impact before it happens. We saw this with pre-tarifflation “fear” buying. The current retail situation is not good. The YOY lifts vs 24 are generally below the long term avg for most channels. Retail “hit bottom” in Feb but most channels (not Gas Stations or Dept stores) showed improvement in Mar/Apr. The monthly situation worsened in May/Jun, then improved in July. Ytd it is stable & better than 24. Inflation is low, but prices are still high. We’ll see if tariffs have a noticeable impact.
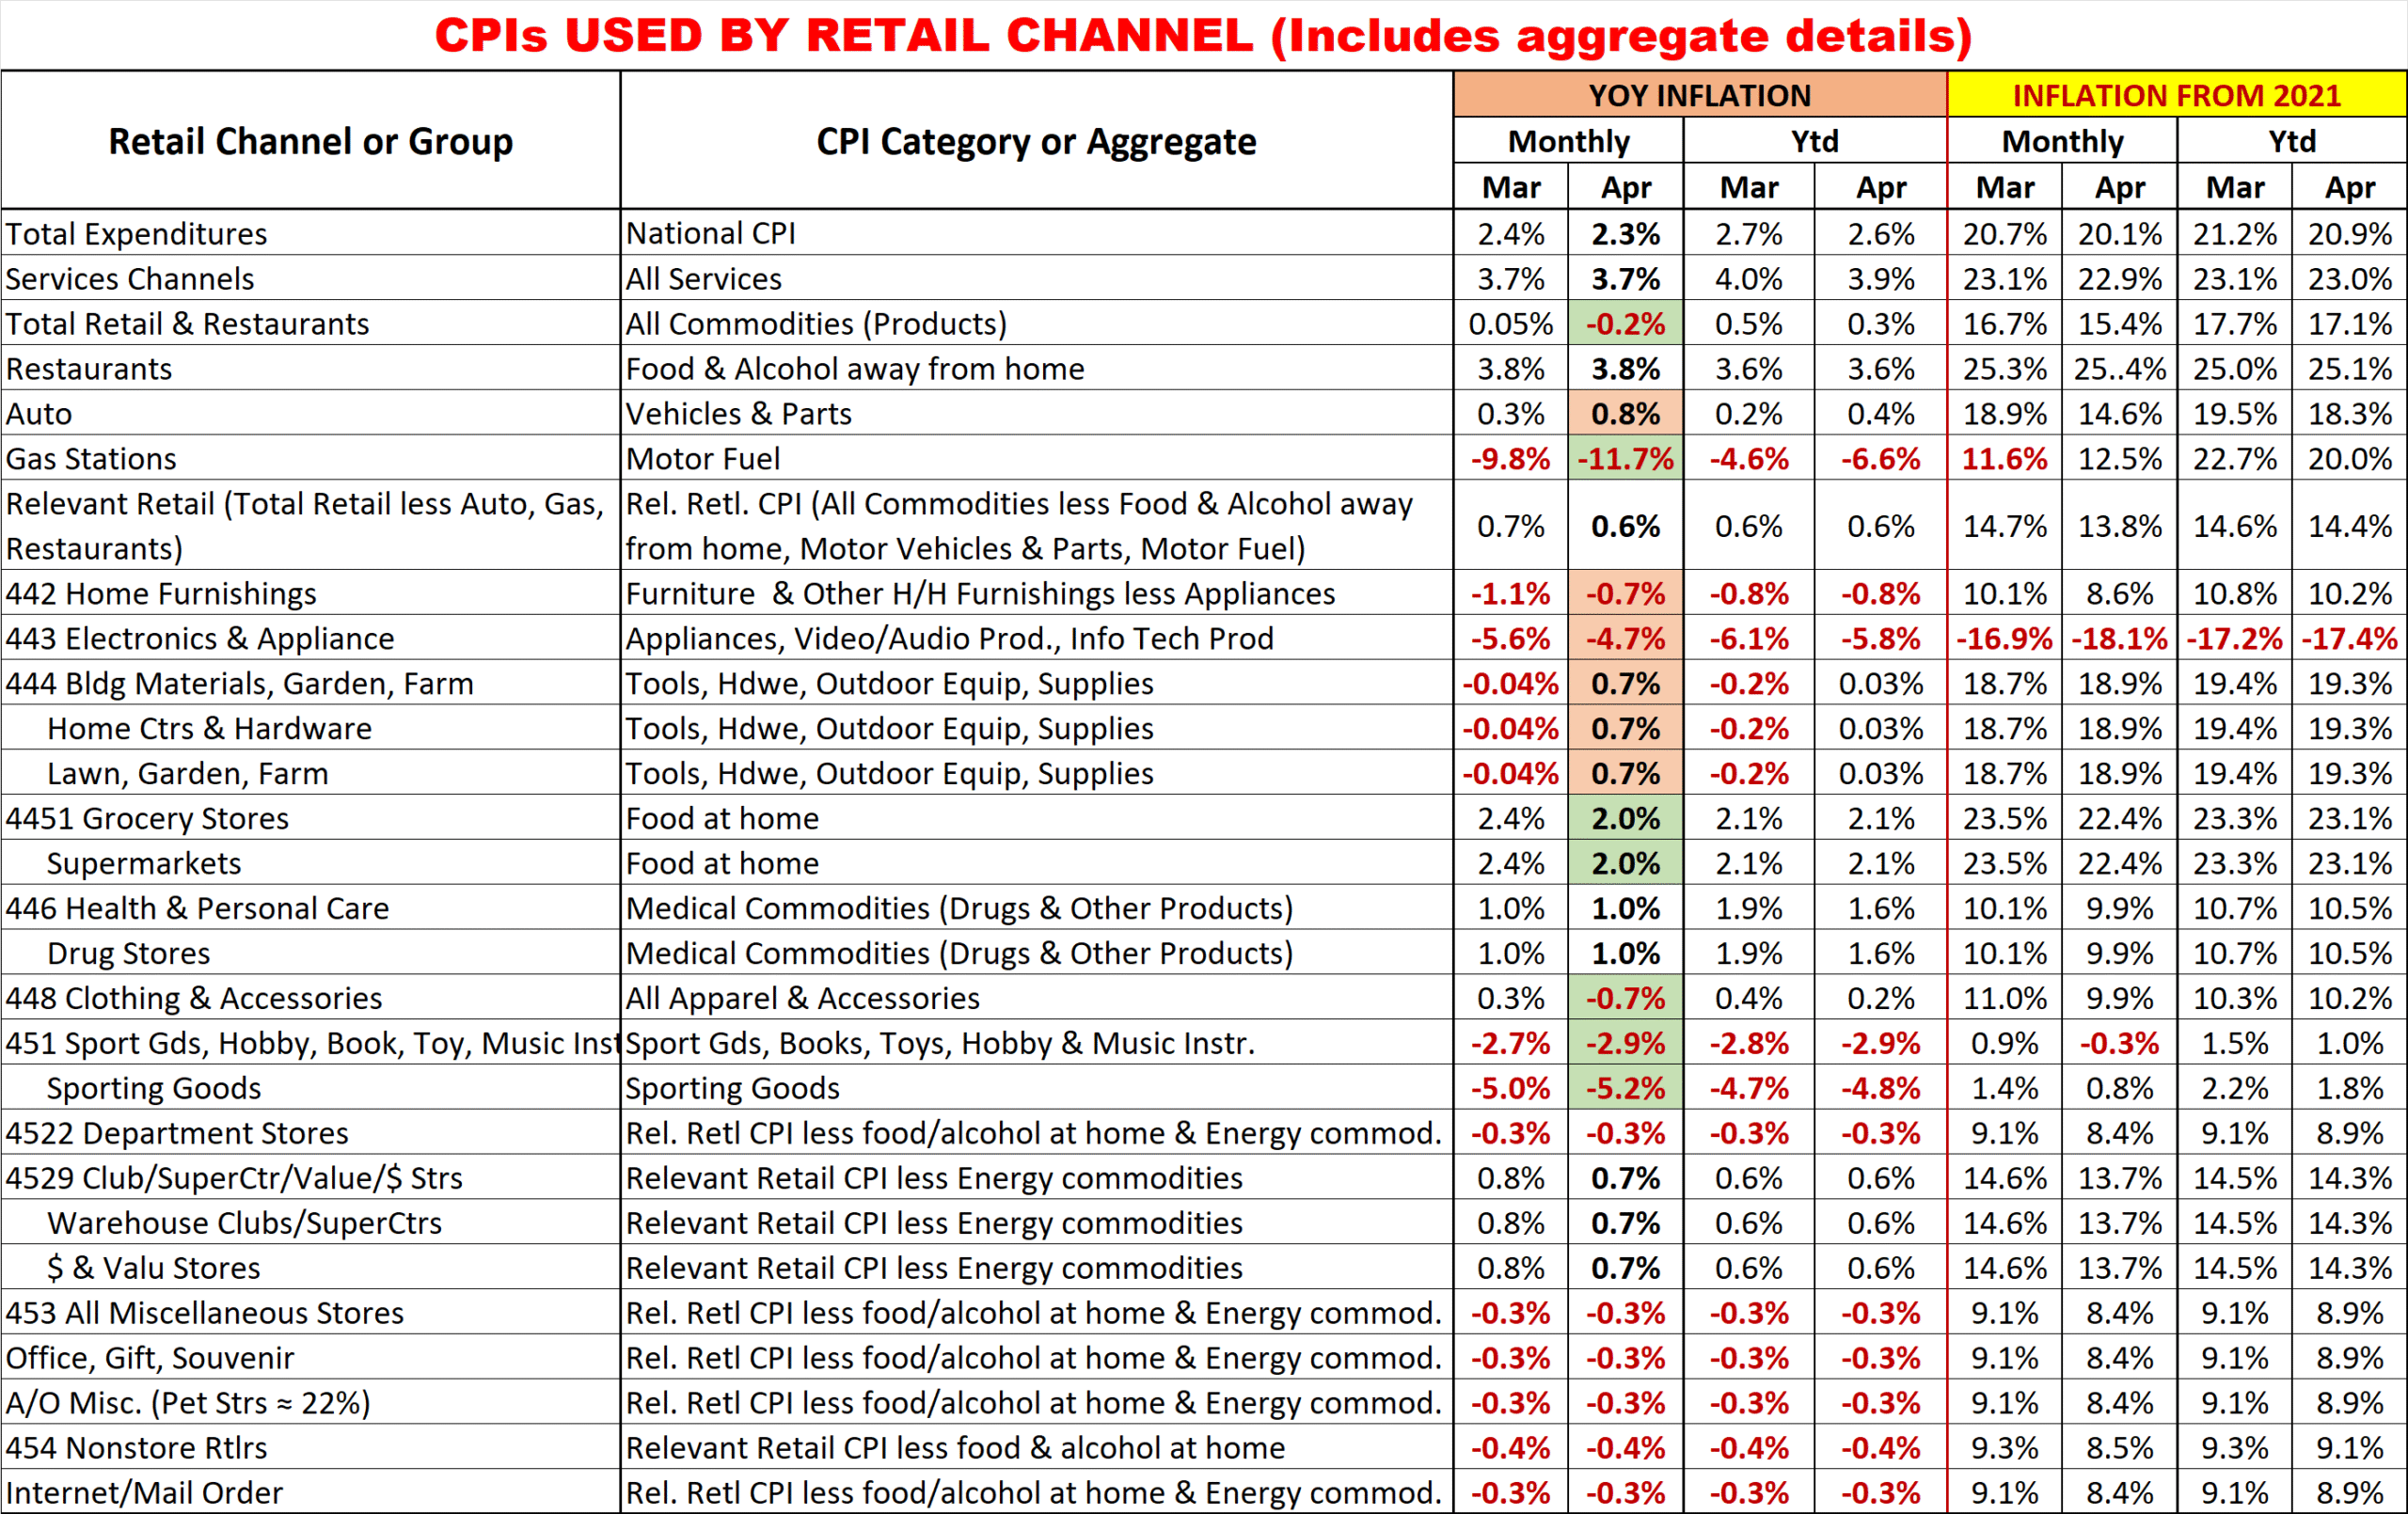
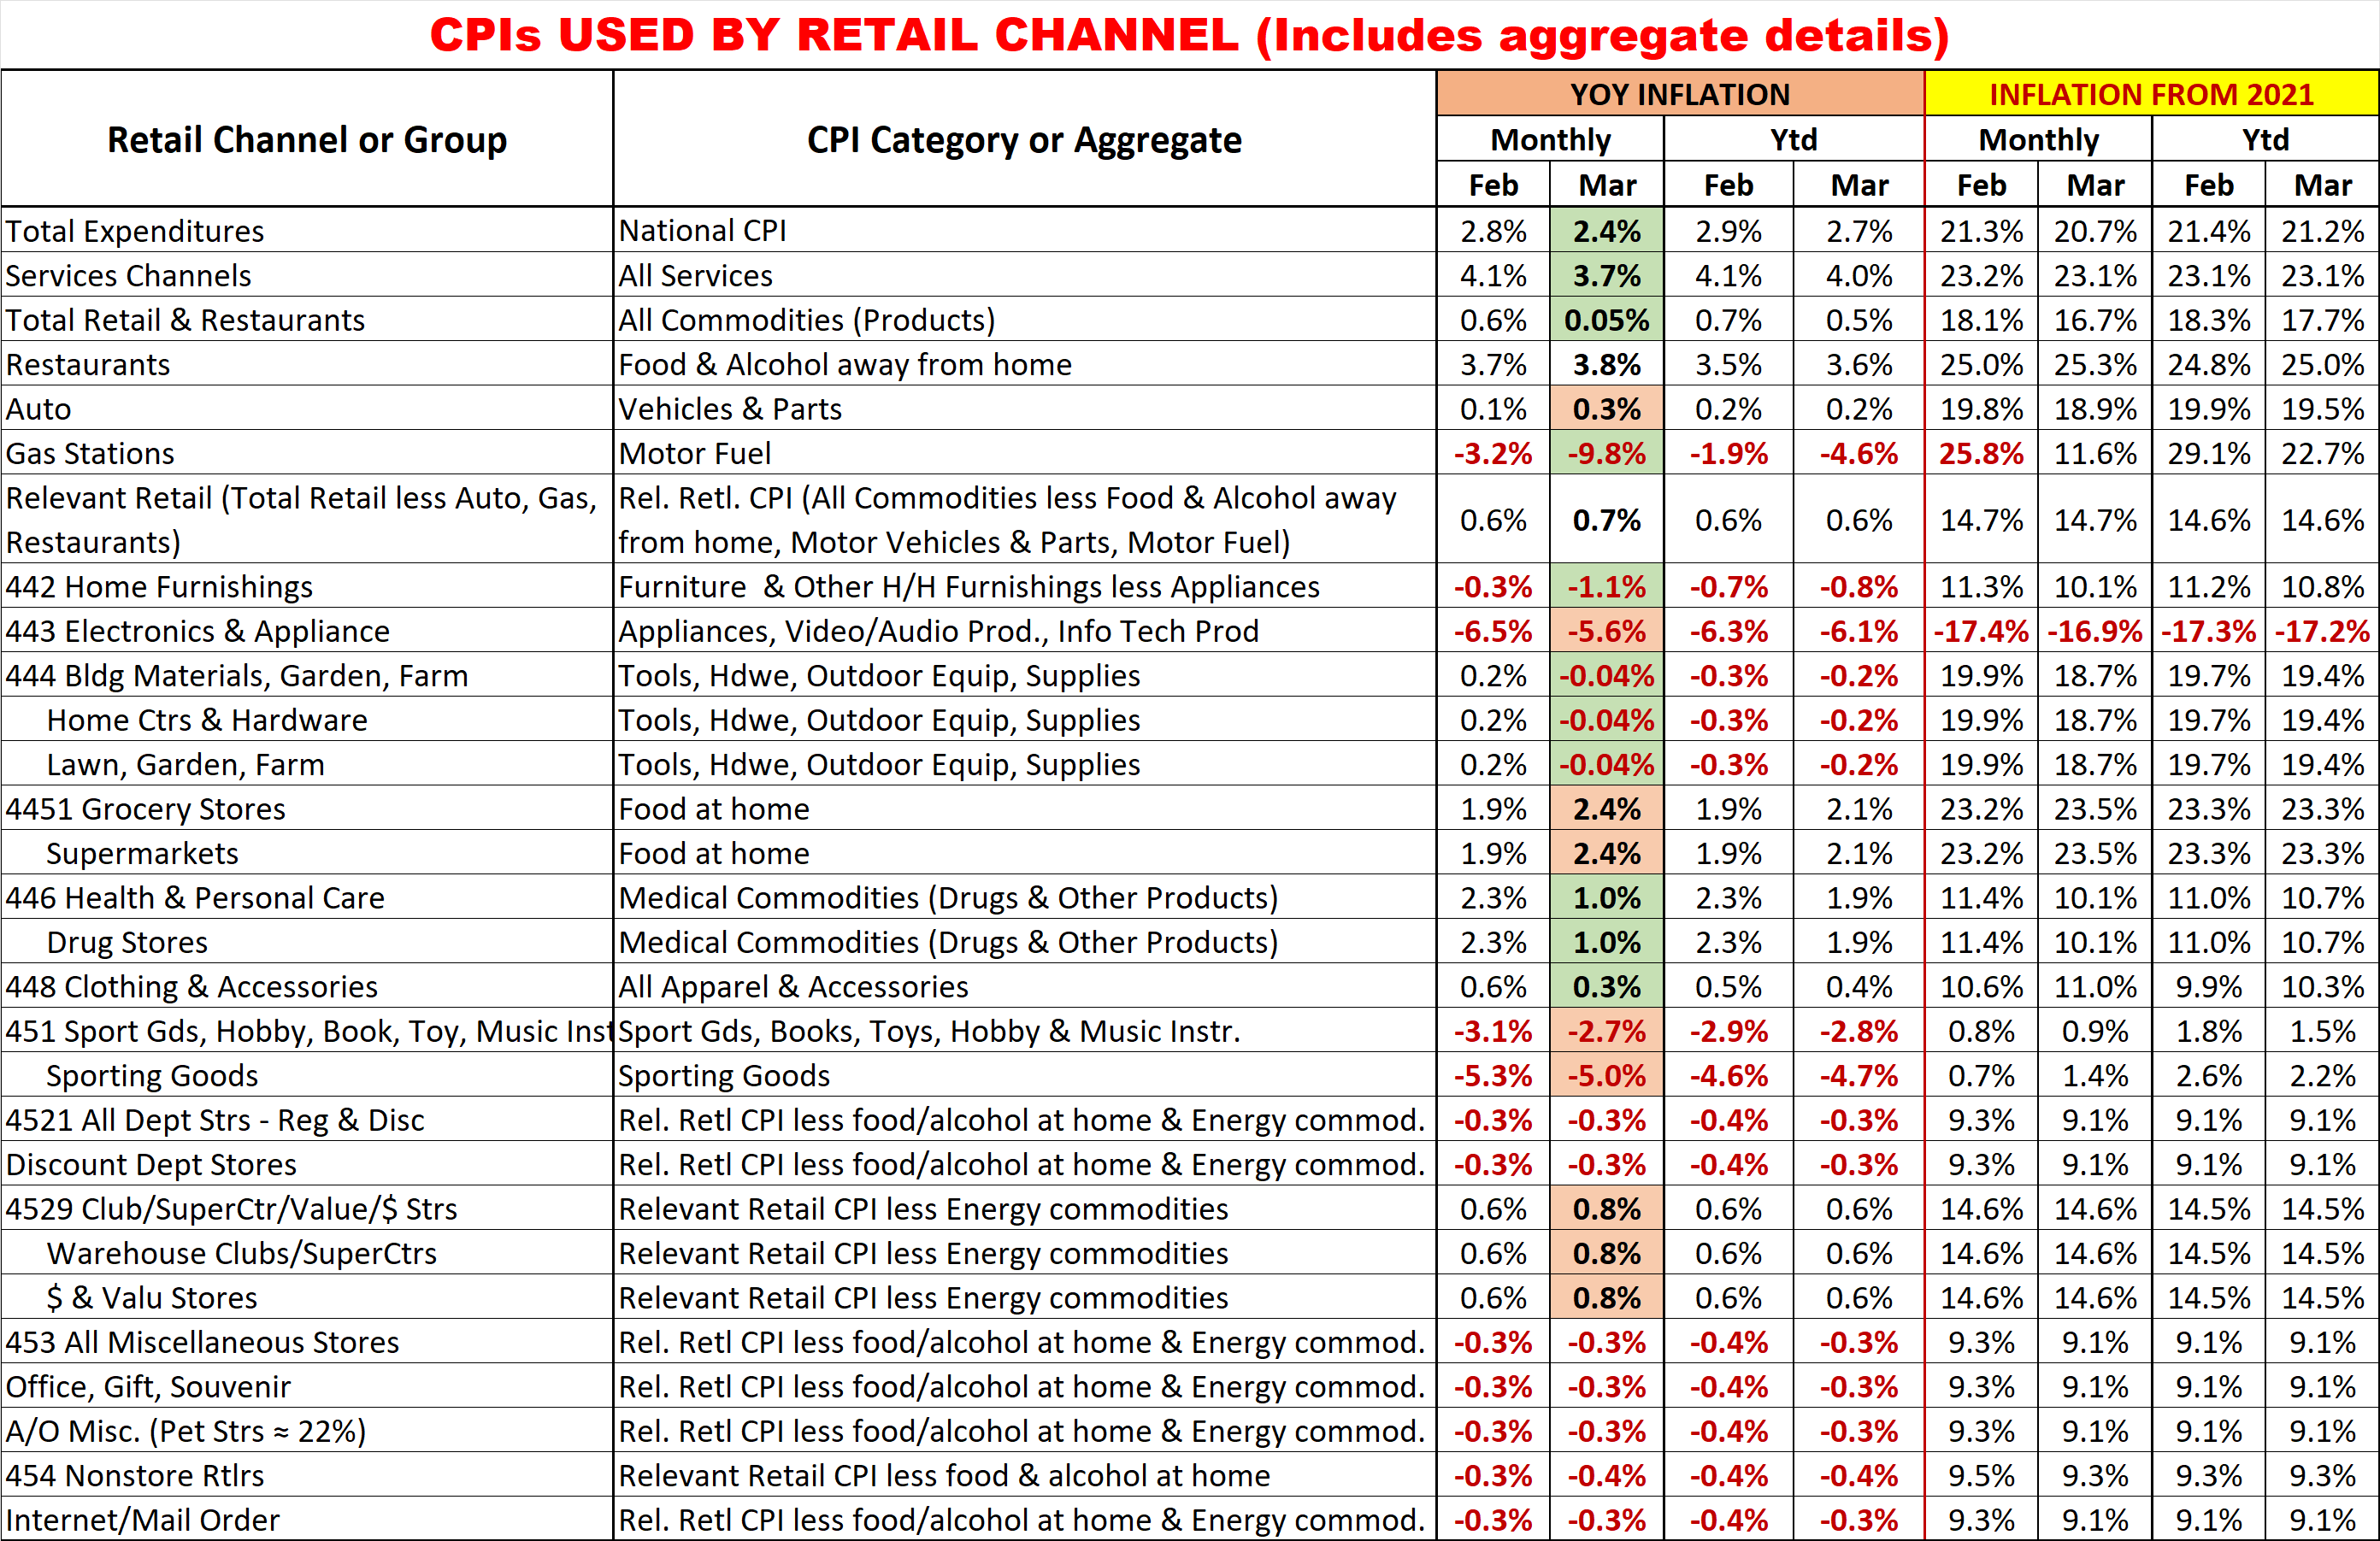
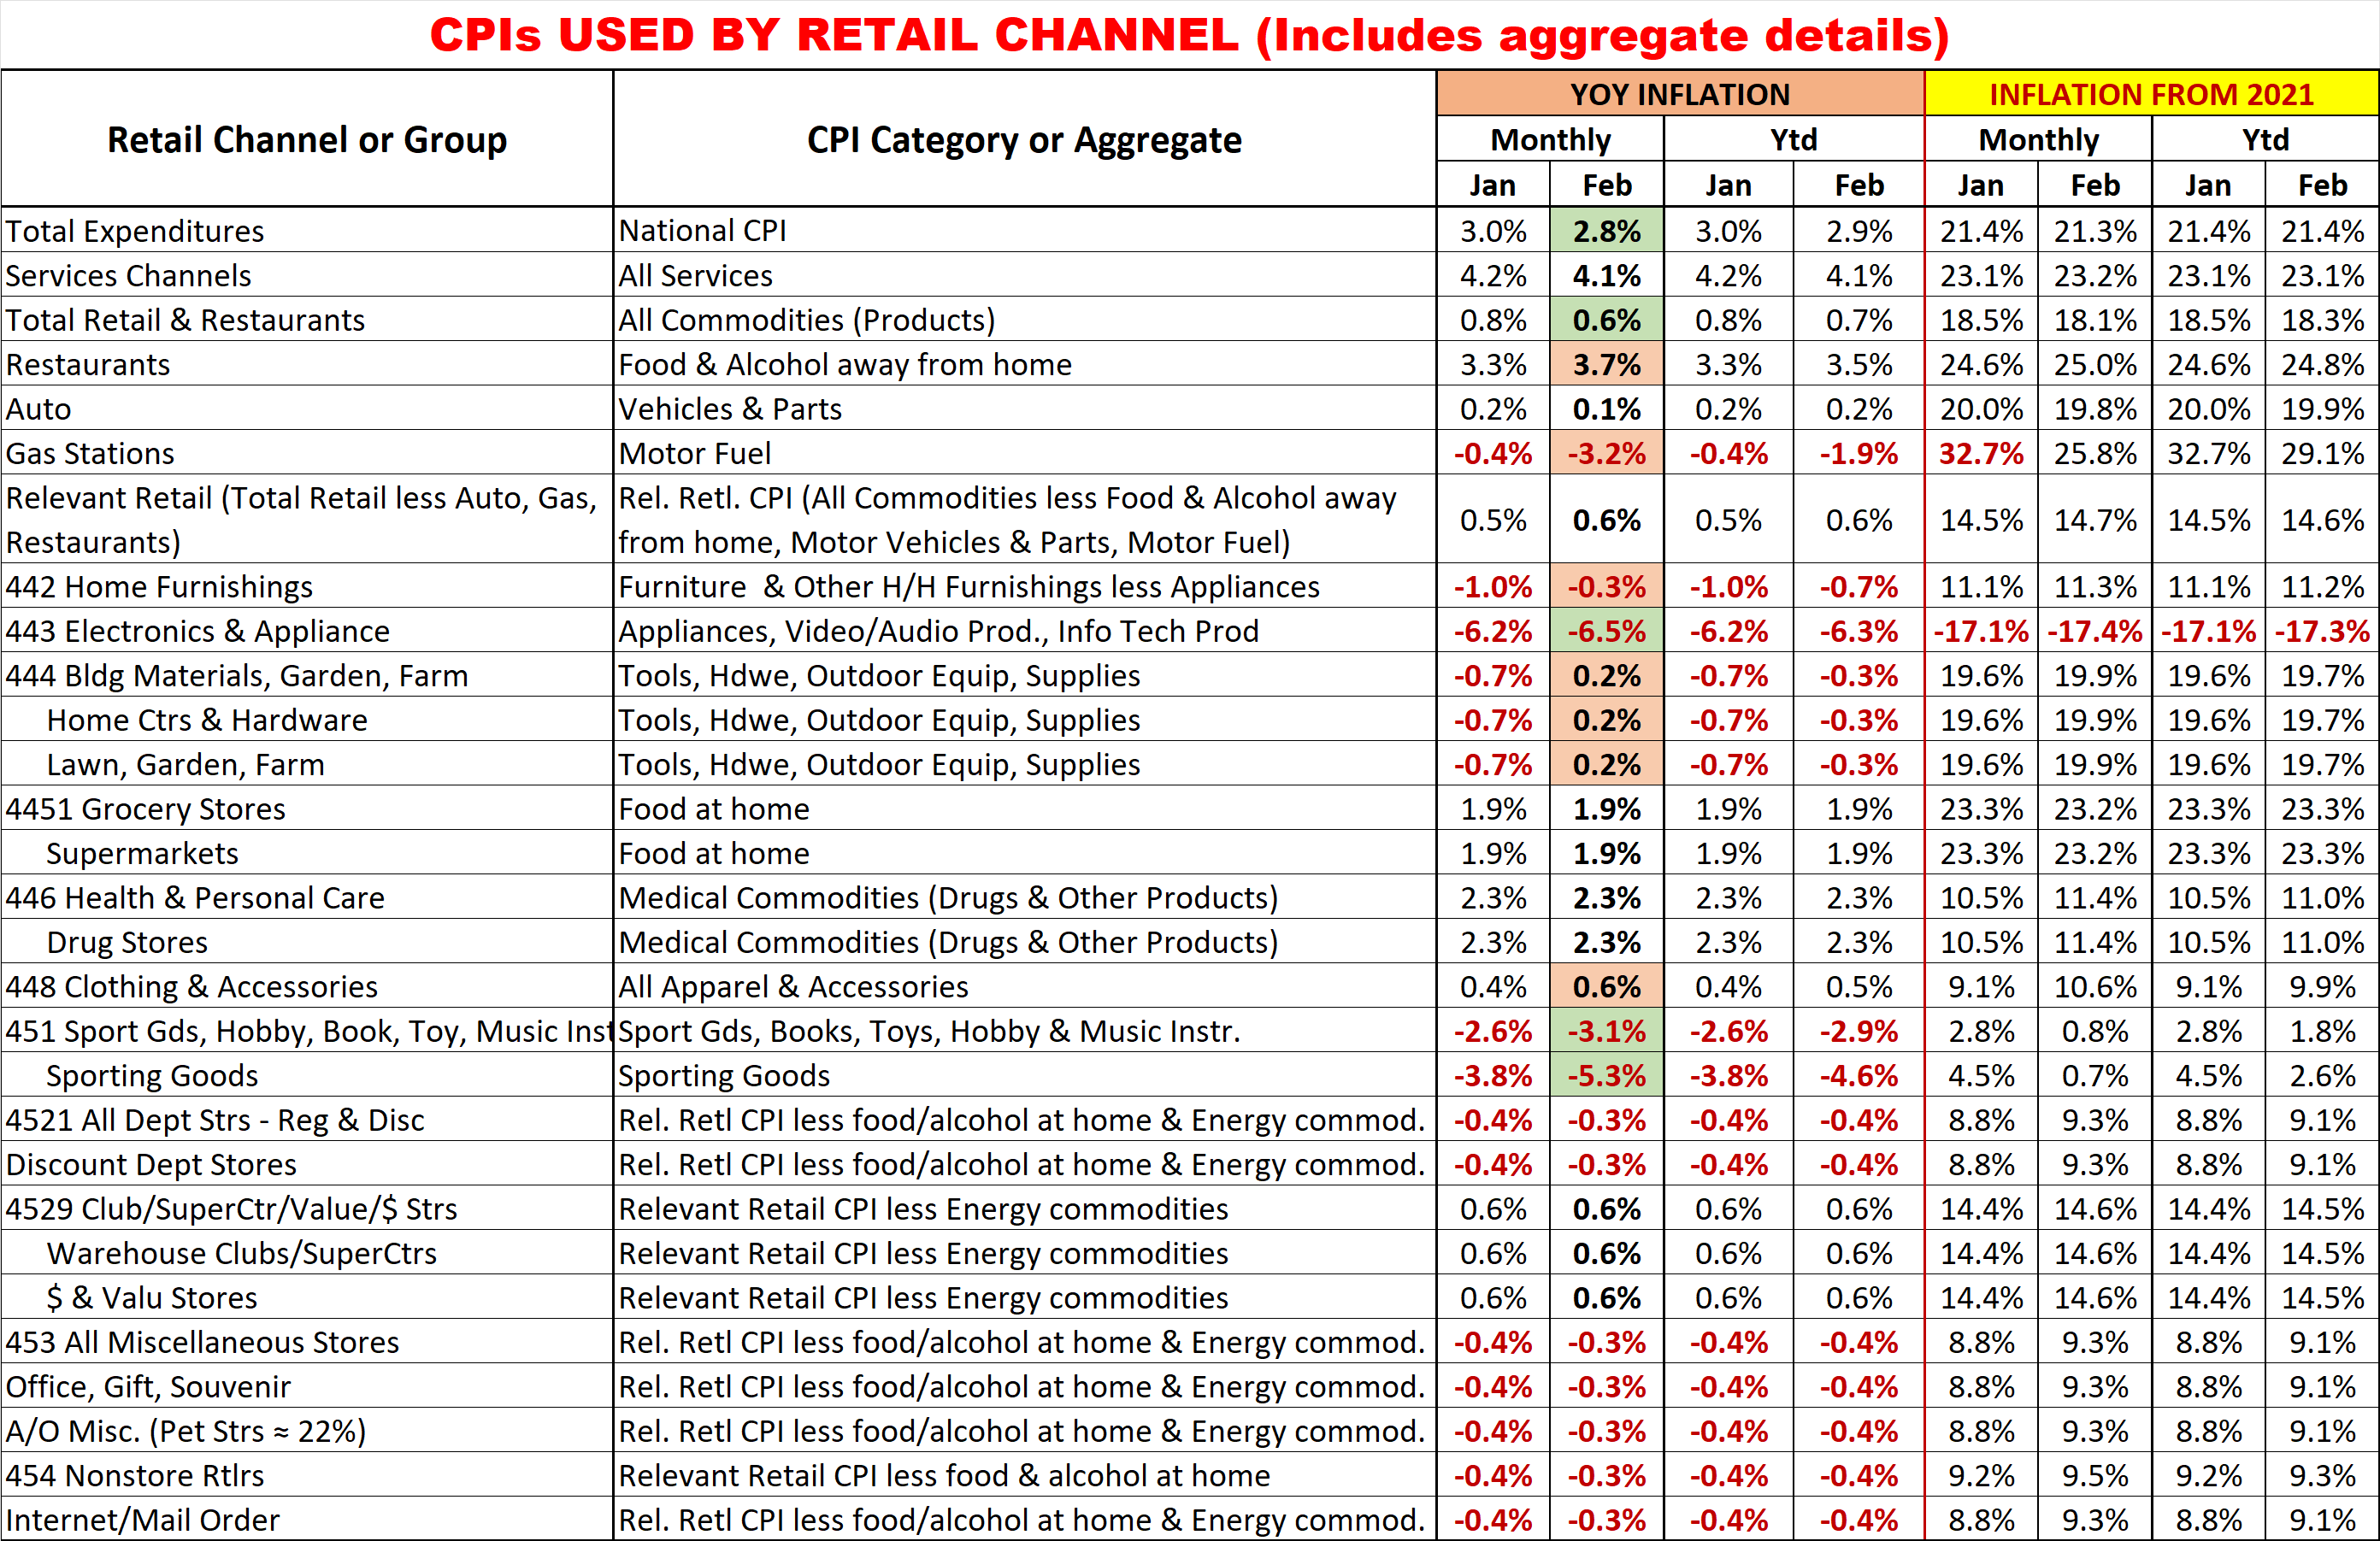
Finally, for your reference, here are the June and July inflation rates for the CPIs of the retail groups and channels in this report. This includes special aggregate CPIs created with the instruction and guidance of personnel from the US BLS. I also researched data from the last Economic Census to review the share of sales by product category for the various channels to help in selecting what expenditures to include in specific aggregates. Of course, none of these specially created aggregates are 100% accurate but they are much closer than the overall CPI or available aggregates. The data also includes the CPI changes vs 2021 to show cumulative inflation. The chart shows both monthly and Ytd inflation so it can be used as a reference for both measurements in the sales growth report.
Monthly YOY CPI changes of 0.2% or more are highlighted. (Green = lower; Pink = higher)

- In the Big Groups, Relevant Retail inflation was unchanged. Gas prices went down. All others got worse.
- The monthly inflation also worsened for 8 of 11 smaller channels
- The biggest change was again Furnishings. They jumped from 3.4% to 5.2%.
- There were no flips from deflation to inflation or vice versa.
- For 2 channels, the worsening was just a slower deflation rate
- The 3 smaller channels with improved inflation were:
- Health/Drug (+0.2% to +0.1%)
- Grocery (+2.4% to +2.2%)
- Electronics/Appliances (-2.8% to -3.6%)
- Cumulative inflation vs 2021 is still high & stable for most channels, especially Ytd