2022 Veterinary Spending was $29.71B – Where did it come from…?
Now we will turn to the final Industry Segment, Veterinary Services. For years, Veterinary Services have had high inflation. This has resulted in CU income becoming the dominant factor in spending and a reduction in visit frequency.
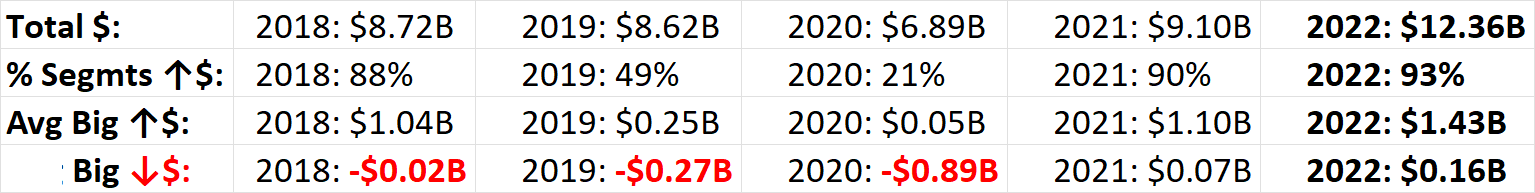
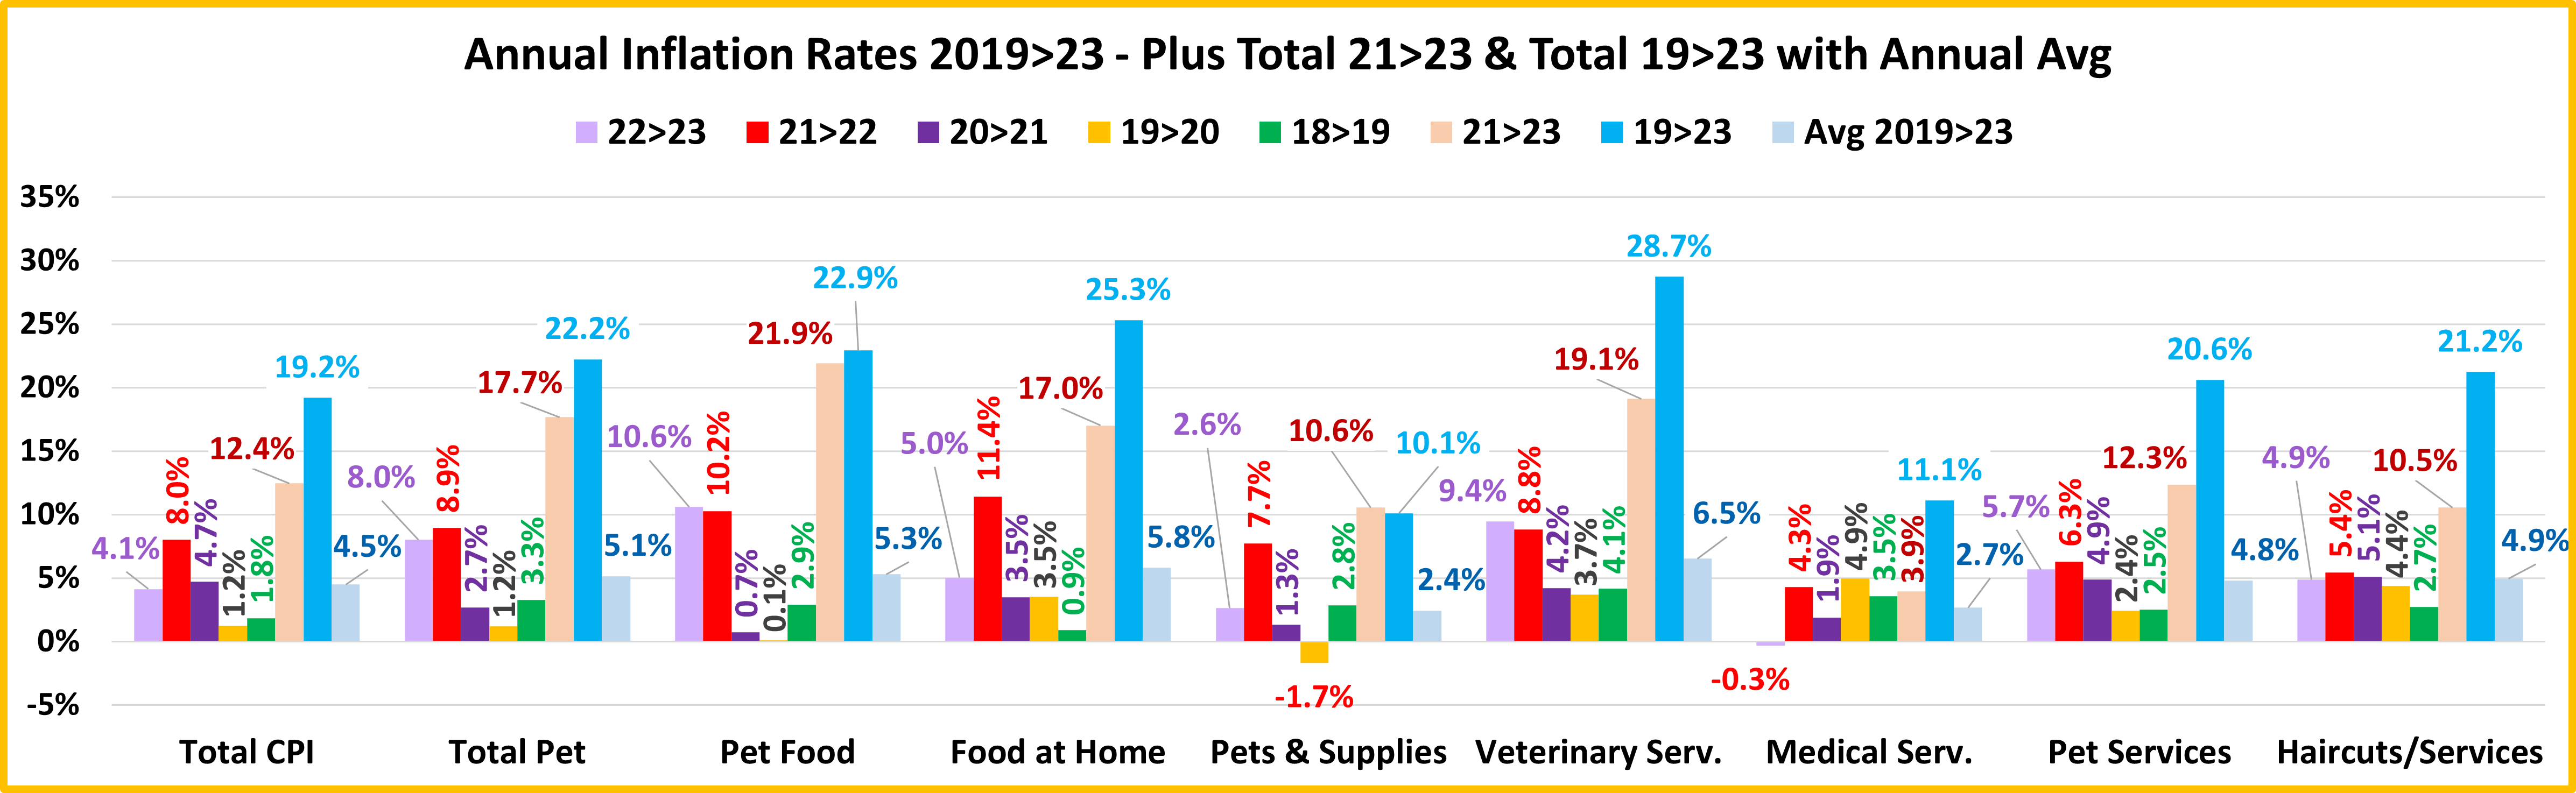
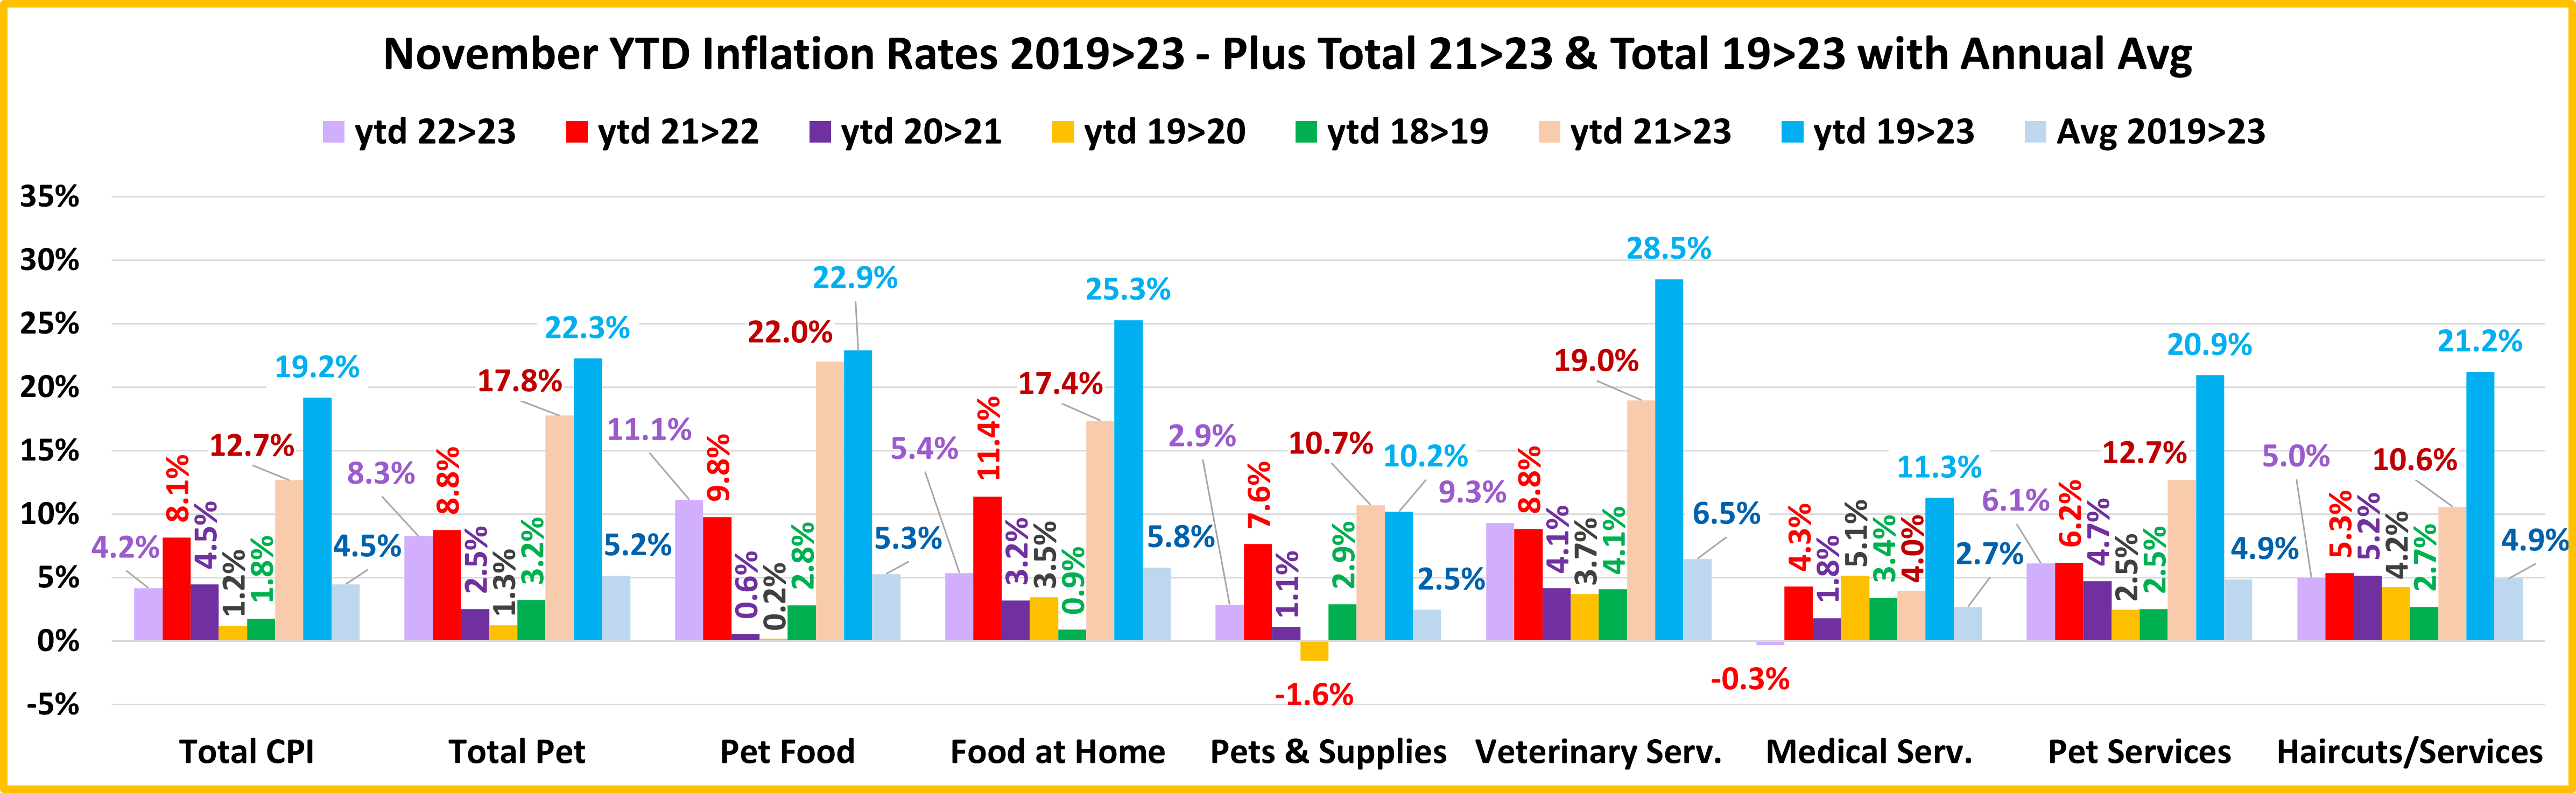
In 2017 low inflation spurred an unusual 7.2% increase in visit frequency and a $2.5B increase in spending. In 2018 inflation returned to more normal levels. Consumers spent $0.56B more (+2.7%), but inflation was 2.6% so virtually all of the lift was from increased prices. In 2019 the situation got worse. Consumers spent $0.58B (+2.7%) more but inflation was 4.14%. This means that there was an actual decrease in the amount of Veterinary Services purchased. In 2020 the pandemic hit, and Pet Parents focused on needs – Food & Veterinary. Veterinary spending grew $3.05B, (+14.0%). In 2021, this behavior grew even stronger and produced a record $7.82B (+31.5%) increase. In 2022 inflation reached 8.8%. Spending fell -$2.95B (-9.0%) but the amount of Veterinary Services sold fell 16.4%. Pricing matters to almost everyone.
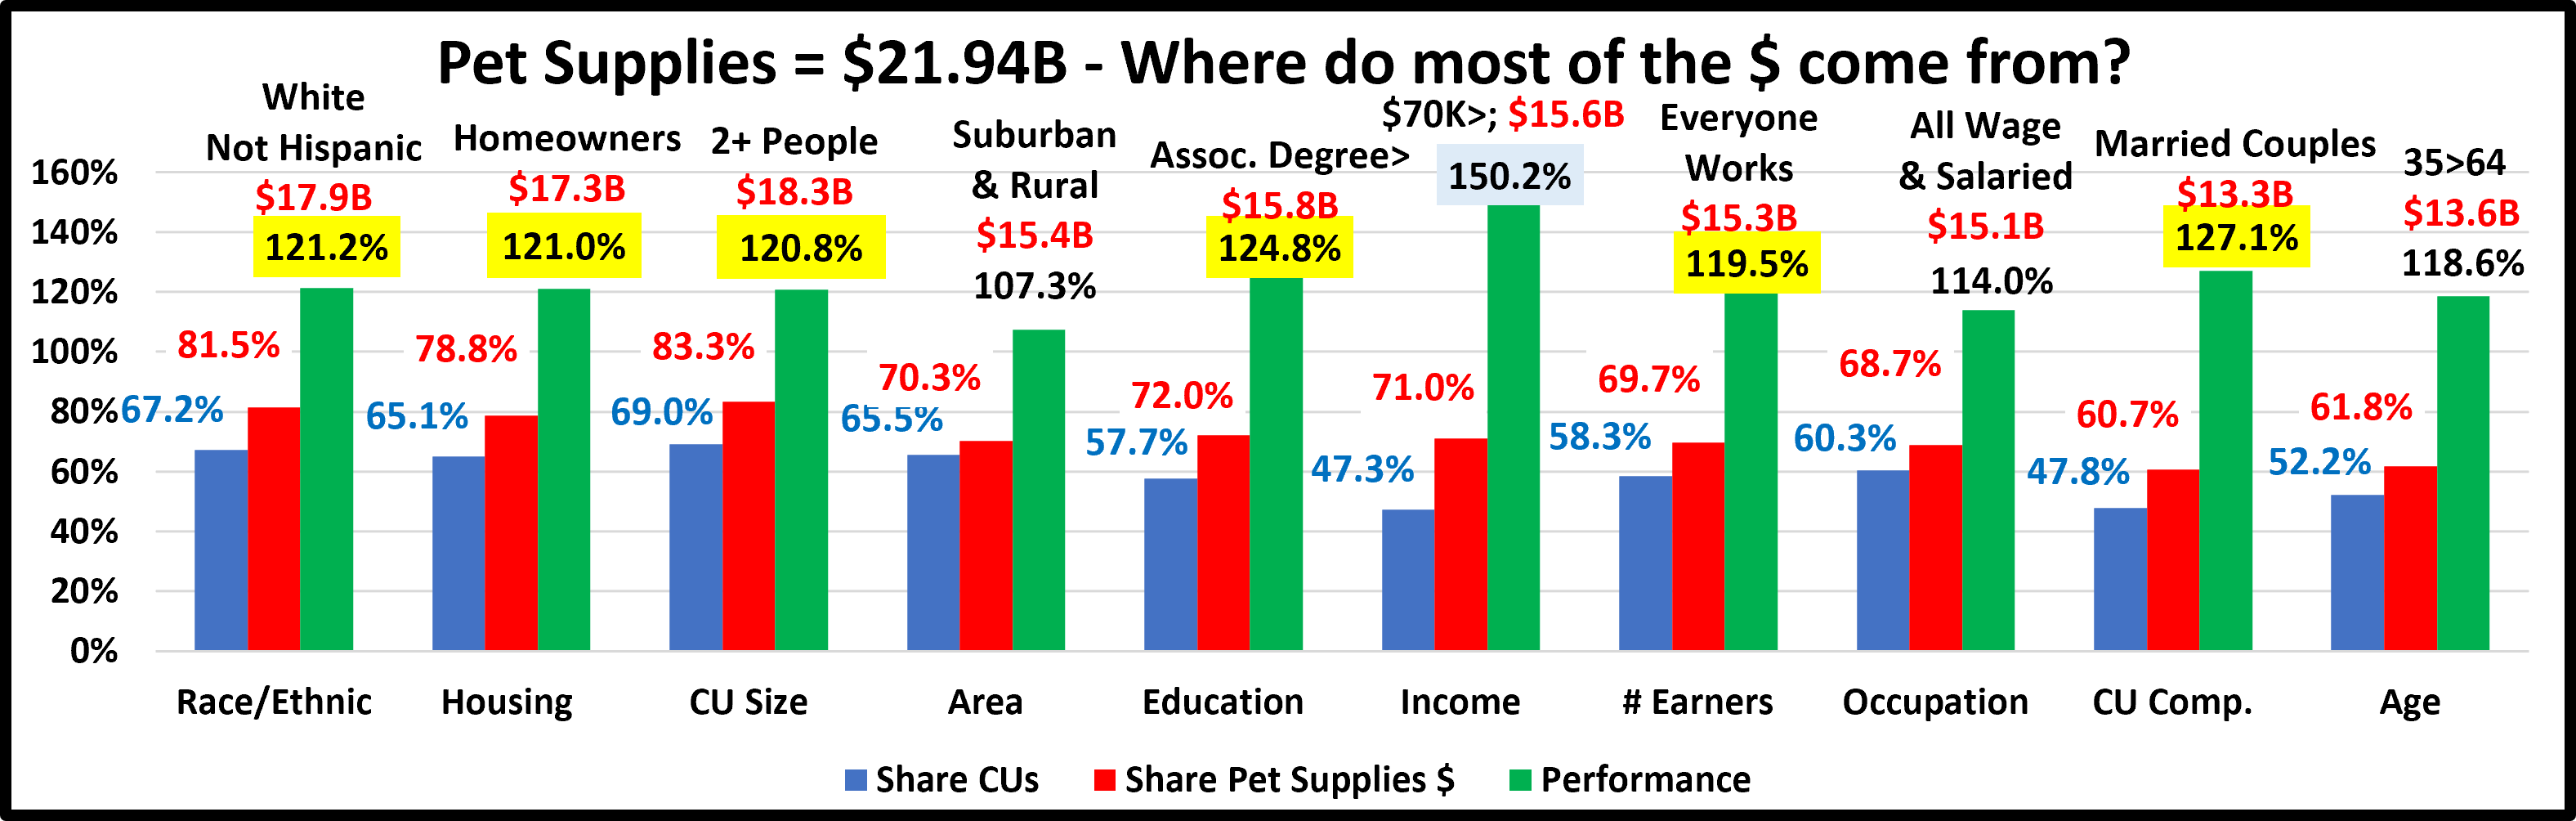
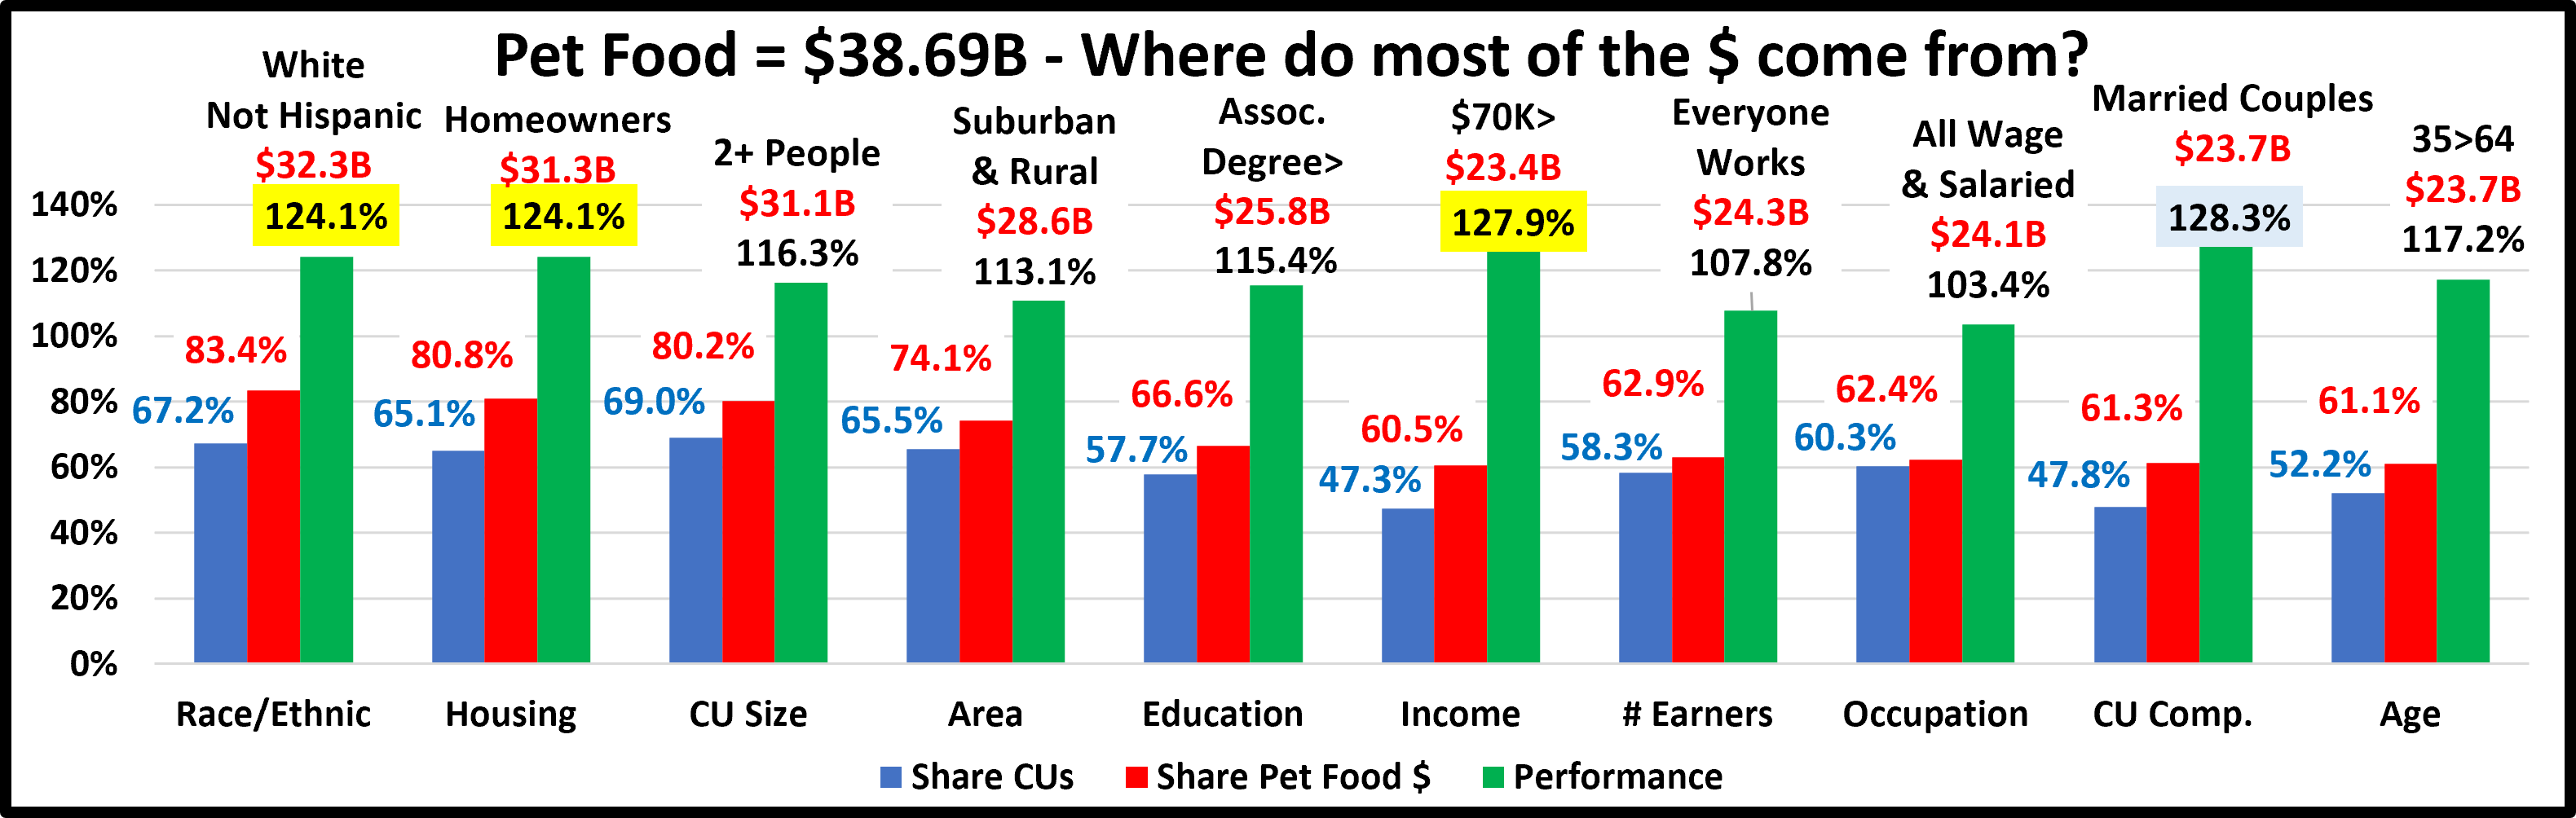
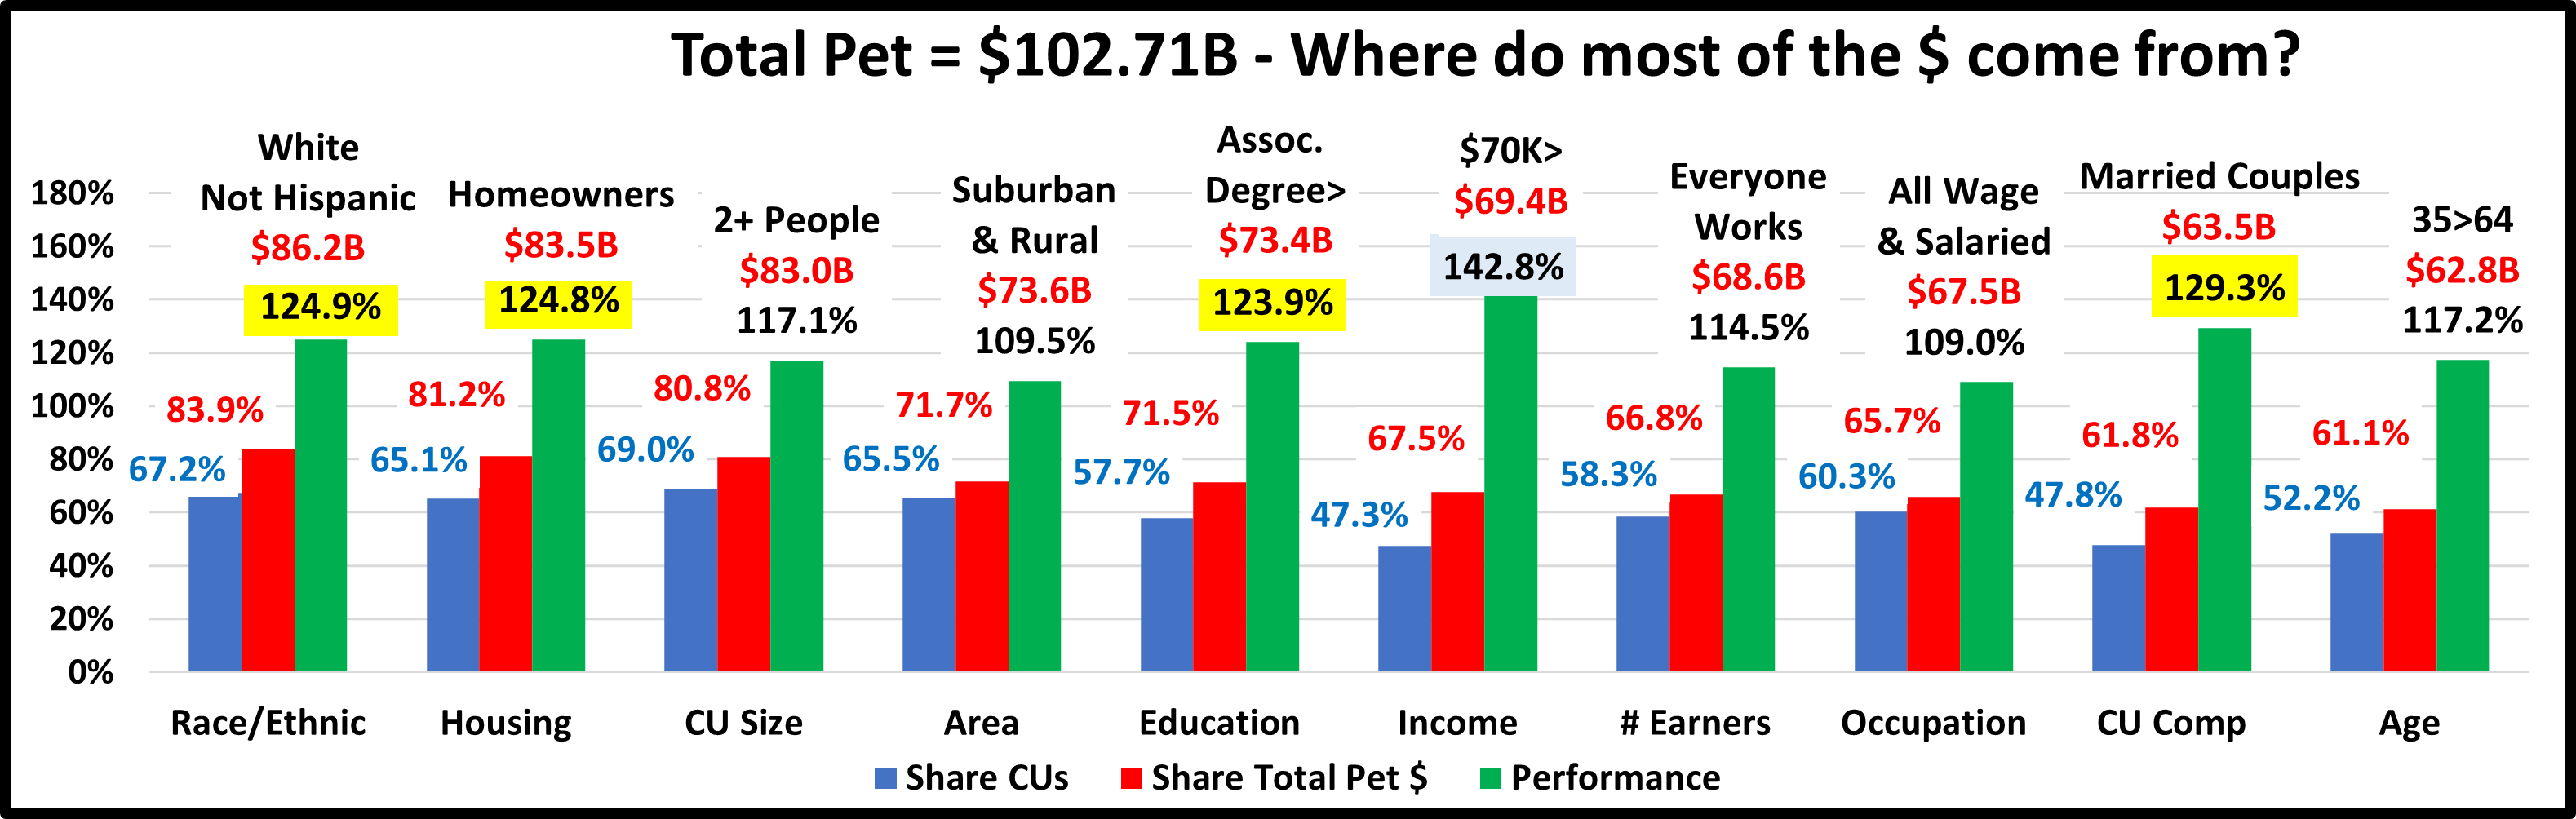
We’ll start our analysis with the groups who were responsible for the bulk of Veterinary spending in 2022 and the $2.95B decrease. The first chart details the biggest Veterinary spenders for each of 10 demographic categories. It shows their share of CU’s, share of Veterinary spending and their spending performance (Share of spending/share of CU’s). In terms of performance – 5 of 10 groups perform above 120%, 1 less than 2018>2021. This is currently 2 less than Supplies (7) and 1 less than Services (6) but 1 more than Food (4). This means that these big spenders are performing well but it also signals that there is still disparity between the best and worst performing demographics in this “needed” segment. Only the College Grads group is different from Total Pet and the categories are listed in the order that reflects their share of Total Pet $pending. Again, High Income is the most important factor in Spending.
- Race/Ethnic – White, not Hispanic (86.0%) up from 84.7%. This group accounts for the vast majority of spending in every segment and gained share in Vet $ in 2022. Their 128.0% performance is also up from 126.0% but they fell from #4 to #5 in importance in Veterinary Spending. Whites spent $2.2B less but African Americans (+$0.18B) and Asians (+$0.09B) spent more. Whites gained in share & performance because of a -$1.1B decrease by Hispanics.
- Housing – Homeowners (83.9%) up from 81.0% Homeownership is a major factor in pet ownership and spending in all industry segments. In terms of importance to Veterinary spending, their 128.9% performance rating is up from 125.2%, and they moved up to 4th from 5th place. All segments decreased spending but the biggest drop was by Renters, -$1.40B (-22.6%). This is produced the gains for Homeowners. However, we should note that Homeownership is still not nearly as important to Veterinary Spending as it once was. In 2015 their share was 88.4% with performance of 141.8%.
- # in CU – 2+ people (79.8%) up from 79.7% This group, which is 69.0% of U.S. CUs, gained minimally in share and their performance grew from 114.7% to 115.7%. Their rank in terms of importance in Vet Spending stayed at #8. All sizes spent less. The gains happened because Singles had a slightly bigger % decrease (-9.7%) than 2+ CUs (-8.9%).
- Area – Suburban & Rural (70.9%) down from 73.0% Suburban CU’s are the biggest spenders in every segment. All areas spent less. The Big Suburbs had the biggest decrease, -$1.93B (-12.1%) while Center City was only down -2.3%. This drove the big decrease in share and caused their performance to fall substantially to 108.2%, from 113.2%.
- Education – College Grads (60.9%) down from 65.4%. Income generally increases with education. It is also important in understanding the need for regular Veterinary care. Their performance also dropped from 138.1% to 130.3% and they fell from #2 to #3 in importance. In 2022, College grads spent -$3.27B less while those without at least a BA/BS spent $0.31B more. This lift was small but widespread as only HS Grads with some college spent less.
- Income – Over $70K (69.9%) down from 71.7% Their performance also fell significantly from 160.0% to 147.8% but higher income is still the most mportant factor in Veterinary spending. The only lifts were from $200K>, +$0.39B and $30>49K, +$0.04B. The biggest drops were $150>199K, -$1.51B and $70>99K, -$1.47B.
- # Earners – “Everyone Works” (67.7%) down from 68.6% Their Performance also fell from 121.0% to 116.1%. They dropped out of the 120+% club & fell from #6 to #7 in importance. All adults in the CU work. Only Single, No Earner CUs spent more. 2 Earners had the biggest $ drop, -$0.99B while 1 Earner, Singles had the biggest % drop, -15.8%.
- Occupation – All Wage & Salaried (65.9%) down from 66.4% and their performance decreased from 111.9% to 109.3%. Only Blue Collar Workers and Tech/Sls/Clerical spent more. The group lost share and performance primarily because of big drops by Mgrs/Professionals, -$1.47B and Service Workers, -$1.23B. Their perforrmance drop was also accelerated because they had 1.6 million more CUs than in 2021.
- CU Composition – Married Couples (62.5%) up from 60.9% Their performance also grew to 130.8% from 128.4% and they moved up to #2 from #3 in importance. Only 2 segments spent more – Married Couple with an Oldest Child 6>17, +$0.67B and Single Parents, +$0.25B. The biggest drop was by All Adult, Unmarried CUs, -$1.26B.
- Age – 35>64 (61.1%) down from 62.1% Their performance also fell from 118.7% to 117.1% but they moved up to 6th from 7th place in importance. Only 45>54, +$0.80B and 75>, +$0.18B spent more. The 2 biggest drops were 55>64, -$1.51B and 35>44, -$1.45B. These caused the group’s drops in share and performance.
Spending disparity fell in 6 categories and the average group performance was 123.2%, down from 125.7% in 2021. Spending became slightly more balanced. Notably, higher income & education became a little less important. Also, Married Couples reached #2 in iimportance. In 2020, they were #6.
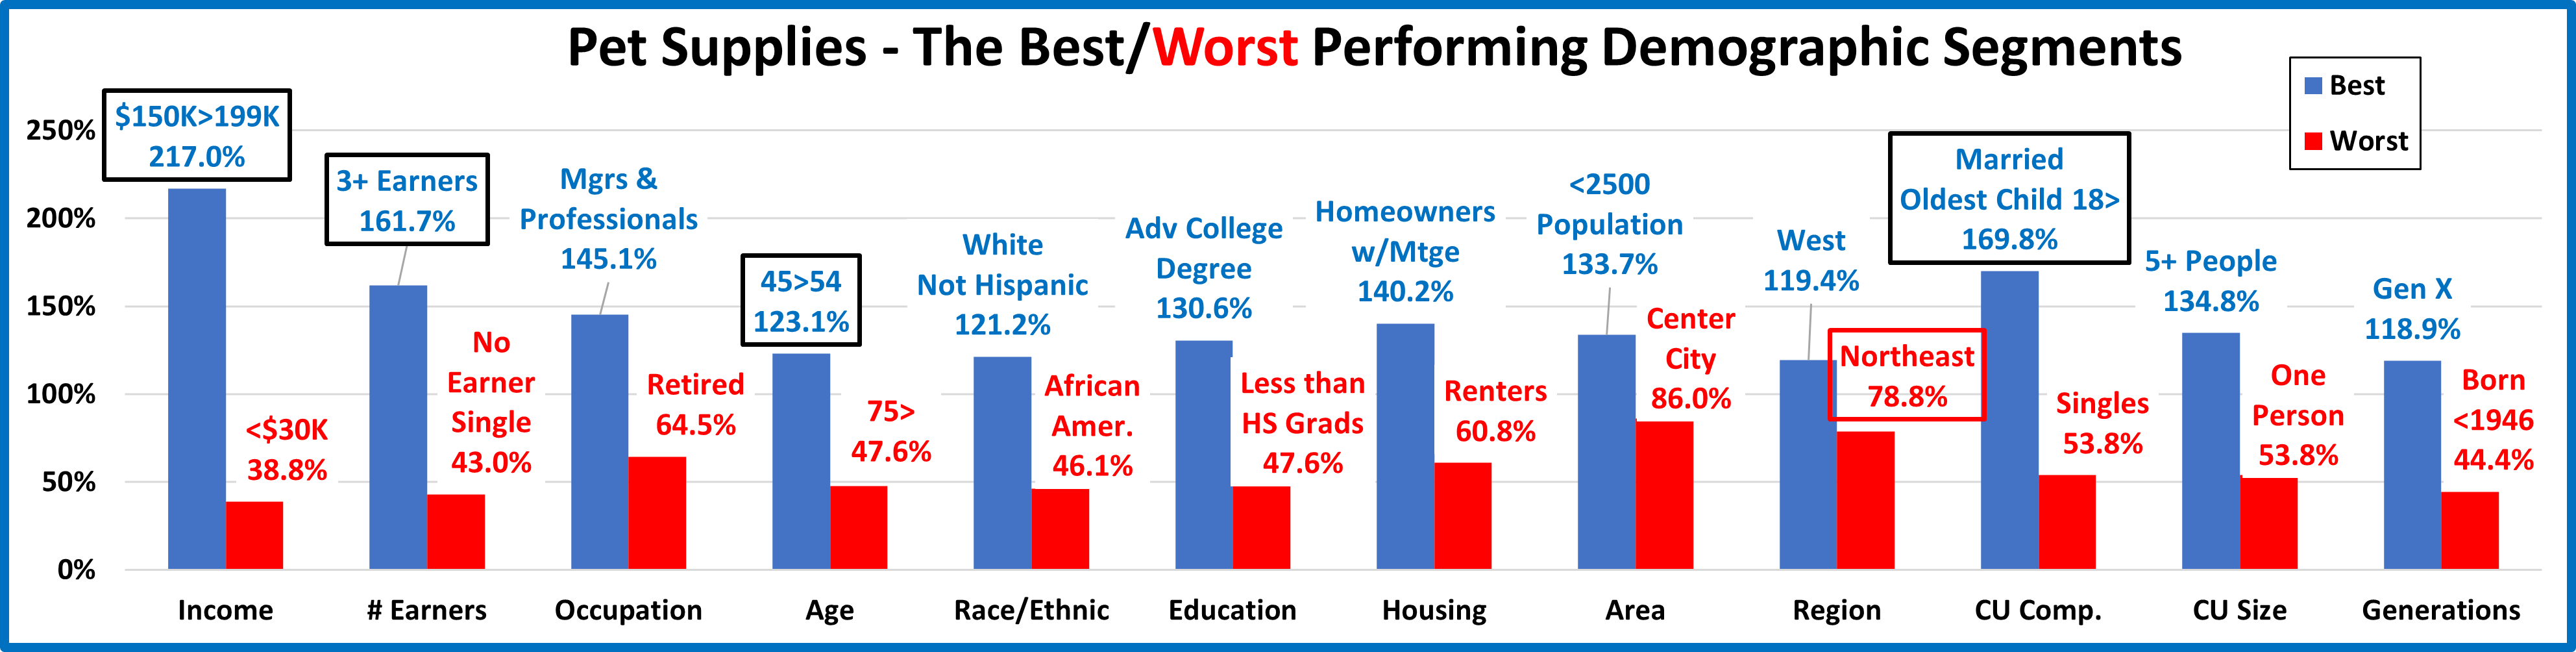
Now, we’ll look at 2022’s best and worst performing Veterinary spending segments in each category.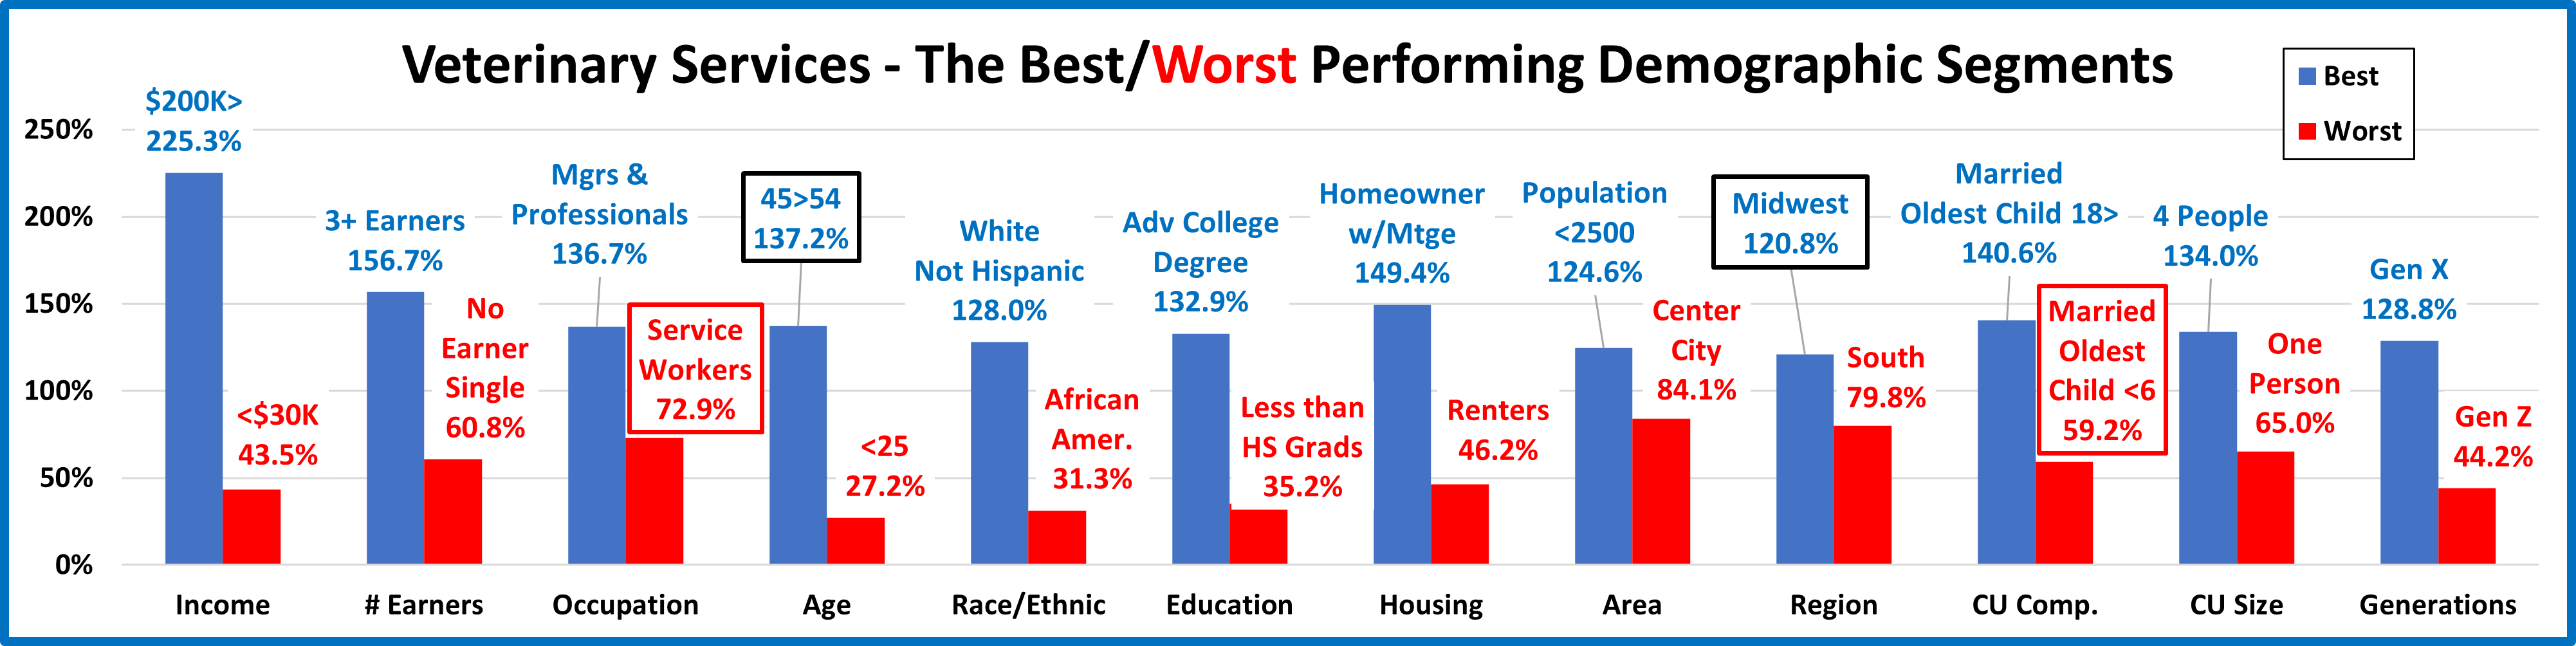
Almost all of the best and worst performers are those that we would expect and there are only 4 that are different from 2021, down from 5 last year. This is 1 more than Services, but 1 less than Supplies and far fewer than the 11 in Food. Also, the average difference between Best & Worst was 88.8%, down from 94.4% in 2021.There was slightly less turmoil and spending disparity between segments in 2022. The changes from 2021 are “boxed”. We should note:
- Income– The Winner & Loser are the same. The gap is 181.8% but 5.3% less than 2021.
- Earners – This repeat winner and loser have the highest and lowest incomes. The gap narrowed by 23.2%.
- Occupation – Service workers replaced Retirees at the bottom, but the gap was 3.5% smaller.
- Age – The 45>54 yr-olds, the highest income group, replaced 55>64 at the top. The gap actually widened by 9.3%.
- Race/Ethnic; Another set of expected repeats. The gap between winner and loser narrowed by 5.9%
- Education; Housing; Area – These all had an expected repeat winner & loser, but the performance gap grew for all. Education: +1.8%; Housing: +14.3%; Area: +16.2%.
- Region –Midwest replaced Northeast at the top. The South has now finished last for 7 years in a row, but the win/lose gap decreased by 15.2%. Also, for the second consecutive year, 2 regions performed at 100+%.
- CU Composition – Married, Oldest child <6 replaced Single Parents at the bottom. The gap narrowed 33.6%.
- # in CU – The same winner & loser but the gap widened by 10.7%. Only 2,3 & 4 people CUs perform above 100%.
- Generation – No change again and the performance gap widened, but only by 1.6%.
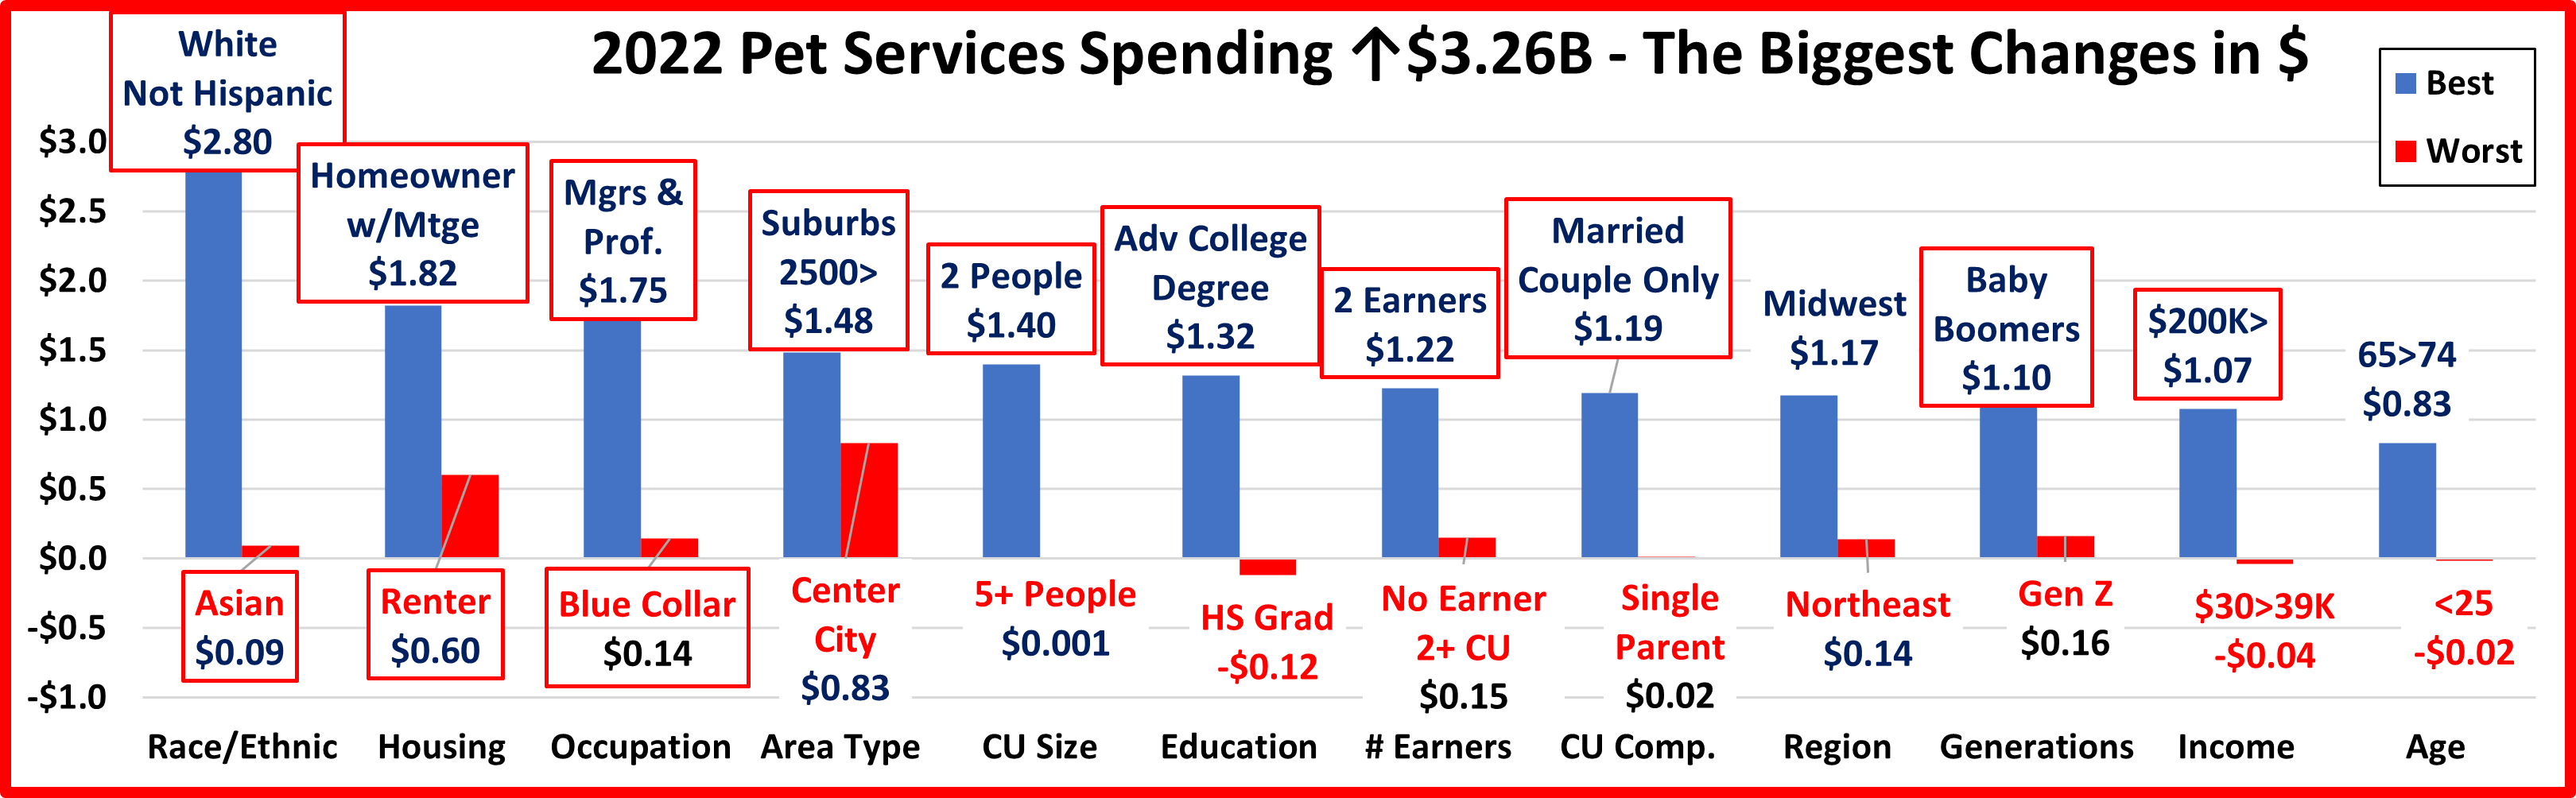
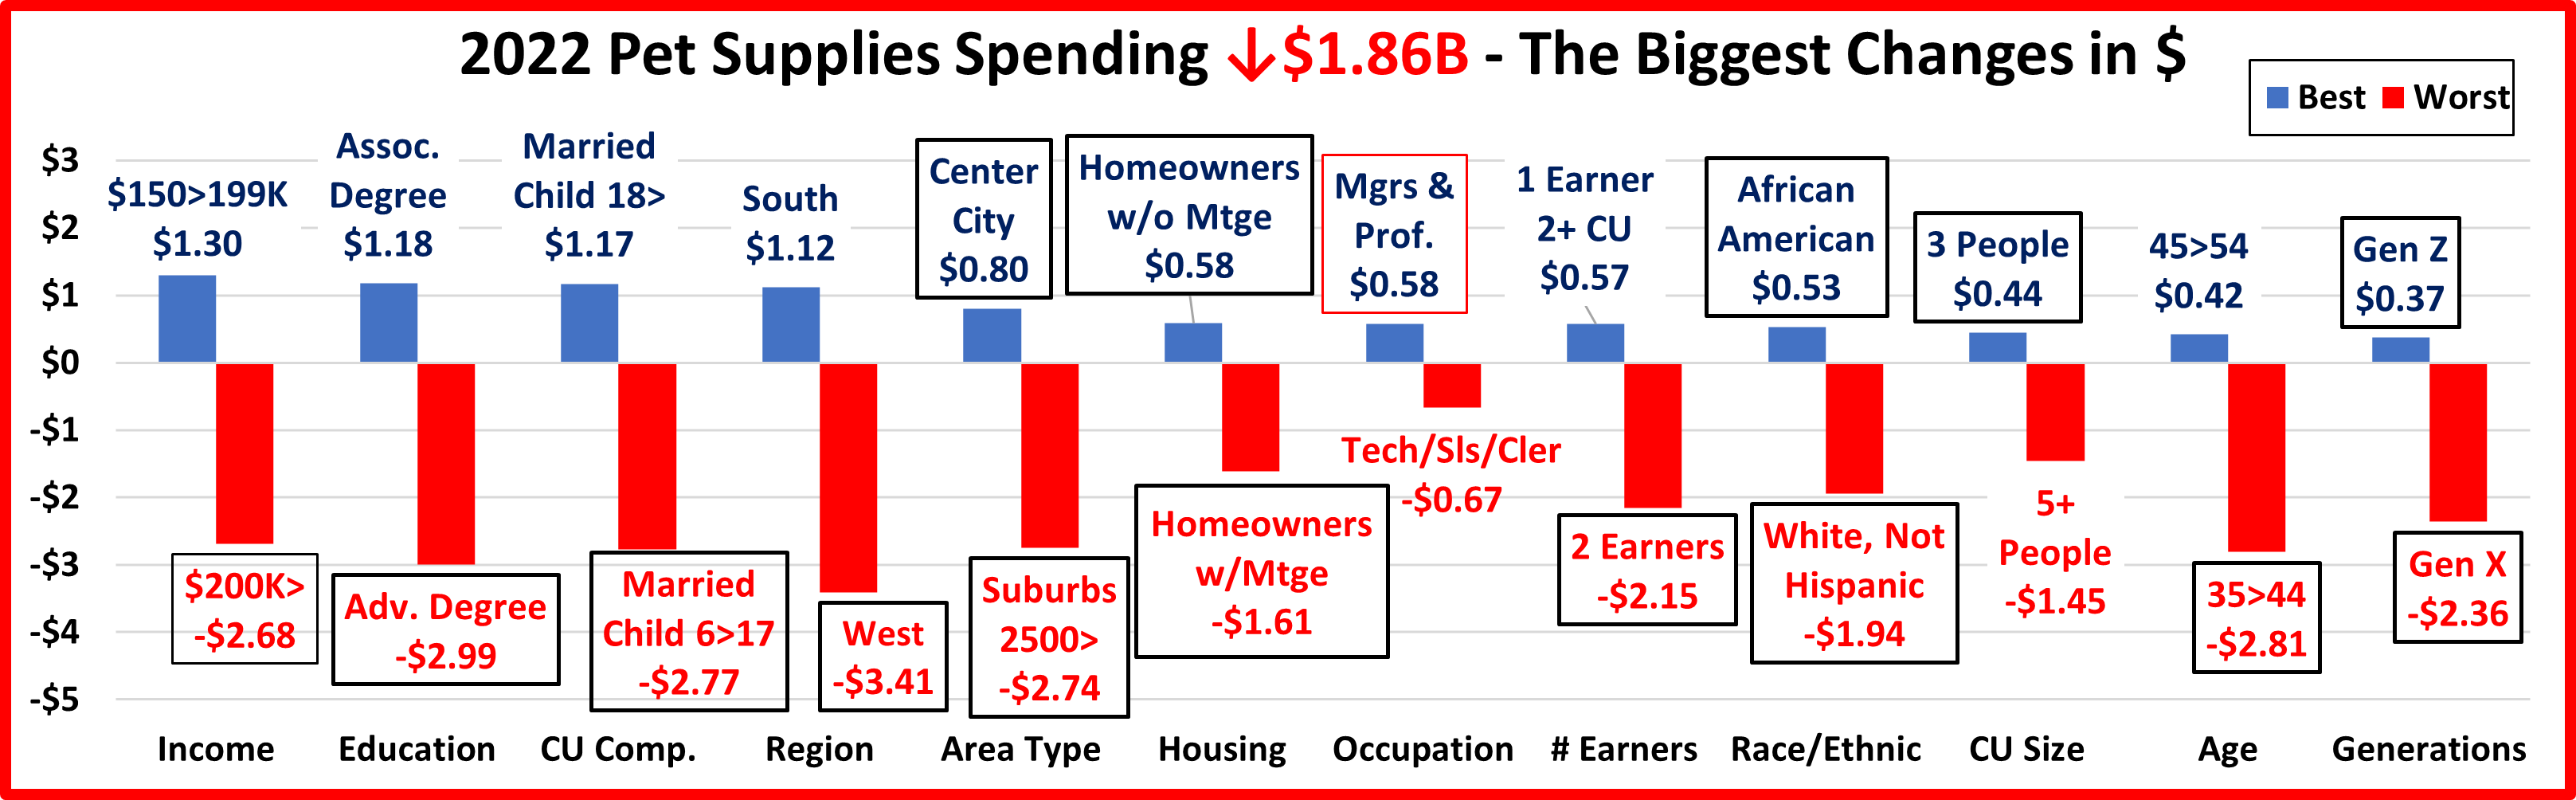
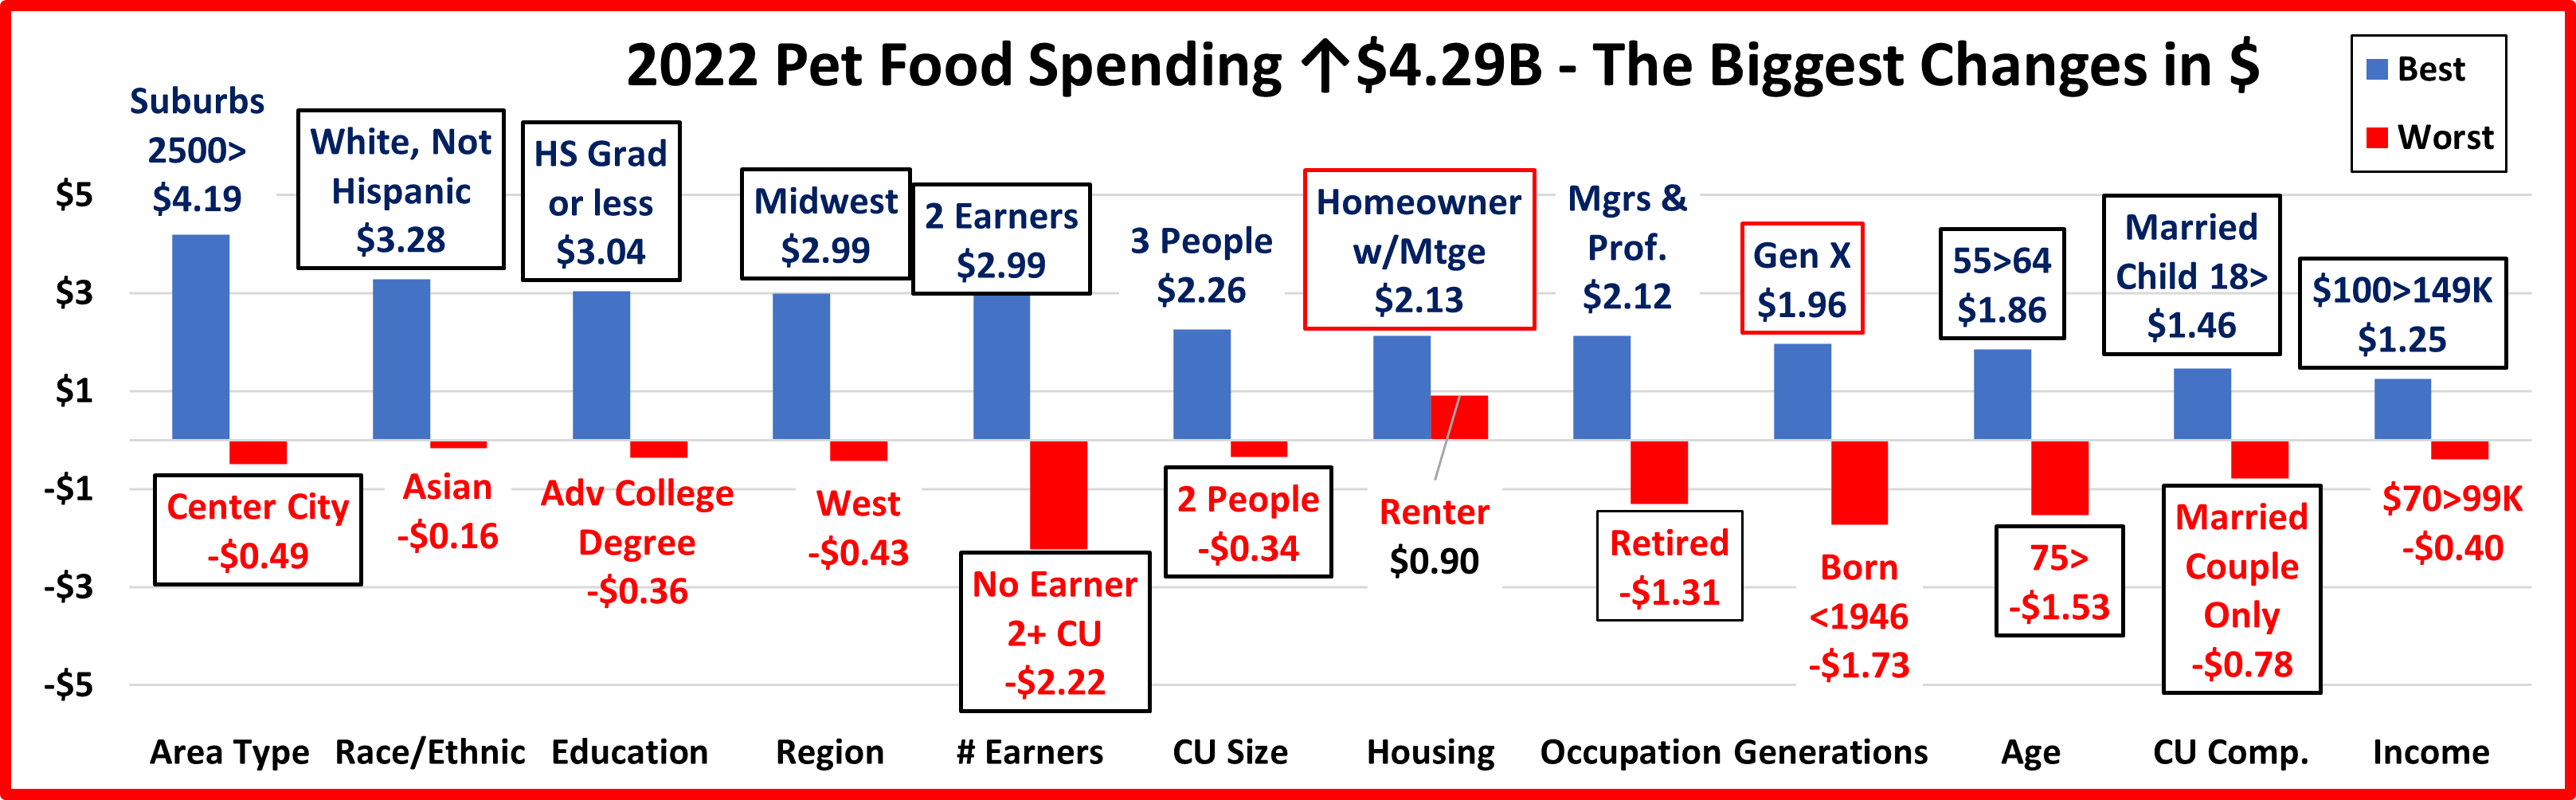
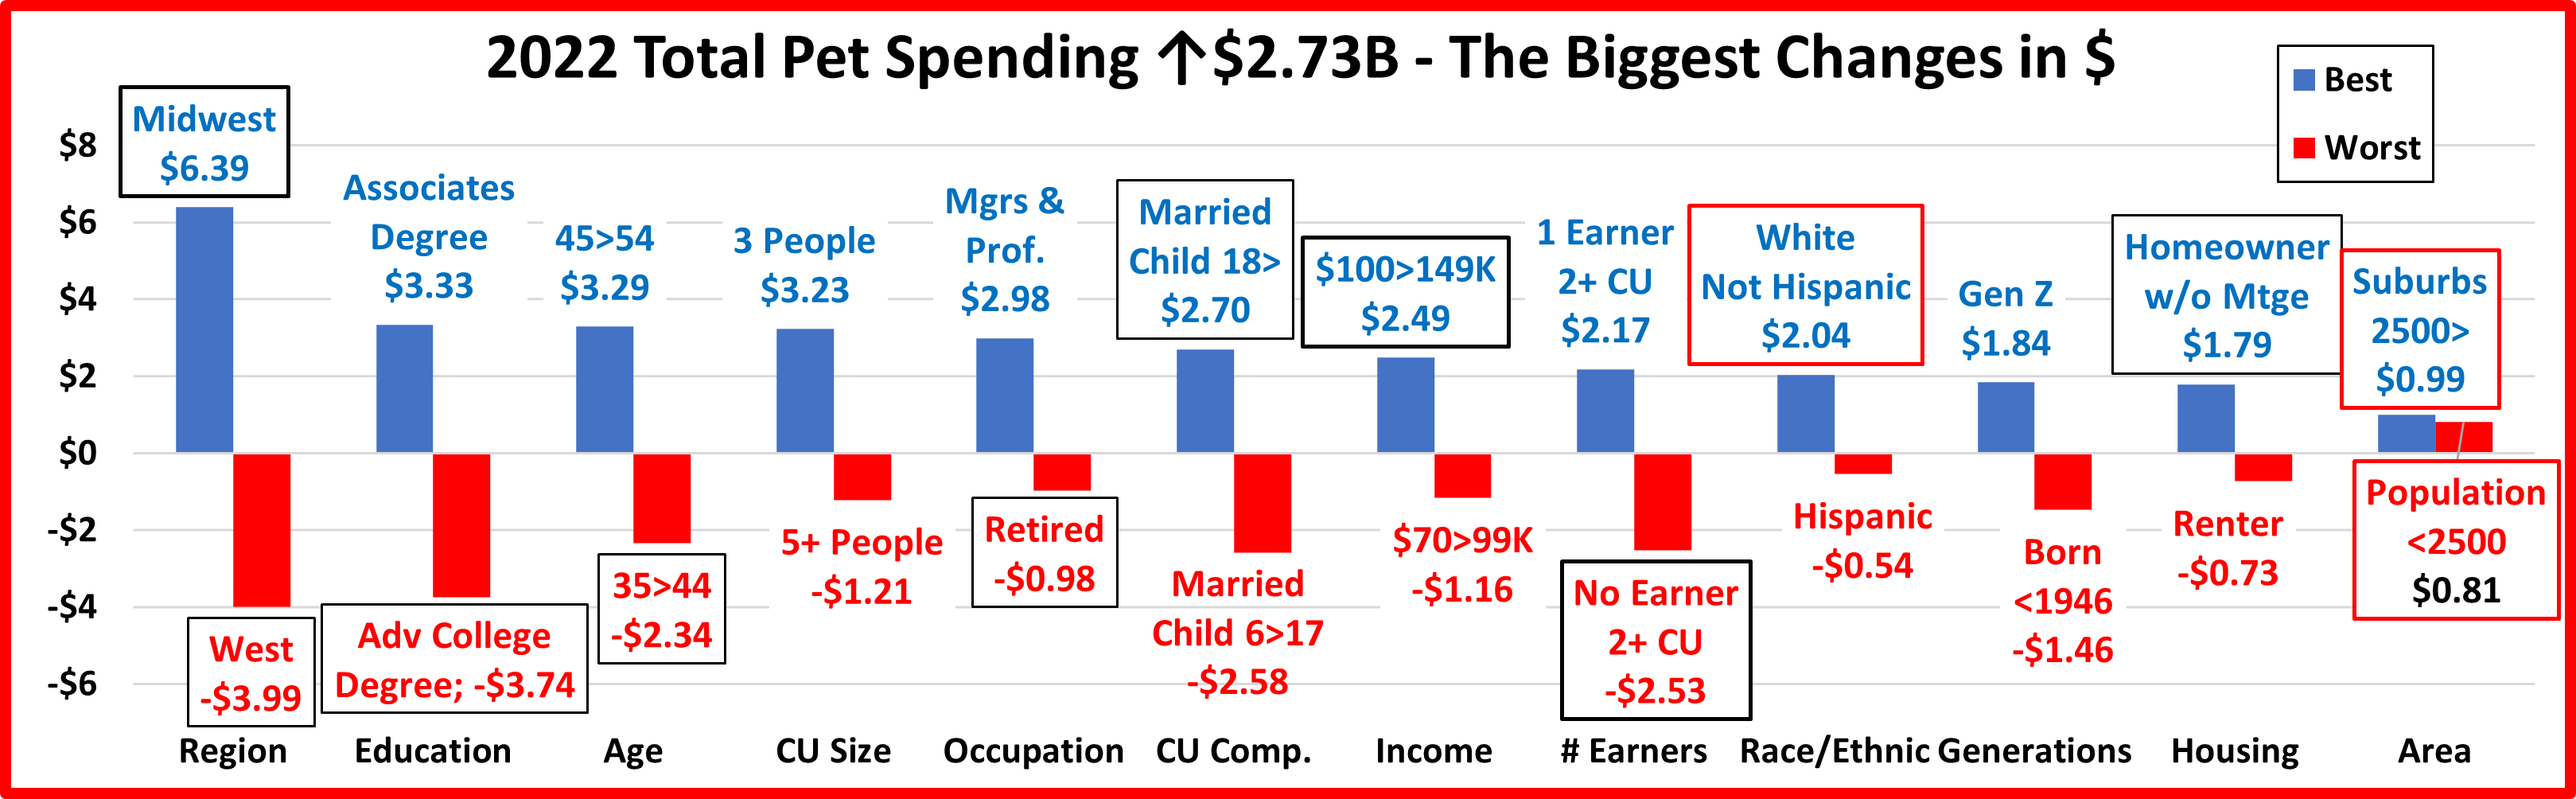
It’s time to “Show you the money”. Here are segments with the biggest $ changes in Veterinary Spending.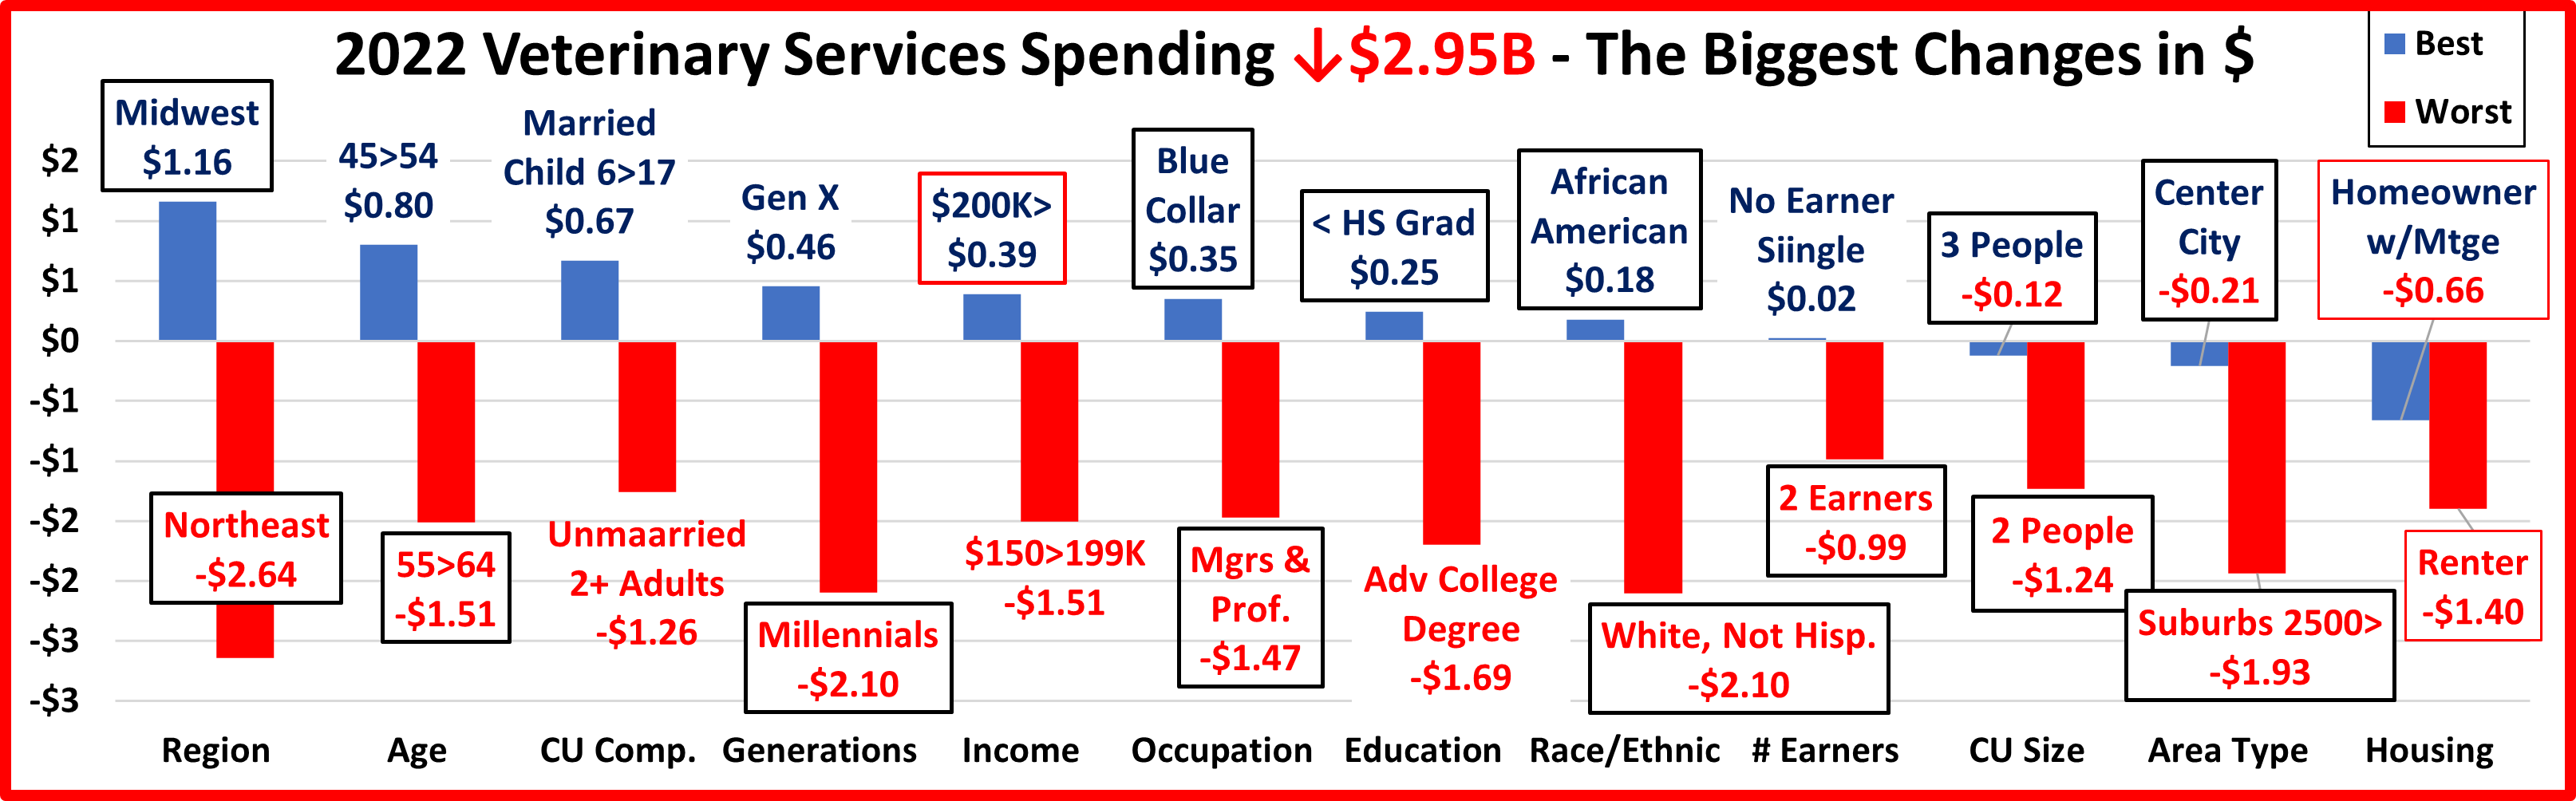
We saw little turmoil in performance. That’s not true here. There were 3 repeats and 14 segments flipped from 1st to last or vice versa. Last year there were 8 repeats and 3 flips. There were 5 surprise winners – Blue Collar, <HS Grads, African Americans, No Earner, Singles & Center City. There were only 3 losers that weren’t a surprise – Northeast, Unmarried, 2+ Adults & Renters. ln 3 categories all segments spent less. In 2021, there were 9 where all spent more. Plus, in 2021, 93% of 96 demographic segments spent more. That fell to 23% in 2022.
- Region – Both winner and loser flipped. This is 5 consecutive years of flips for the Northeast.
- Winner – Midwest – Veterinary Spending: $7.62B; Up $1.16B (+18.0%) 2021: Northeast
- Loser – Northeast – Veterinary Spending: $4.88B; Down $2.64B (-35.1%) 2021: Midwest
- Comment – Only the Midwest increased spending. In 2021, all had double digit % increases.
- Age – 55>64 flipped from 1st to last. 45>54 is a new winner.
- Winner – 45>54 yrs – Veterinary Spending: $6.90B; Up $0.80B (+13.2%) 2021: 55>64 yrs
- Loser – 55>64 yrs – Veterinary Spending: $6.14B; Down $1.51B (-19.7%) 2021: <25 yrs
- Comment: Only 45>54 and 75> spent more. In 2021 all segments increased Veterinary spending. While 55>64 had the biggest individual decrease, 25>44 spending fell -$2.25B. In 2021 they spent $3.34B more, 44% of the record increase. Despite a slightly younger winner, spending skewed a little older in 2022.
- CU Composition – This was the only category with no repeats or flips. The winner & loser are both new.
- Winner – Married, Oldest Child 6>17 – Veterinary: $4.51B; Up $0.67B (+17.4%) 2021: Married, Couple Only
- Loser – Unmarried, 2+ Adults – Veterinary: $4.29B; Down $1.26B (-22.7%) 2021: Single Parents
- Comment – Single Parents were the only group to spend less in 2021. In 2022, they were 1 of only 2 segments to spend more and it was a big lift, +41.1%. Married, Oldest Child <6 had the biggest % drop, -62.6%.
- Generation – Millennials flipped to the bottom as Gen X replaced them on top.
- Winner – Gen X – Veterinary: $9.73B; Up $0.46B (+4.6%) 2021: Millennials
- Loser – Millennials – Veterinary: $7.13B; Down $2.10B (-22.7%) 2021: Born <1946
- Comments – Only Gen X and Gen Z had increases. 2022 was the year that Gen Z “got on board” in every aspect of Pet Parenting. They more than doubled their spending on Food & Services, spent 73% more on Supplies and had a +$0.32B (+80.9%) increase in Veterinary. Millennials had the biggest drop, but they are still up $1.1B from 2020.
- Income – $200K> held on to the top spot while $150>199K replaced the low income $30>39K group at the bottom.
- Winner – $200K> – Veterinary Spending: $6.72B; Up $0.39B (+6.2%) 2021: $200K>
- Loser – $150>199K – Veterinary Spending: $3.43B; Down $1.51B (-30.5%) 2021: $30>39K
- Comment – In 2021, only the $30>39K group spent less. In 2022, 3 groups spent more – $30>39K, $40>49K and $200K>. Their increases were small and when you factor in 8.8% inflation, all groups bought a smaller amount.
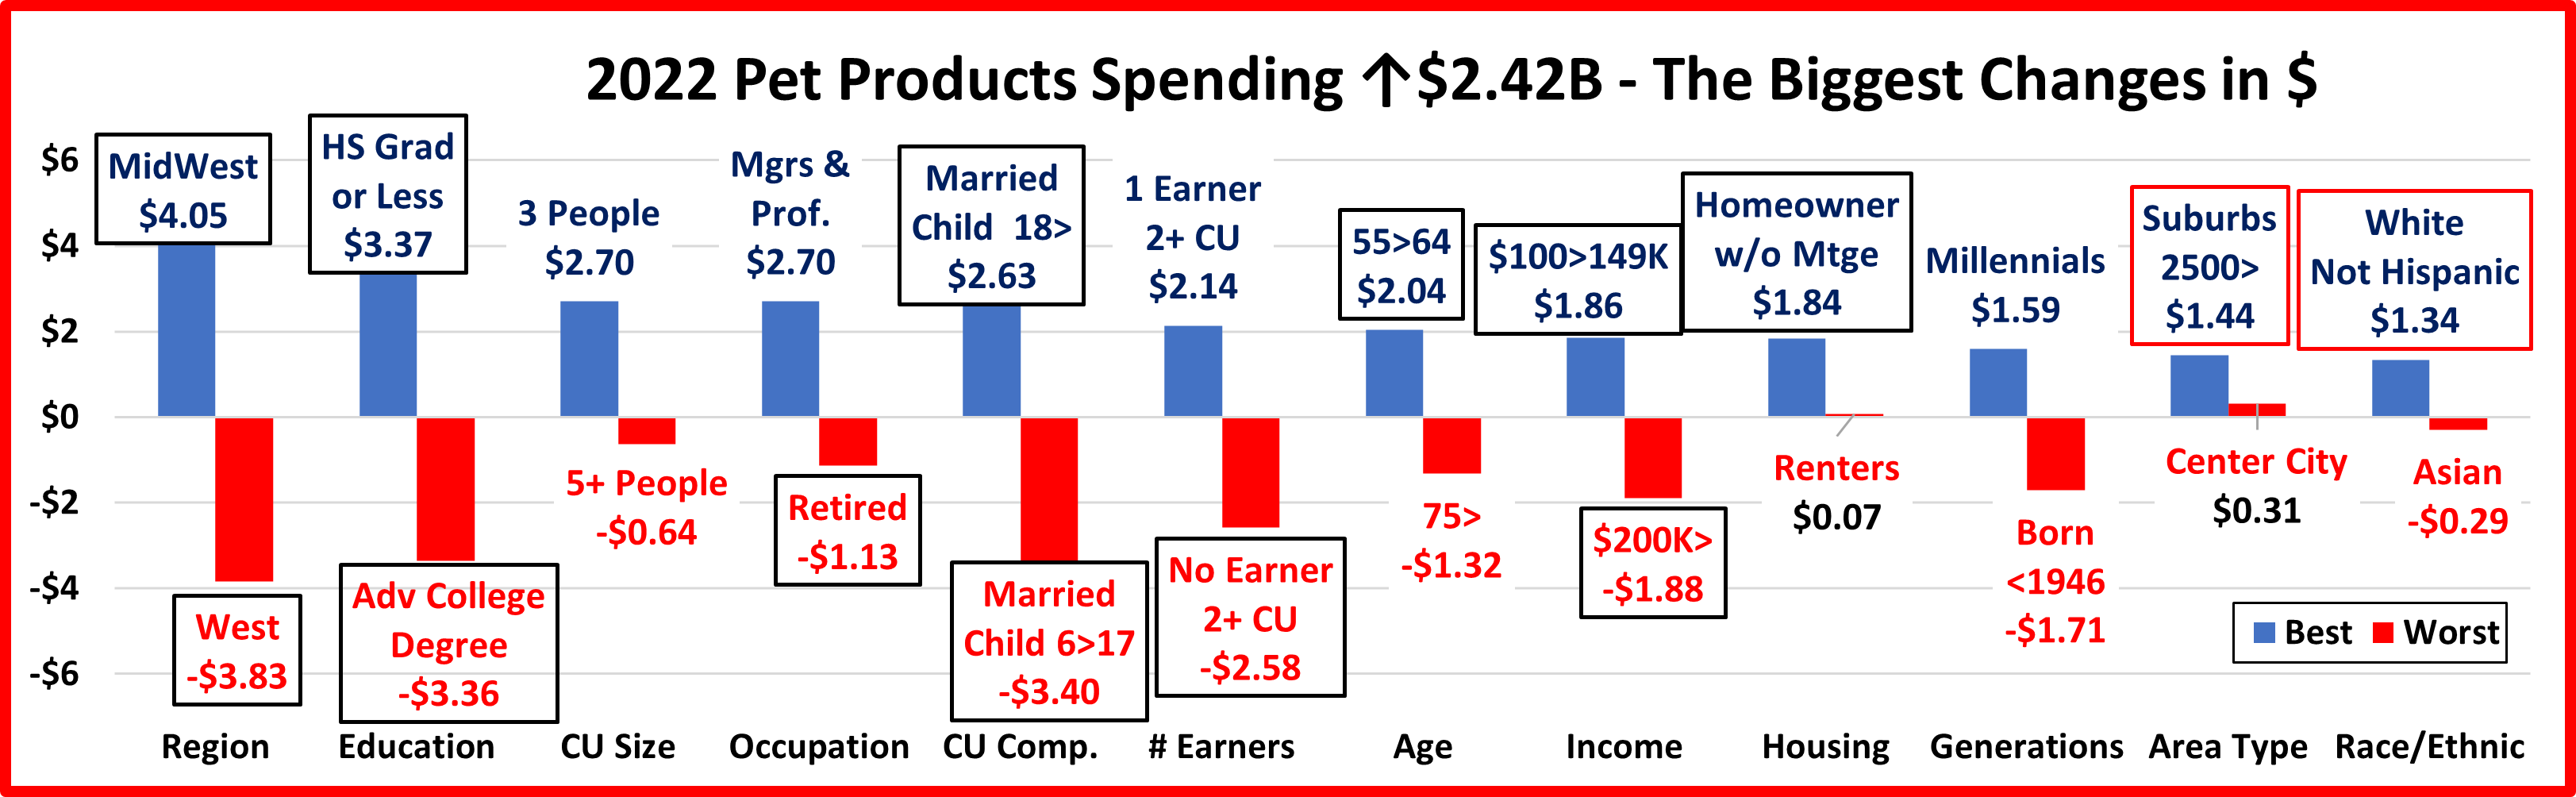
- Occupation – The winner and loser both flipped, producing 2 surprises.
- Winner – Blue Collar – Vet Spending: $1.92B; Up $0.35B (+22.4%) 2021: Mgrs & Profess.
- Loser – Mgrs & Professionals – Vet Spending: $10.67B; Down $1.47B (-12.1%) 2021: Construction Workers
- Comment – Tech/Sls/Cler and All Other/Unemployed also spent a little more. Service workers had the 2nd biggest $ decrease, -$1.23B, but the highest % drop, -31.3%. They had a $1.55B lift in 2021.
- Education – <HS Grads flipped to the top while Adv. College degree replaced them at the bottom.
- Winner – <HS Grads – Veterinary Spending: $0.62B; Up $0.25B (+66.5%) 2021: BA/BS Degree
- Loser – Adv. College Degree – Veterinary Spending: $8.06B; Down $1.69B (-17.4%) 2021: <HS Grads
- Comment – In 2021, all Education levels spent more but the lift was very much skewed towards higher Education. In 2022, the situation reversed. College grads spent -$3.27B less. <College Grads only spent +$0.31B more but all segments in the group but HS Grads w/some college increased their Veterinary spending.
- Race/Ethnic – The winner and loser flipped.
- Winner – African Americans – Veterinary: $1.18B; Up $0.18B (+18.0%) 2021: White, Not Hispanic
- Loser – White, Not Hispanic – Veterinary: $25.55B; Down $2.10B (-7.6%) 2021: African Americans
- Comment– Asian Americans also spent more. In 2020 & 2021 all groups spent more. The 2 groups with the highest level of Pet ownership drove most of the 2019>21 increase and all of the 2022 decrease. The two groups with the lowest level of pet ownership have now spent more for 3 straight years. That’s encouraging.
- # Earners – 2 Earners flipped from 1st to last and we have another surprise winner. No Earner, Singles.
- Winner – No Earner, Single – Veterinary Spending: $2.44B; Up $0.02B (+0.9%) 2021: 2 Earners
- Loser – 2 Earners – Veterinary Spending: $12.20B; Down $0.99B (-7.5%) 2021: 1 Earner, Single
- Comment – No Earner, Singles had the only increase, and it was minuscule. The drops were pretty balanced across the segments. Except for 2 Earners, all CUs with 1+ earners had a drop between -$0.55B and -$0.68B.
- # in CU – The winner and loser flipped again.
- Winner – 3 People – Veterinary Spending: $4.89B; Down $0.12B (-2.5%) 2021: 2 People
- Loser – 2 People – Veterinary Spending: $11.93B; Down $1.24B (-9.4%) 2021: 3 People
- Comment: In 2020 and 2021, all groups spent more. In 2022, all groups spent less. The $ drop by 2 People CUs was twice as big as #2, Singles. Most drops were small. Only 5+ CUs, -21.4% was over -10%.
- Area Type – Another dual flip.
- Winner – Center City – Veterinary Spending: $8.62B; Down $0.21B (-2.3%) 2021: Suburbs 2500>
- Loser – Suburbs 2500> – Veterinary Spending: $14.04B; Down $1.93B (-12.1%) 2021: Center City
- Comment – In 2020 and 2021 all groups spent more. In 2022, all spent less. Center City has now flipped for 3 straight years. The Suburbs 2500> have the biggest share of Vet $ and had a $4.4B lift in 2021. With the 2022 drop, they are still +$2.47B (+21.3%) from 2020.
- Housing – Both Homeowners w/Mtges and Renters held onto their “usual” spots at the top and the bottom.
- Winner – Homeowner w/Mtge – Veterinary: $16.90B; Down $0.66B (-3.8%) 2021: Homeowner w/Mtge
- Loser – Renter – Veterinary: $4.79B; Down $1.40B (-22.6%) 2021: Renter
- Comment – In 2021, all spent more and had an increase of at least $2B. In 2022, all spent less but Renters had the only drop over -$1B. From 2020>2022: Homeowners w/Mtges are +$2.84B (+20.1%); Homeowners w/o Mtges are +$1.43B (+21.7%); Renters are +$0.60B (+14.3%).
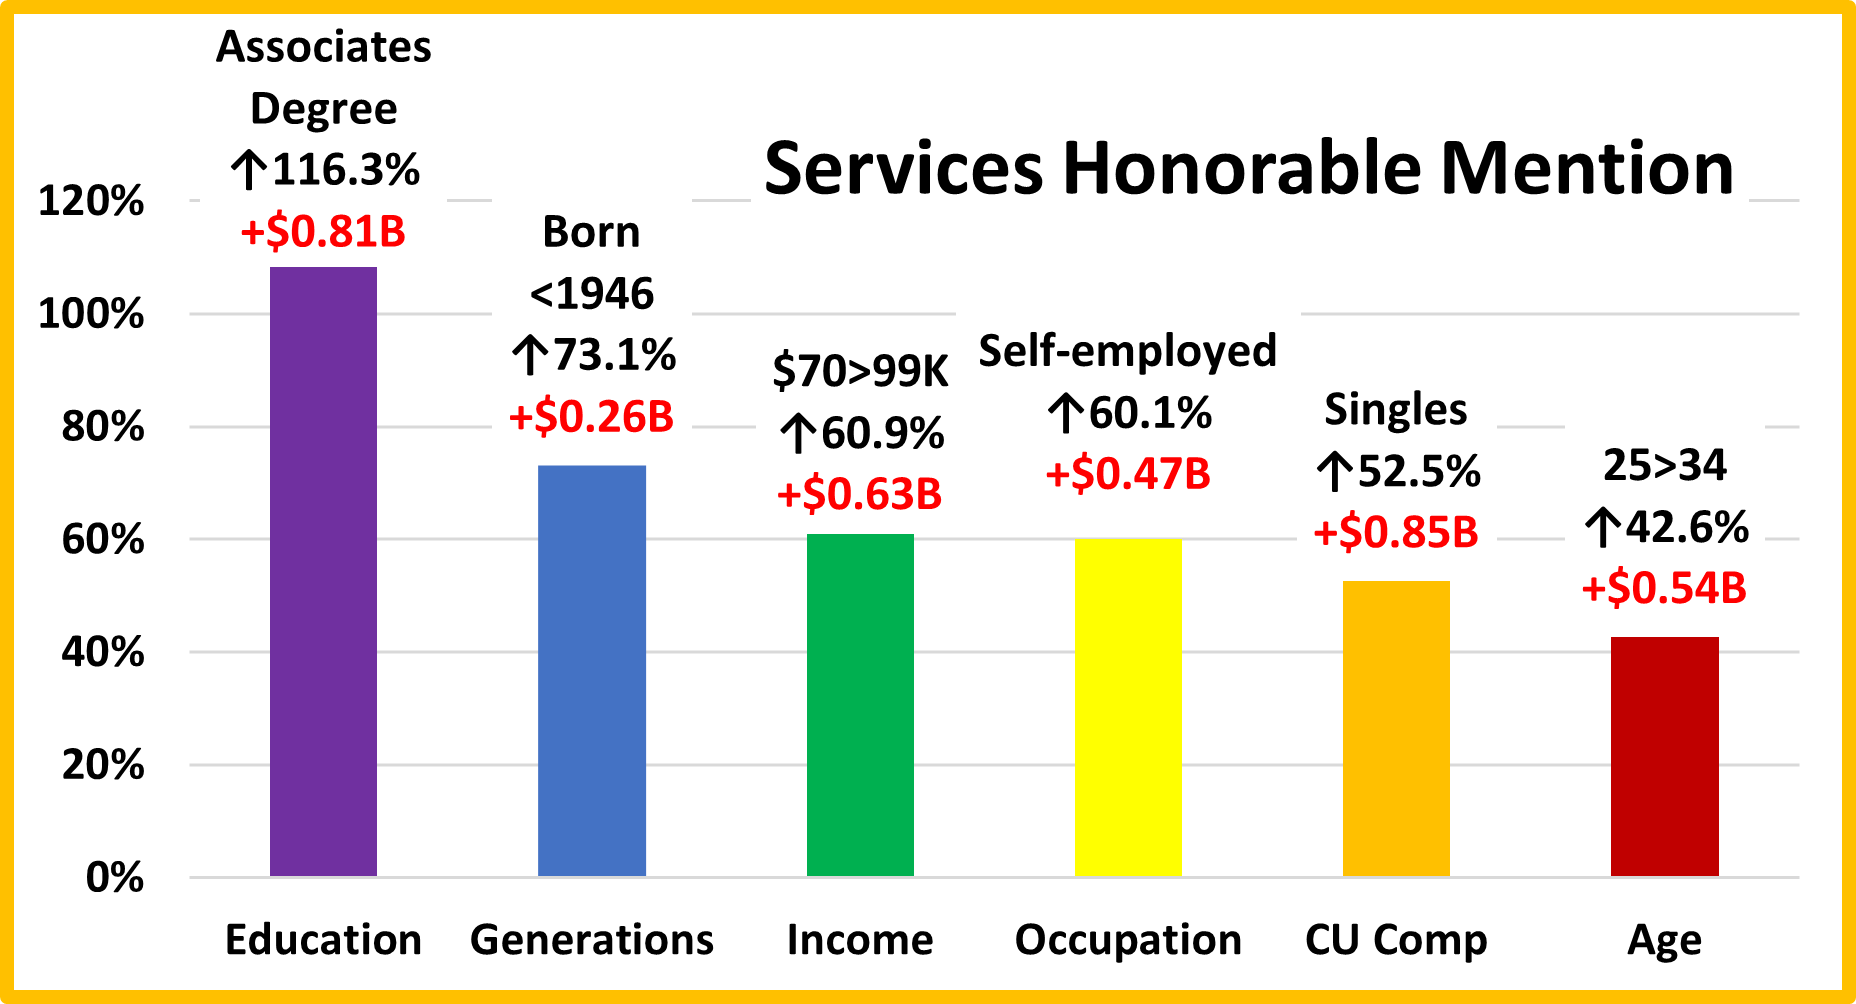
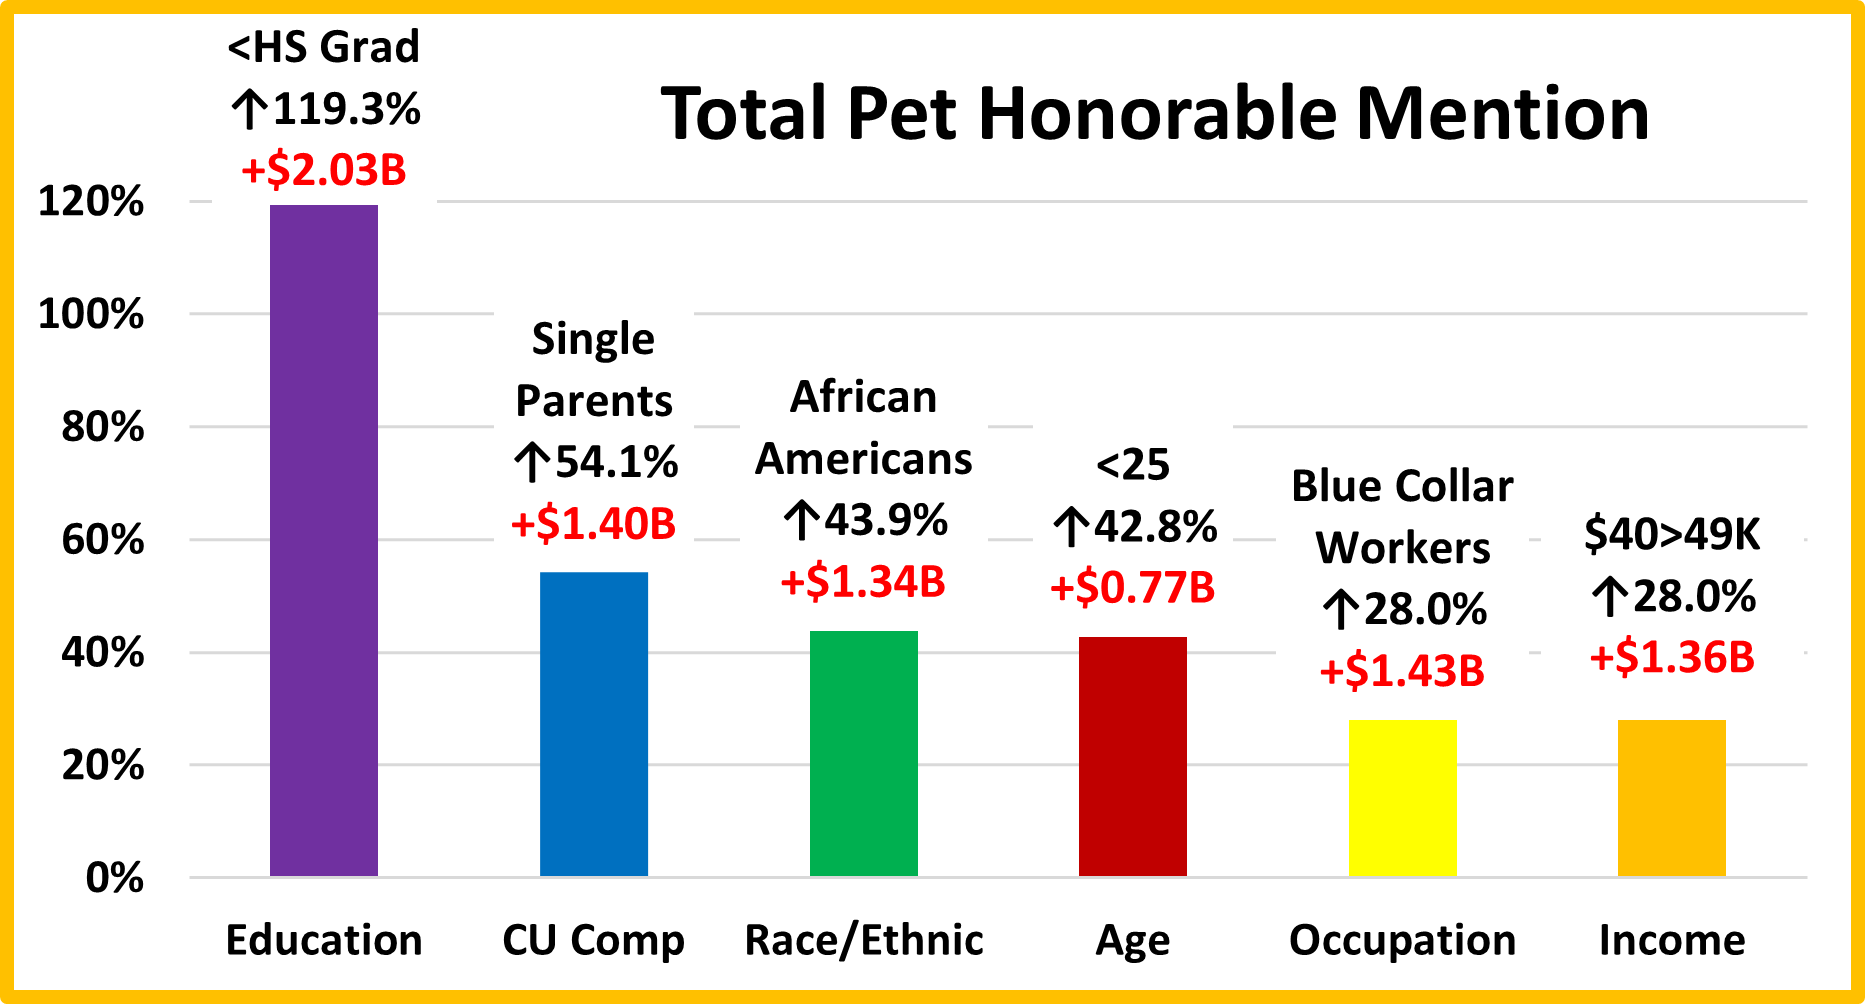
We’ve now seen the winners and losers in terms of increase/decrease in Veterinary Spending $ for 12 Demographic Categories. 2021 had a record lift but 2022 brought a $2.95B drop. The decrease brought little turmoil in performance as 88% held their position. However, the change in $ was a different story. Only 3 were the same as 2021 and 14 of 24 flipped from 1st to last or vice versa. However, the biggest difference was that in 2021, 93% of demographics spent more including 9 categories where all segments had increases. In 2022, only 23% spent more and there were 3 categories where all spent less. This made the “hidden gems” harder to find, but we did. Here are some segments that didn’t win but helped slow the drop in Veterinary spending. These groups don’t win an award, but they certainly deserve…
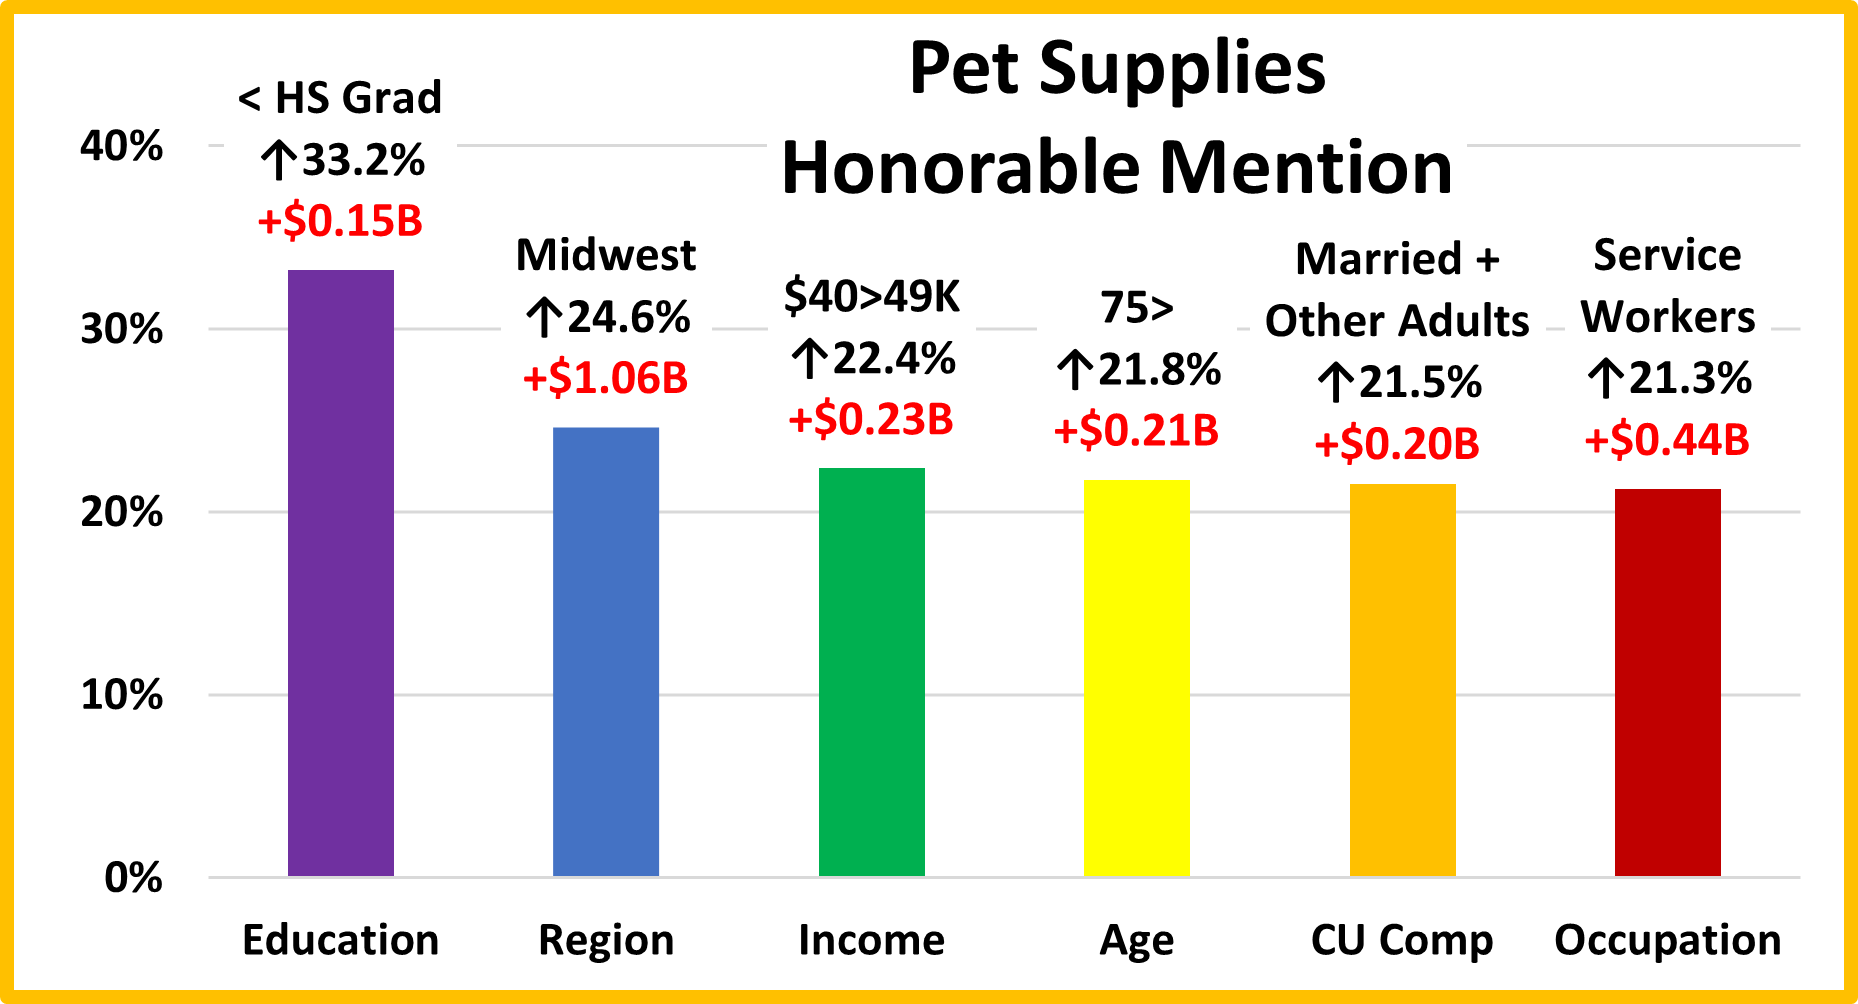
HONORABLE MENTION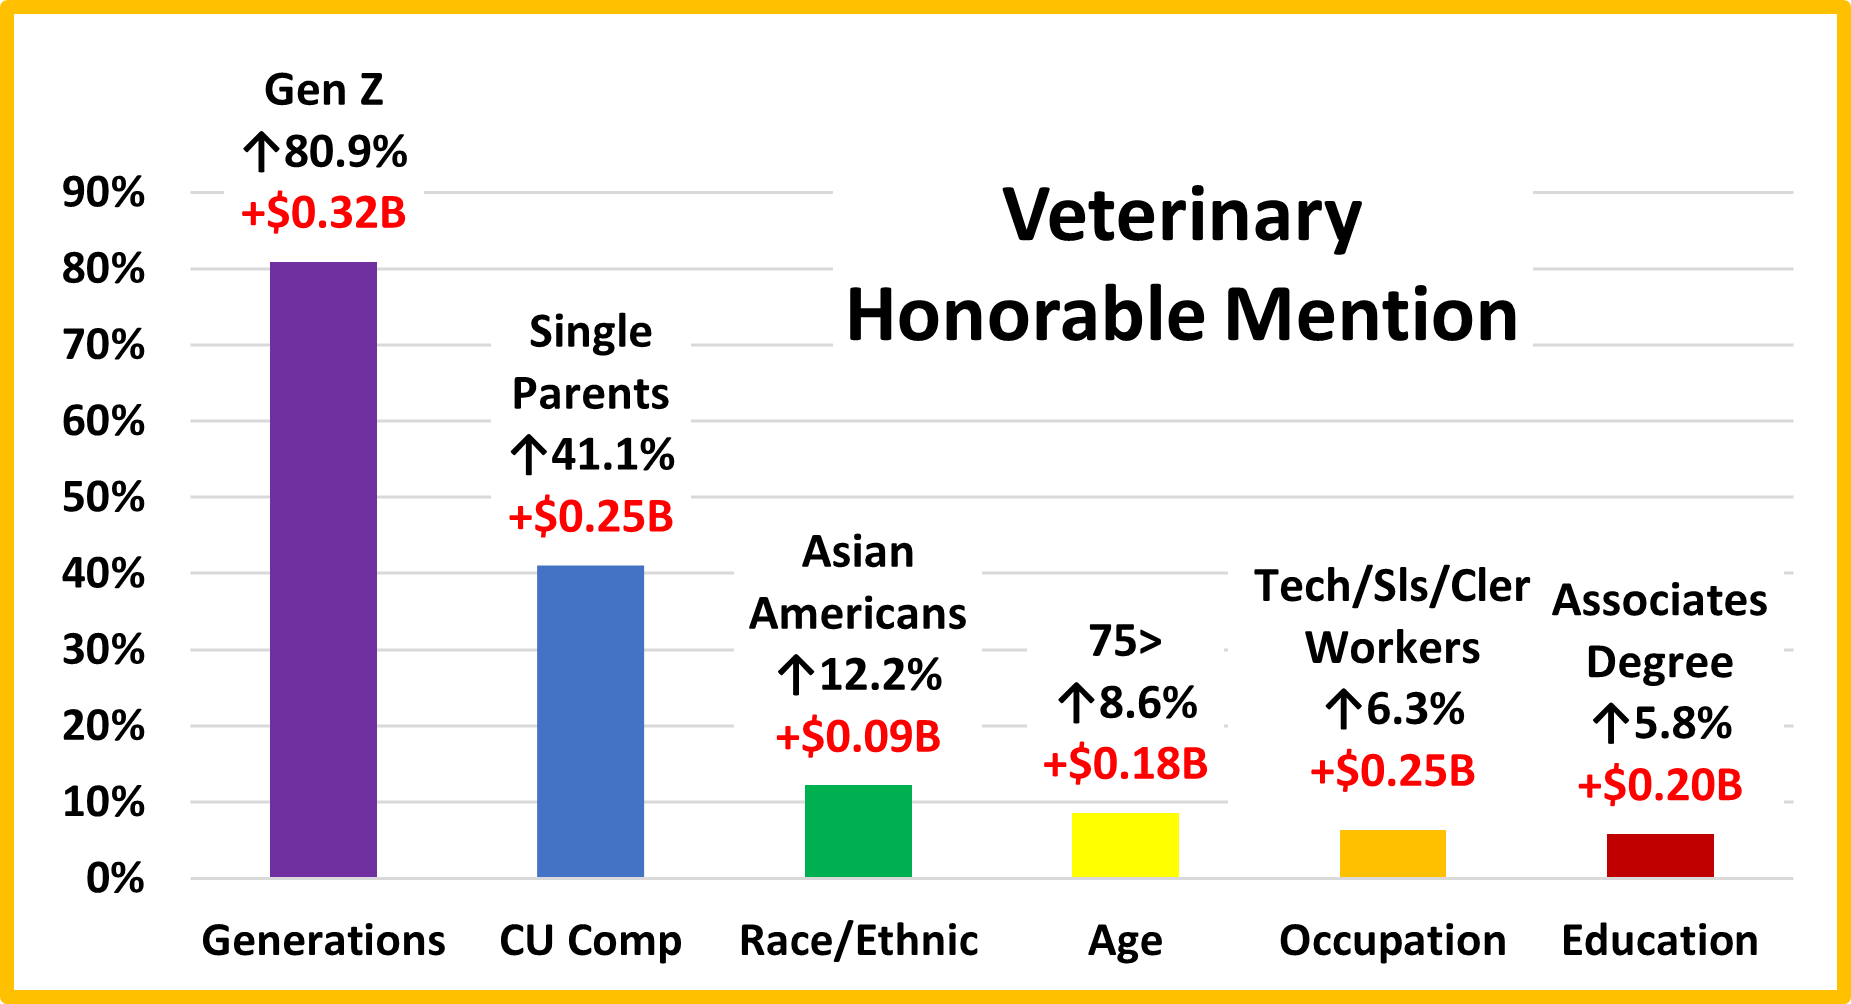 With huge lifts in all segments, Gen Z “got on board” with all aspects of Pet Parenting. Because of strong family and financial pressures, Single Parents are often at the bottom in Pet spending. In 2022, they spent 54.1% more with lifts in all segments but Supplies, including a 41% increase in Vet Services. Asians have the highest income but the lowest percentage of Pet Parents. In 2022, they focused on services, with lifts in both Non-Vet & Veterinary Services. The 75+ group is also under tremendous financial pressure. Inflation caused them to dial back Food spending, but they had lifts in all other segments. Tech/Sls/Clerical workers are low profile. In 2022, they stood out with lifts in all but Supplies. Associates Degree also usually gets little notice, but 2022 was different. They increased spending in all segments.
Summary
2016 & 2017 produced a combined increase of $3.6B in Veterinary Spending as inflation moved to record low levels. In 2018 & 2019 a Baby Boomer Spending “Bust” impacted Food & Veterinary. Fortunately, Gen X and Millennials stepped up to produce a 2.7% increase in both years. In 2020 the pandemic focused Pet Parents on the needed segments. This drove a $3B increase in Veterinary $. Boomers & Millennials led the way, but the lift was widespread as 85% of demographic segments spent more. In 2021 the lift grew to a record $7.82B with 93% of all segments spending more including 9 categories where all segments had increases. In 2022, the “binge” was not repeated. Inflation also increased radically to 8.8% and spending fell -$2.95B (-9.0%). There was little turmoil in the best and worst performing demographics as only 3 were different from 2021. However, there was considerable turmoil in the segments with the biggest changes. Only 3 of 24 winners & losers were the same as 2021 and 14 flipped from 1st to last or vice versa. 77% of all demographics spent less and in 3 categories, all segments decreased spending.
The performance of big spending groups is very important in all industry segments. In Veterinary we identified 5 demographic categories with high performing (120+%) large groups. That is 1 less than 2021. It is also 1 more than Pet Food, but 1 less than Services and 2 less than Supplies. The big groups with a high performance level in Veterinary are:
- Income: $70K> (147.8%) Performance increases with income but doesn’t reach 100+% until income reaches $100K
- CU Composition: Married Couples (130.8%) Only Married Couples perform at 100+%. (All but those w/oldest child <6)
- Education: College Grads (130.3%) Performance increases with education. All with an Associate’s Degree> are 100+%
- Housing: Homeowners (128.9%) Only Homeowners w/Mtge perform above 100%.
- Race/Ethnic: White, Not Hispanic (128.0%). Hispanics, African Americans & Asians only perform between 31% and 53%
Consumers have no control over Race/Ethnicity but can make decisions in the other categories. Income is still the most important factor. The others are important but essentially equal in performance – 128>131%. Although spending fell, it became slightly more balanced with the drop from 6 to 5 big groups performing over 120%. Another indication of this is that the average spending disparity between the best and worst performing segments dropped from 94.4% to 88.8%.
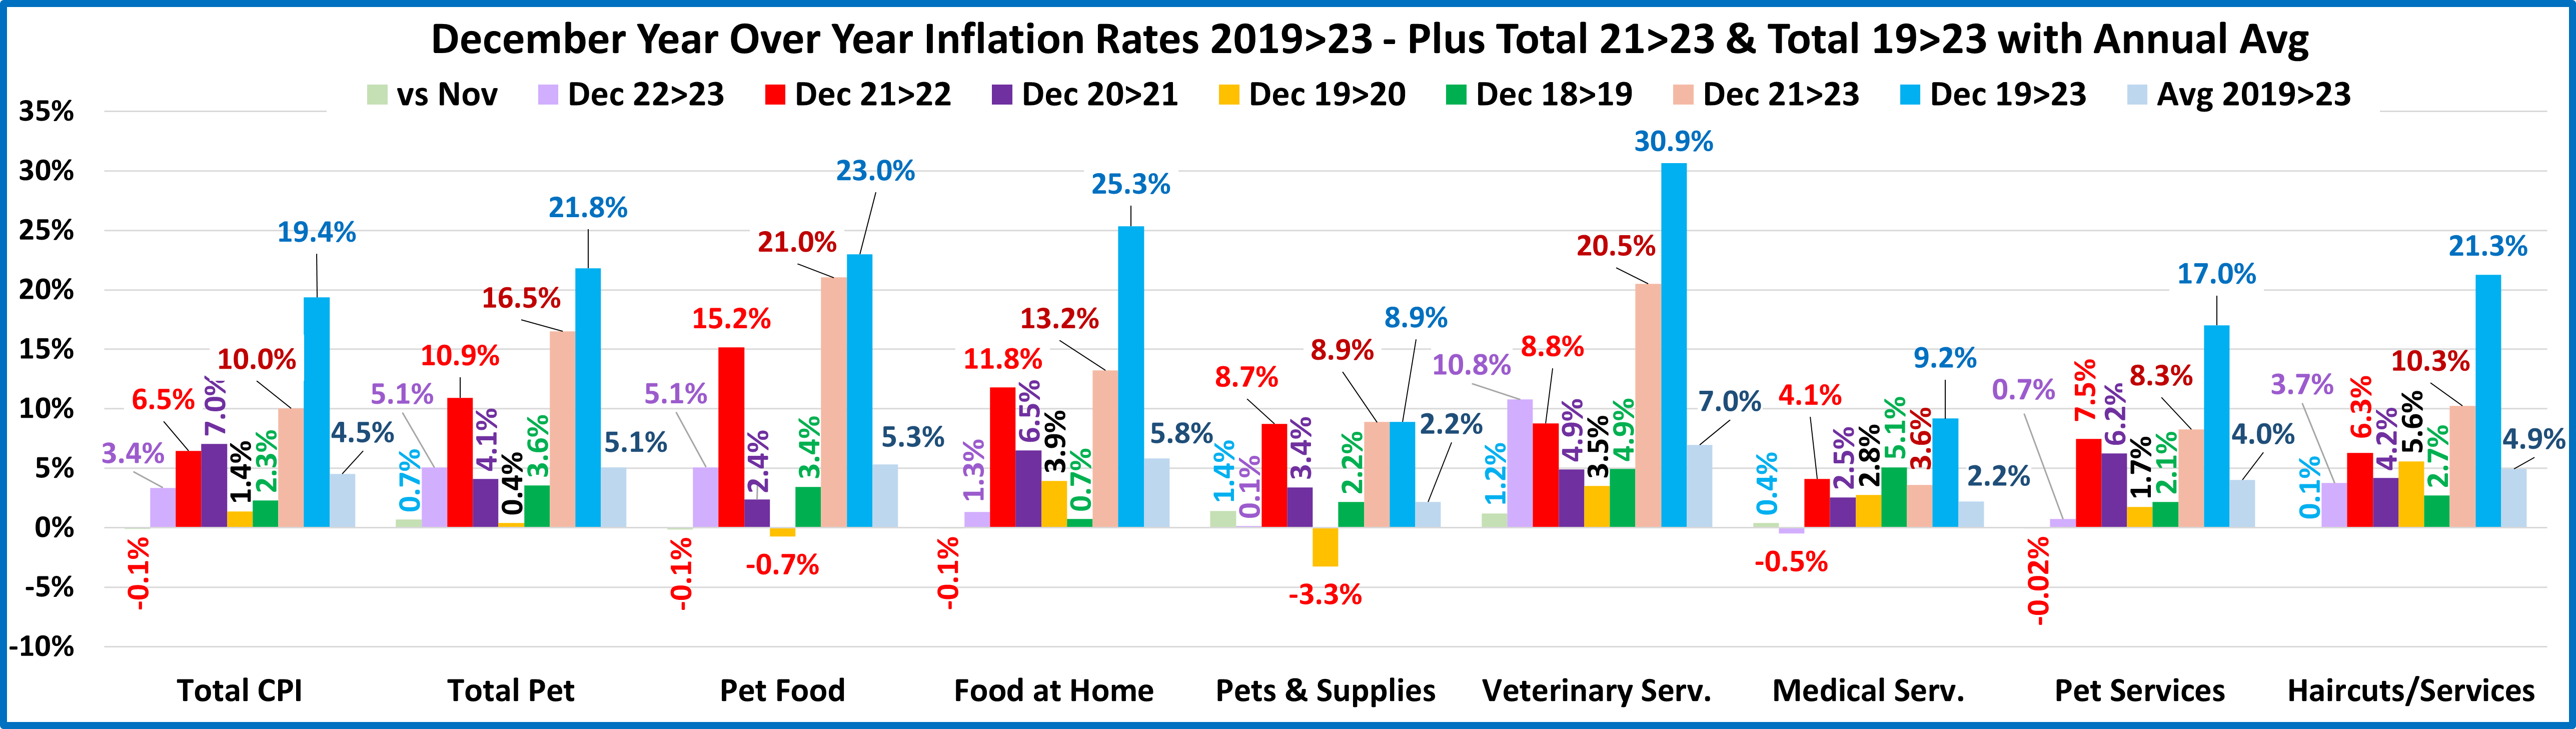
Another big concern is high inflation. In 2021 spending grew 31.5% in the pandemic surge. Inflation was high at 4.2% but 84% of the growth was real. In 2022 spending fell -9.0%. Inflation was 8.8% so the amount sold was really down -16.4%. Also 77% of 96 demographic segments spent less $ but if we factor inflation into the numbers, 91% actually bought less Veterinary Services. If high inflation continues it could have a major impact on Veterinary Spending.
Finally – The “Ultimate” Veterinary Services Spending Consumer Unit consists of 4 people – a married couple with an oldest child over 18. They are 45>54 years old. They are White, but not of Hispanic origin. At least one of them has an Adv. College Degree and works as a Mgr/Professional. Their oldest child also works. Their total income is $200K>. They live in a small suburb, adjacent to a big city in the Midwest and are still paying off the mortgage on their home.