2022 U.S. VETERINARY SERVICES SPENDING $29.71B…Down ↓$2.95B
Veterinary Services is the 2nd largest segment in the Pet Industry. For years, high inflation has been a problem in the segment. Spending grew 24.0% from 2014>2019. Prices rose 17.4%, an avg of 3.3%. This caused a reduction of visit frequency and only 28% of the growth was “real” (avg real growth: +1.3%). In late 2020 & 2021, COVID focused Pet Parents on their “children’s” needs, including Veterinary Services. In 2021 Veterinary Spending reached $32.76 with 87% “real” growth. In 2022 the binge was not repeated so spending dropped to $29.71B, down $2.95B (-9.0%). Inflation was also high in 2022, 8.8%. In this report, we’ll take a closer look at the demographics behind the 2022 numbers. Note: All 2022 numbers in this report come from or are calculated by using data from the US BLS Consumer Expenditure Interview Survey, rather than their Diary report. The low frequency of Veterinary Visits is still generating an extremely high variation in Diary data. Interview is a more logical and accurate way to track Veterinary Services Expenditures.
Let’s get started. Veterinary Spending per CU in 2022 was $221.60 down 9.4% from $244.51 in 2021. (Note: A 2022 Pet CU (68%) Spent $325.88. More specifically, the decrease in Veterinary spending came as a result of:
- 0.4% more CU’s
- Spending 7.7% less $
- …1.8% less often
We’ll take a closer look. But first, the chart below gives an overview of recent Veterinary Spending.
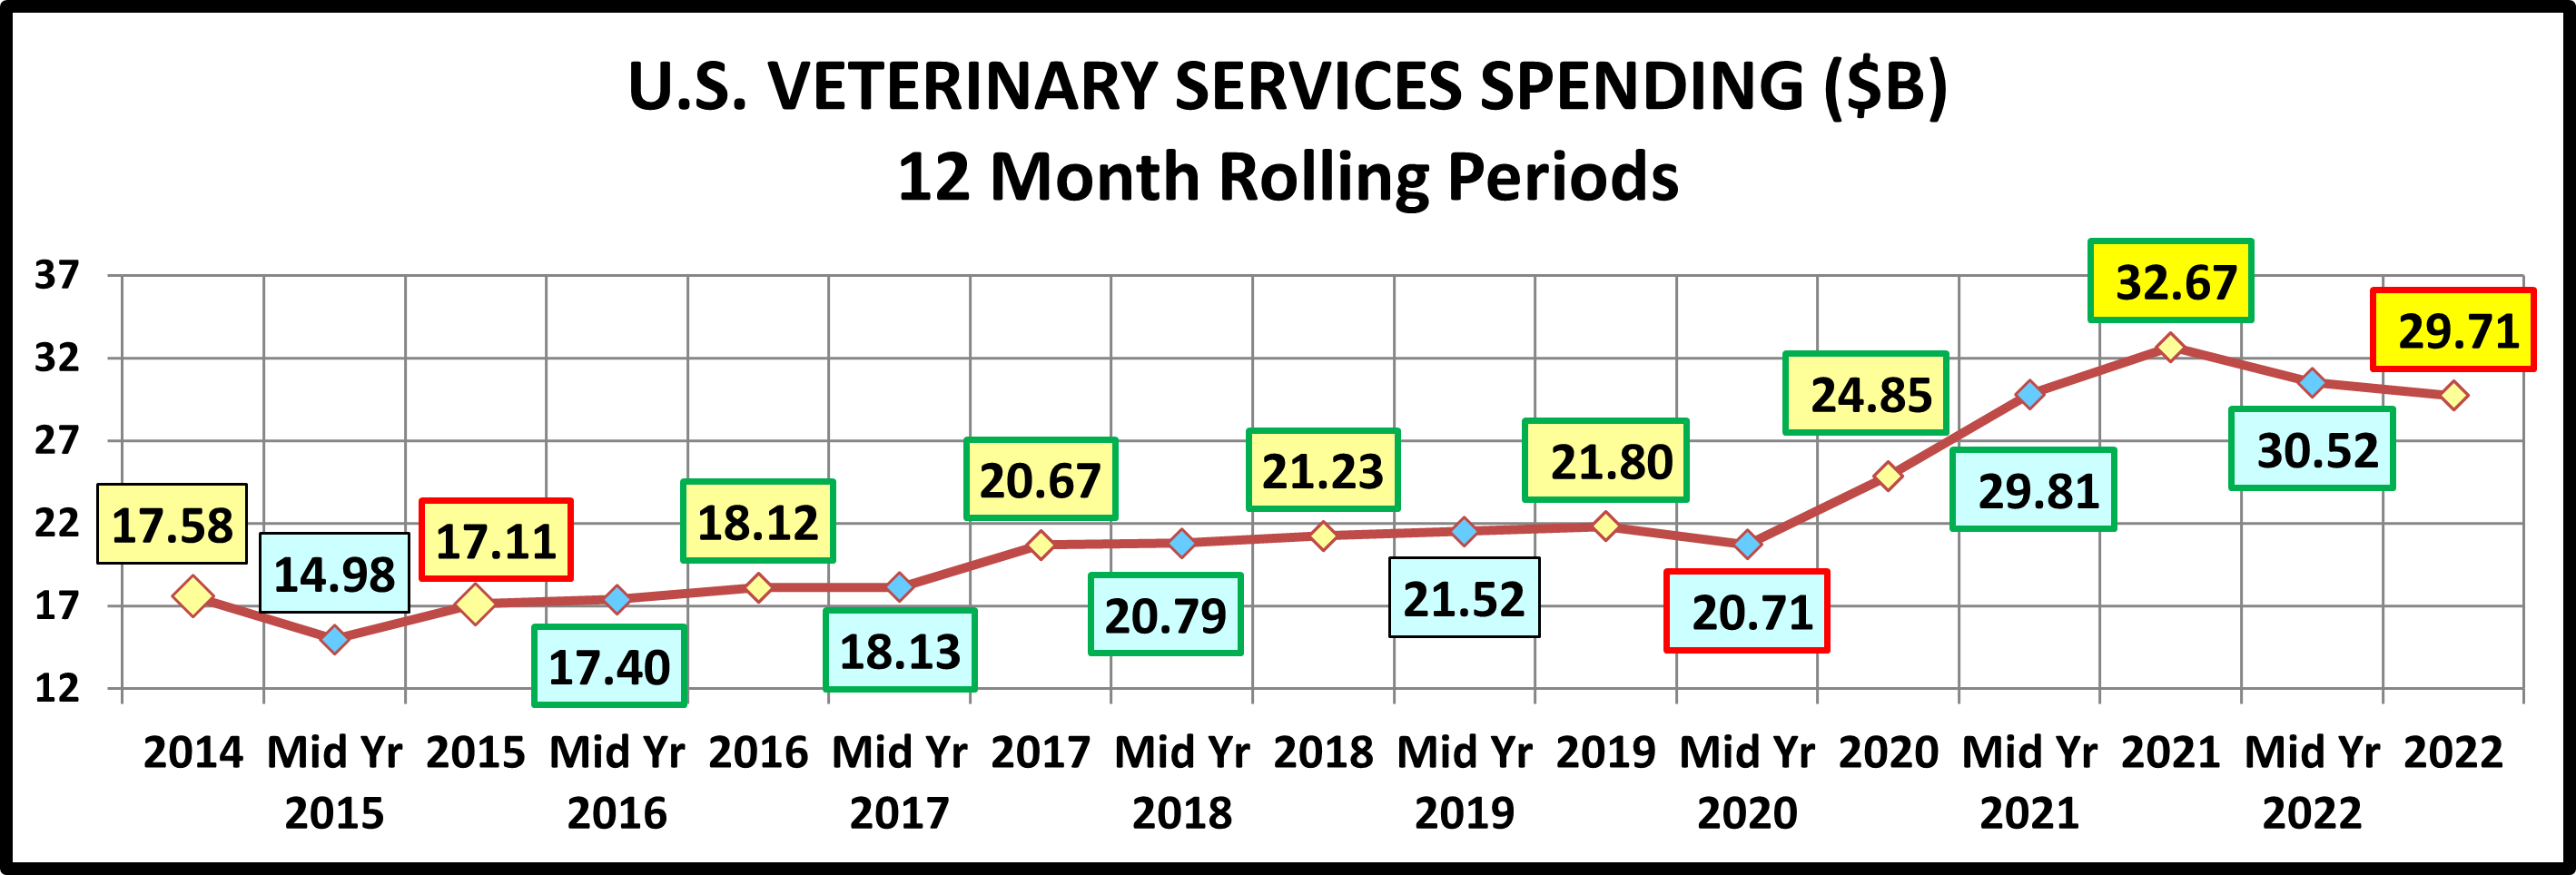
The big drop in the first half of 2015 was tied to the upgrade to Super Premium Foods – Trading $. Then consumers began value shopping for Food and the savings freed up $ for Veterinary Services. Spending began to climb until it flattened out at the beginning of 2017. Inflation slowed in the 2nd half and spending took off. In 2018 prices turned up and consumers held their ground through 2019. The initial COVID reaction in 2020 was a drop in spending but “need focused” consumers then drove a huge increase through 2021. In 2022, inflation grew to 8.8% and spending slowed.
Now, let’s look at Veterinary spending by some specific demographics. First, here is a chart by Income Group
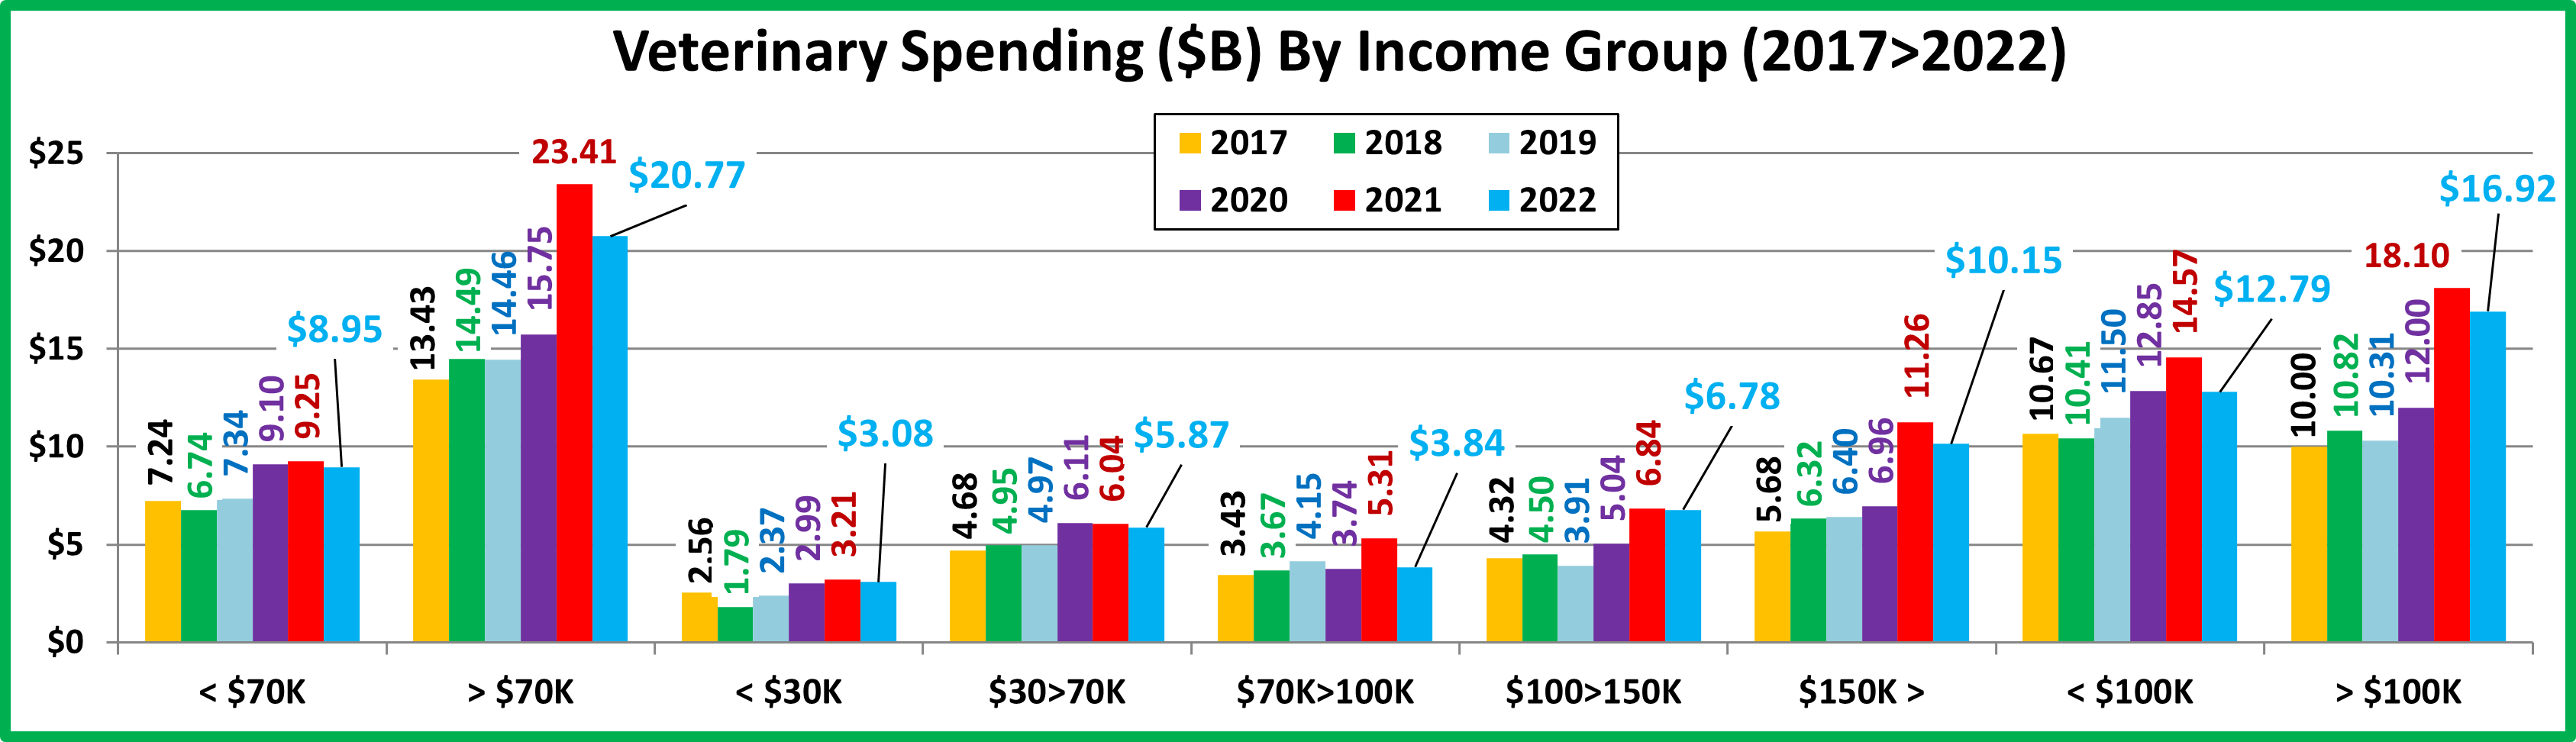
Veterinary Spending is still strongly driven by income. All groups spent less in 2022 with the biggest drop coming in the $70K> group. This is not unexpected as they drove the “binge” lift in 2021. The $100>150K group had the smallest decrease. However, the 50/50 spending break point in $ still grew slightly from $113K in 2021 to $115K in 2022.
National: $221.60 per CU (-9.4%) – $29.71B – Down $2.95B (-9.0%)
- Over $150K (17.7% of CUs) – $428.31/CU (-19.8%) $10.15B, Down $1.11B (-9.9%) This highest income group is the biggest Veterinary Spender as 17.7% of CUs generated 34.1% of 2022 $ but also 37.6% of the decrease from 2021.
- $100>150K (15.5% of CUs) – $326.23/CU (-9.6%) $6.78B, Down $0.06B (-0.9%) Spending by this middle/upper income group slowed in 2019 but took off in 20>21 as they filled their pets’ needs. In 2022, their spending stabilized.
- $70K>100K (14.1% of CUs) – $202.95/CU (-24.3%) $3.84B, Down $1.47B (-27.7%) Steady growth 2016>19. Then $ fell in 2020 due to monetary pressures. 2021 had a big lift. High inflation was likely a factor in their big 2022 drop.
- $30K>70K (28.9% of CUs) – $151.44/CU (-0.6%) $5.87B, Down $0.17B (-2.8%) From 2016 to 2020 their pattern was remarkably similar to the big spending $150K+ group. That changed in 2021 as they were the only group to spend less in Vet $ while $150K> had the biggest lift. In 2022 their $ continued to drop but the decrease was only -2.8%.
- Under $30K (23.8% of CUs) $96.37/CU (+2.5%) $3.08B, Down $0.13B (-4.1%) This group is very price sensitive. After the big spending dip in 2018, they have slowly but consistently increased Veterinary spending until the small drop in 2022. They are 20% ahead of their 2017 Veterinary $, but considering inflation, they actually bought 5% less.
Now, here is Veterinary Spending by Age Group

Only 45>54 & 75> spent more. 55>64 & 35>44 had the biggest drops, about -$1.5B. In 2021 they had the biggest lifts.
National: $221.60 per CU (-9.4%) – $29.71B – Down $2.95B (-9.0%)
- <25 (4.7% of CUs) – $60.30/CU (-5.6%) -$0.38B – Down $0.04B (-10.4%) Many combined into group CUs and some got married so 5.1% less CUs spent 7.8% more $ …12.5% less often.
- 25>34 (15.6% of CUs) – $200.84/CU (-15.5%) – $4.20B – ↓ $0.80B (-16.0%) The commitment of these Millennials to their pets is growing. After being stable from 2017>19, the pandemic caused Veterinary spending to take off In 2020 & 2021. A 2022 drop was not unexpected as 0.6% less CUs spent 7.5% less $ …8.7% less often.
- 35>44 (17.0% of CUs) – $223.94/CU (-21.7%) – $5.11B – ↓ $1.45B (-22.1%) In 2019, they radically increased their spending and briefly became #1 in Veterinary $. In 2020, unlike most groups, spending decreased. In 2021 they had the biggest % increase. In 2022 their spending fell $1.44B as 0.5% less CUs spent 6.0% less $ …16.7% less often.
- 45>54 (16.9% of CUs) – $303.96/CU (+11.2%) – $6.90B – Up $0.80B (+13.2%) This group has the highest income, but value is important. In 2017, the slowed inflation caused them to spend significantly more money. In 2018, prices turned up and continued to inflate in 2019. Spending dropped precipitously to their 2016 level and they lost the top spot in Veterinary $. 2020 brought a big spending lift which continued into 2021 and 2022 despite high inflation. They moved back to the top in Veterinary spending as 1.8% more CUs spent 6.5% more $…4.4% more often
- 55>64 (18.2% of CUs) – $251.46/CU (-18.7%) – $6.14B – ↓ $1.51B (-19.7%) This group was the leader in Veterinary Spending prior to 2015. In 2015 they upgraded to Super Premium Food and Vet Spending fell. In 2016 inflation slowed and they regained the top spot. In 2018 Veterinary prices began to strongly inflate again. Their spending fell and continued down into 2019. In 2020 they moved back to the top in Veterinary Spending. They stayed there with the biggest lift in 2021. In 2022 their spending binge ended and inflation soared to 8.8% so 1.3% fewer CUs spent 21.0% less $ …2.9% more often. They had the biggest drop in $, -$1.51B and fell to 2nd place in Veterinary spending.
- 65>74 (16.2% of CUs) – $216.86/CU (-3.9%) – $4.71B – ↓ $0.14B (-2.8%) This group is growing and is all Boomers, so they are committed to their pets. They had consistent annual growth from 2018>2021. In 2022 1.2% more CUs spent 8.9% less $ …5.4% more often. Inflation was likely a factor in their small decrease.
- 75> (11.4% of CUs) – $149.35/CU (+3.5%) – $2.28B – Up $0.18B (+8.6%) This group of oldest Pet Parents has a strong commitment to their pets. In 2015, they had a $1B increase in Veterinary Spending. In 2016 & 2017, they focused on Food, Supplies and Services. In 2018, they turned their attention back to Veterinary. However, their spending has slowly but consistently grown every year since 2015 – the only group to accomplish this. In 2022 4.9% more CUs spent 7.2% less $ …11.5% more often. This produced an 8.6% increase in spending.
Now, let’s take a look at some other key demographic “movers” behind the 2022 Veterinary Spending numbers.
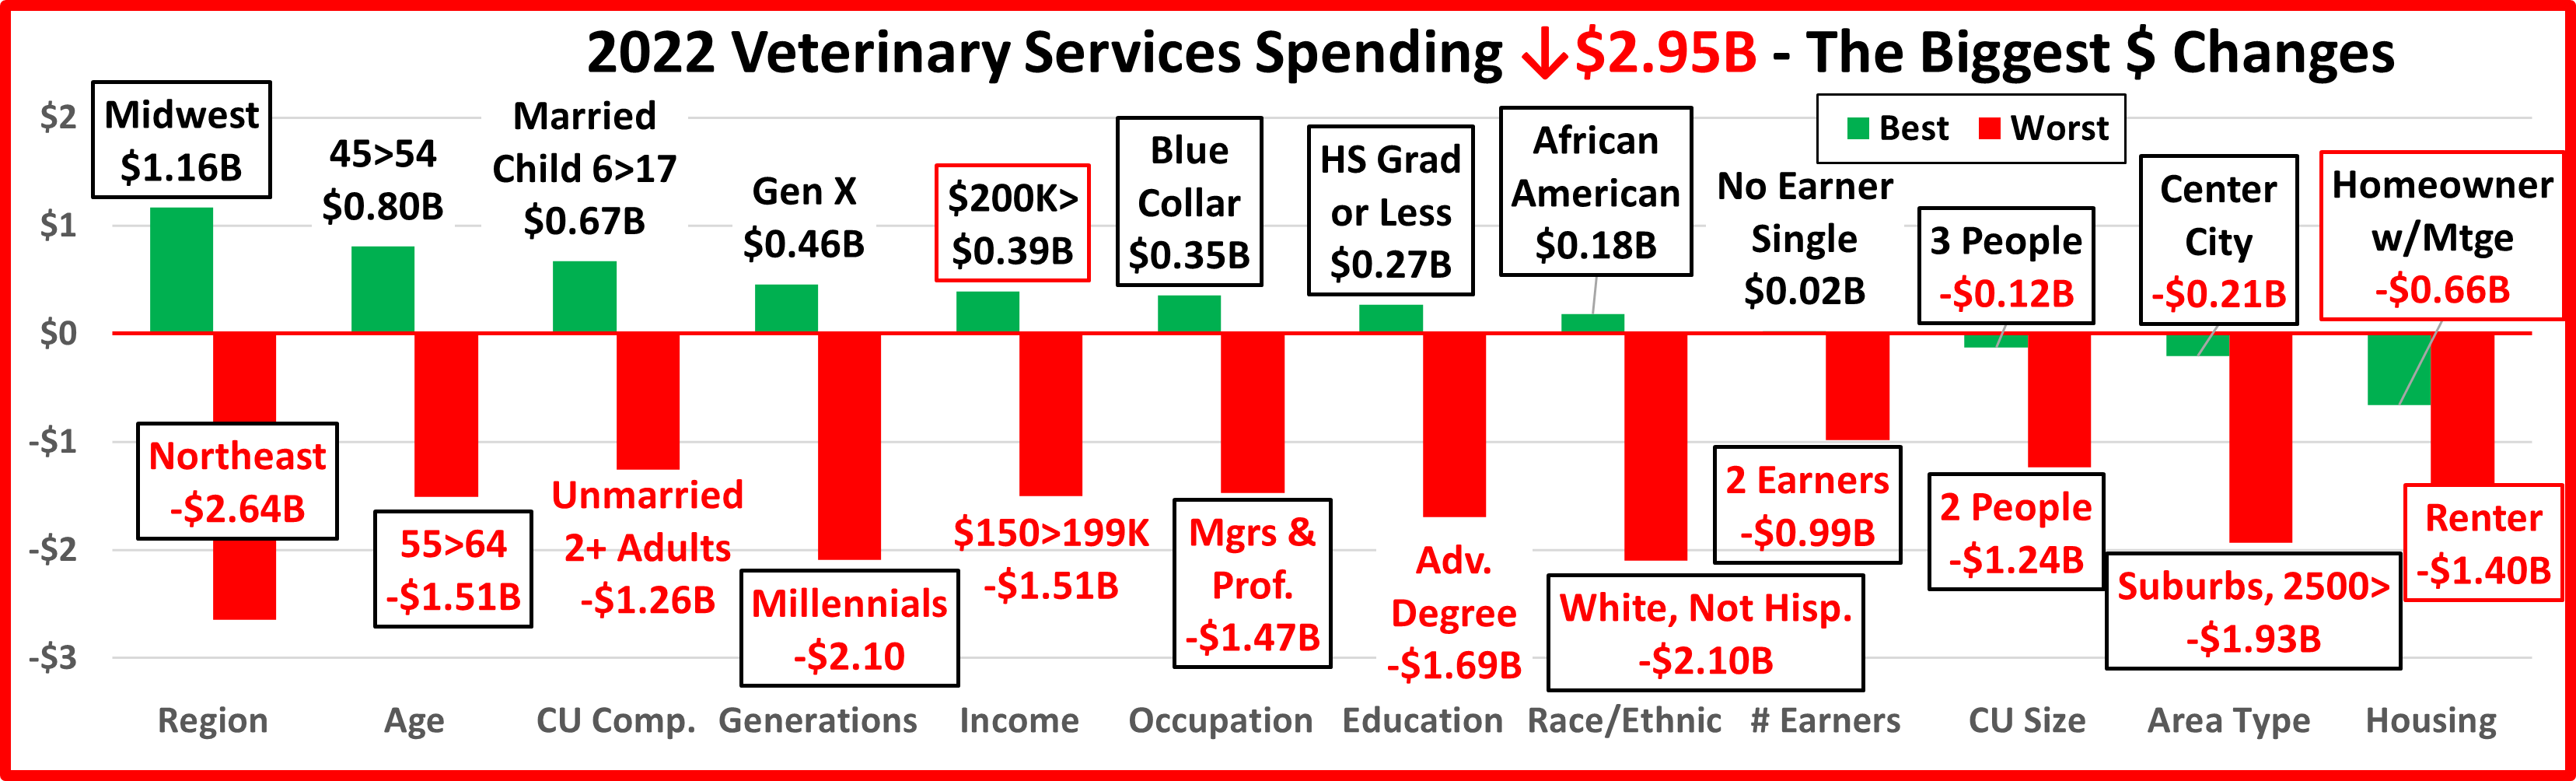
Veterinary spending fell by $2.95B (-9.0%) in 2022. With a high 8.8% inflation rate, the real drop in the amount of services bought was -16.4%. 74 of 96 demographic segments (77.1%) spent less on Veterinary Services, a big change from 2021 when 93.4% of segments spent more. There was a lot of turmoil as 14 of 24 flipped from first to last or vice versa while only 3 segments maintained their position from 2021. 8 of the flips were from 1st to last. We should also note that in 2021 there were 9 categories in which all segments spent more. In 2022 in 3 categories, all spent less.
Only 4 of the “winners” are often found at the top:
∙ 45>54 yr olds ∙ Gen X ∙ $200K ∙ Homeowners w/Mtg (had the smallest decrease)
The biggest surprises are:
∙ Blue Collar ∙ HS Grad or Less ∙ African American ∙ No Earner, Single ∙ Center City (had the smallest decrease)
Both groups have one characteristic in common – Income. The usual winners have the highest income in their demographic category and the surprises are all at or near the bottom in income for their category.
In the “losers” group, there are only 2 that are often on the bottom – Renters and Unmarried, 2+ Adult CUs. 8 of the 12 flipped from 1st in 2021 to last in 2022 but all have 1 thing in common. They all binge spent on Veterinary Services in 2021. Since binges usually aren’t repeated, it’s not surprising that they had big decreases in 2022.
Overall, the $2.95B drop in $ was just 37.7% of the $7.82B lift in 2022 – a net gain of $4.87B in 2 years (+19.6%). Considering inflation, 87% of the 20>21 growth was real but only 31.5% of the 20>22 growth. There was only a 6.2% increase in the amount of Veterinary Services bought from 2020 to 2022. High inflation is a problem.
The 2022 decrease was widespread across Income and Age groups as all income groups spent less and only 2 age groups spent more. The drop was also widespread beyond Age and Income. 77% of all segments spent less including 3 categories – Housing, Area and CU Size, where all segments had decreased Veterinary Services spending.
Prior to 2020 there was a strong youth movement in Veterinary Spending from the <45 crowd. That changed in 2020 as the 45> groups accounted for 94% of the $3B increase. In 2020 & 2021 the 55>64 yr-olds were on top , followed by the highest income 45>54 yr-olds in 2022. The $ are skewing older but have also become more balanced from 25>74. Although Veterinary services are needed by all Pet Parents, higher income is still the biggest driver in spending. This is best illustrated by comparing segment performance (Share of $/Share of CUs): <$30K: 50.6%; $30>69K: 68.3%; $70K>99K: 91.6%; $100>149K: 147.2%; $150>199K: 151.2%; $200K>: 225.3%. Yes, Vet Services are needed by all, but are becoming less affordable for many.