2022 U.S. PET SERVICES SPENDING $12.36B…Up ↑$3.26B
Except for a small decline in 2017, Non-Vet Pet Services had shown consistent, small annual growth. In 2018, that changed as spending grew a spectacular $1.95B. The number of outlets offering Pet Services has rapidly grown and more consumers have opted for this convenience. However, spending plummeted -$1.73B in 2020 due to COVID closures and restrictions. 2021 & 2022 brought a strong recovery. Spending grew $2.21B in 2021, then $3.26B (+35.8%) in 2022 to $12.36B. In this report we will drill down into the data to see what groups drove the record lift in 2022. (Note: All numbers in this report come from or are calculated by using data from the US BLS Consumer Expenditure Surveys)
Services’ Spending per CU in 2022 was $92.21, up 35.3% from $68.13 in 2021. Note: A 2022 Pet CU (68%) Spent $135.60
More specifically, the 35.8% increase in Total Pet Services spending came as a result of:
- 0.4% more CUs
- Spending 17.7% more $
- 15.0% more often
The chart below gives a visual overview of recent spending on Pet Services
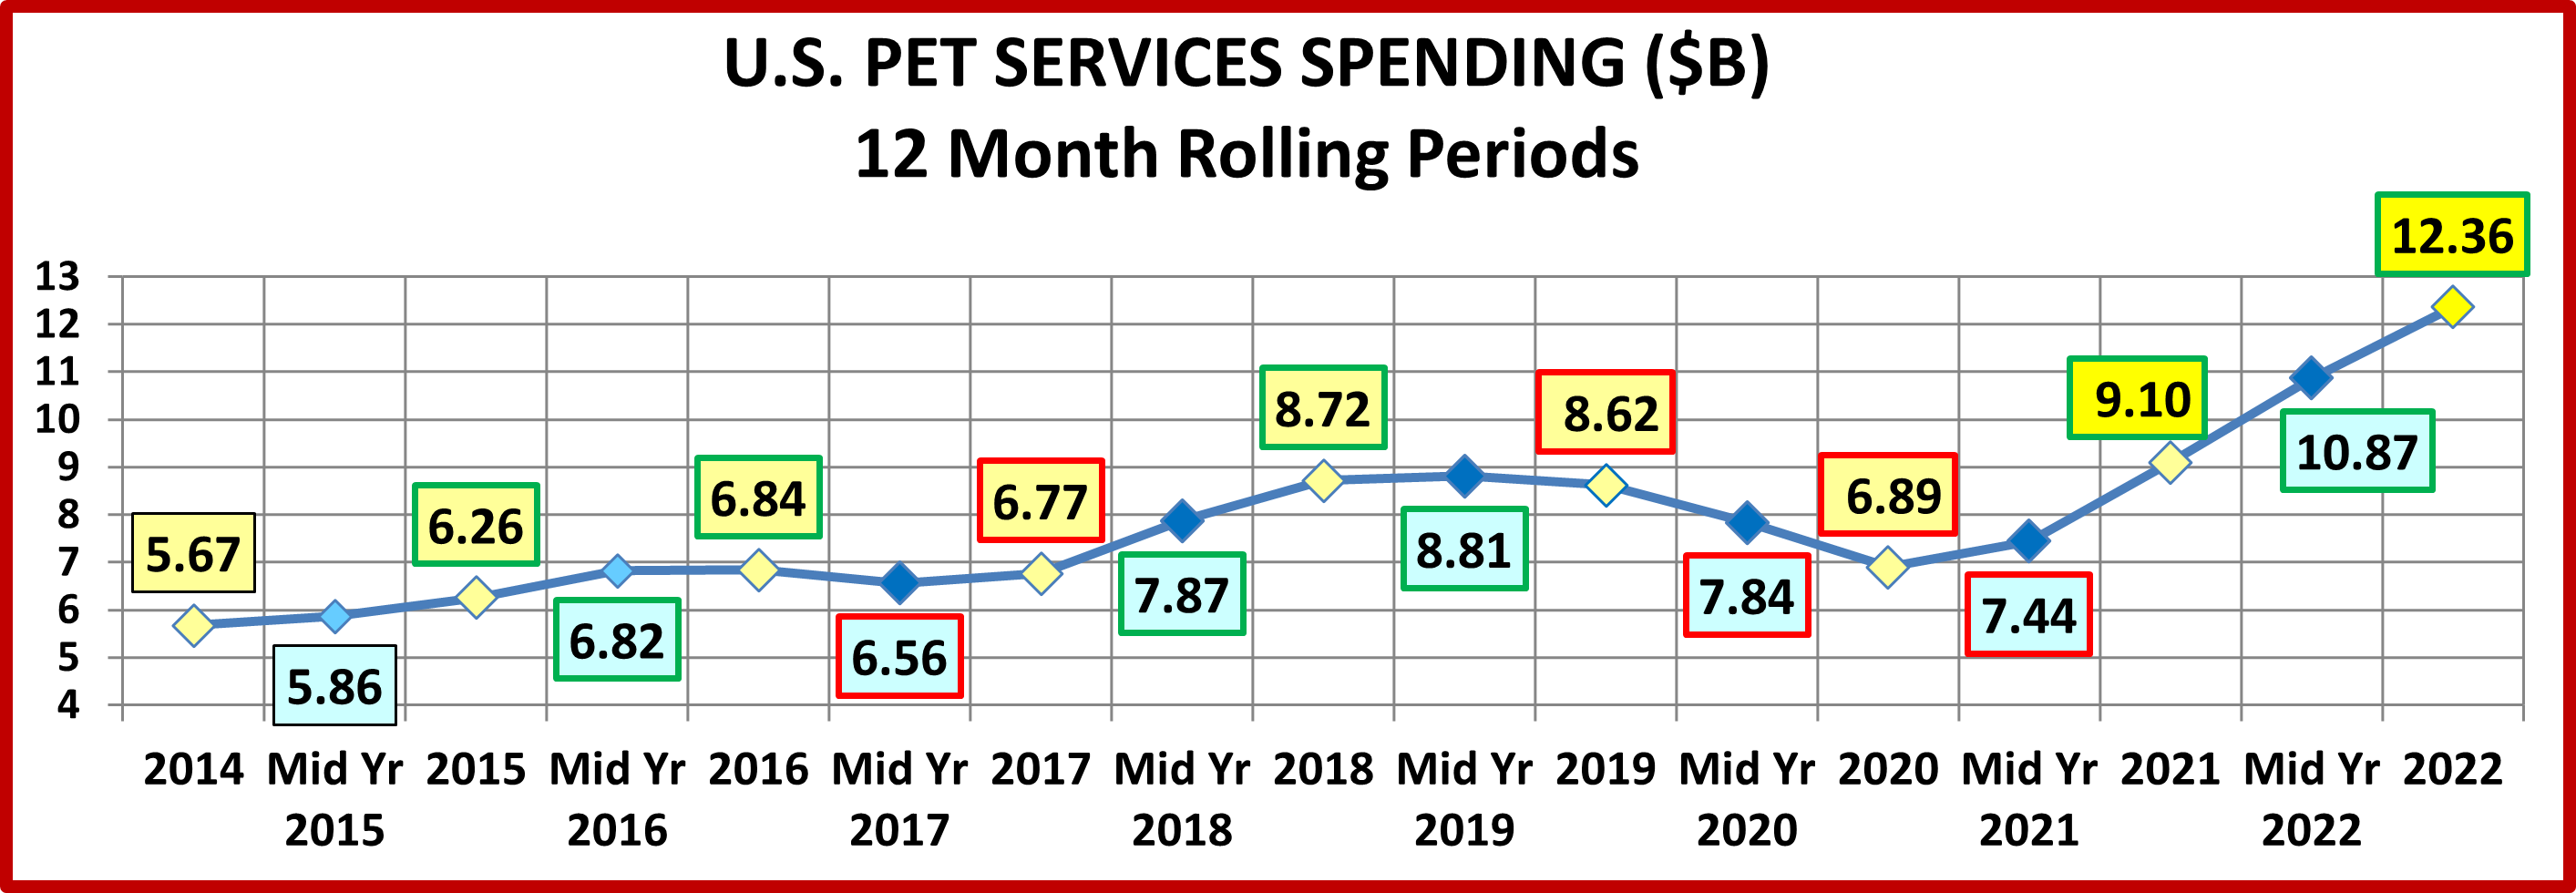
After the big lift in 2018, spending stabilized in 2019. Increased availability and convenience of Services has significantly increased Services spending. This happened despite a return to a normal inflation rate, +2.4%. However, inflation grew to 2.5+% and in the 2nd half of 2019 and spending declined slightly. The 2020 pandemic brought restrictions and closures which drove spending radically down. In 2021 the recovery began and accelerated through 2022 despite inflation rates of 4.9% in 2021 & 6.3% in 2022. Now, let’s look at some specific demographics of 2022 Services spending.
First, by Income Group.
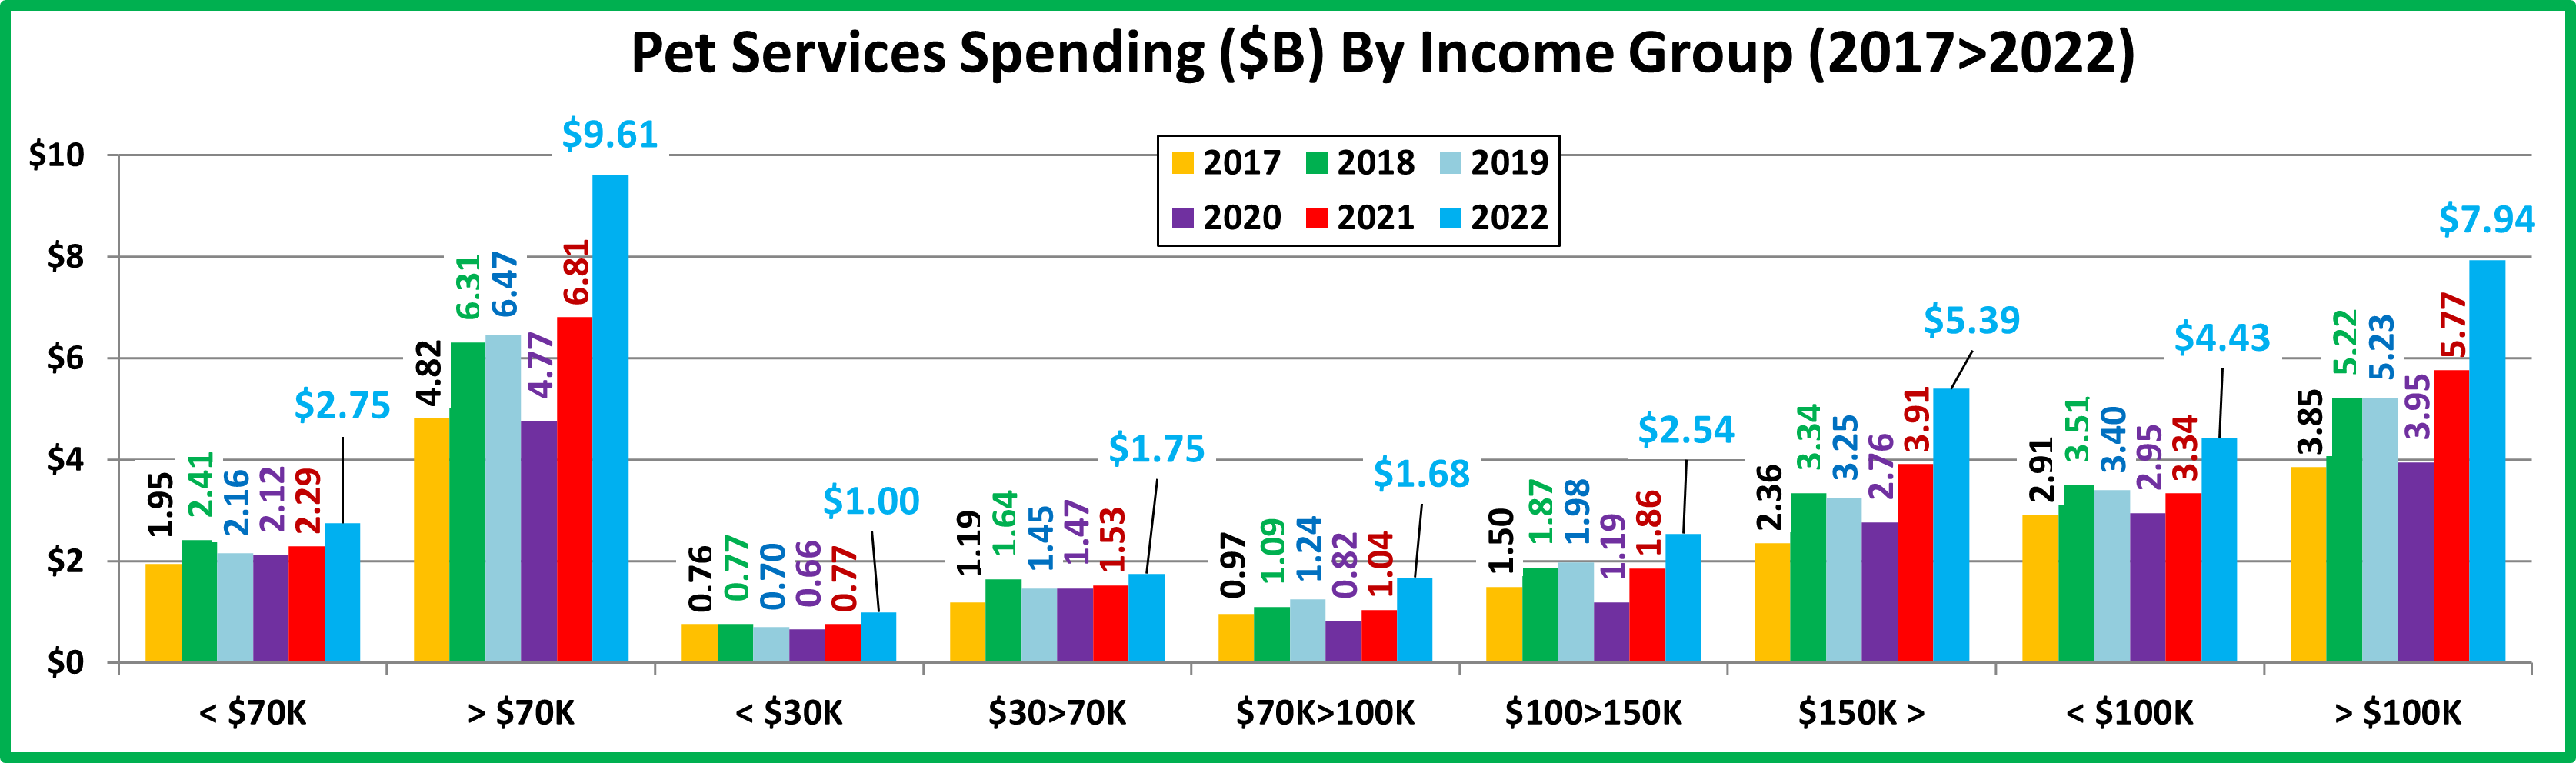
Like 2018 & 2021 all groups spent more in 2022. However, the biggest lifts came from higher incomes. The <$70K groups had smaller $ increases but were up double digits in percentage growth. The 2022 50/50 dividing line in $ for Services was $134K. That is up minimally from $133K last year but it is still by far the highest of any segment. It is readily apparent that income is overwhelmingly the primary driver in Pet Services spending.
- <30K (23.8% of CU’s) – $31.28 per CU (+39.2%) – $1.00B, Up $0.23B (+30.3%) – This segment is shrinking and money is tight, so Services spending is less of an option. However, many chose it in 2022 as spending grew 30% to $1B.
- $30>70K (28.9% of CU’s); $45.15 per CU (+17.2%); $1.75B, Up $0.22B (+14.6%) – In 2020, they had the only increase and finished 2nd in $. In 2022 they are down to 3rd but they are the only group to spend more in 2020, 2021 & 2022.
- $70>100K (14.1% of CU’s) – $88.53 per CU (+68.3%) – $1.68B, Up $0.63B (+60.9%) – The spending of this middle income group slowly but consistently grew 2016>19. Then it plummeted in 2020, even falling below 2016. They rebounded somewhat in 2021 but then spending took off in 2022, +60.9%, the highest % lift of any group.
- $100>150K (15.5% of CU’s) – $122.47 per CU (+25.1%) – $2.54B, Up $0.69B (+37.1%) – They had consistent growth from 2016>19. In 2020 they had the biggest drop, -40%. They came back strong in 2021 & 2022 to reach $2.5B.
- $150K> (17.7% of CU’s) – $227.73 per CU (+22.8%) – $5.39B, Up $1.49B (+38.0%) – They moved steadily down after peaking in 2018. Then Spending took off in 21/22. Their CU Services spending is now 2.5 times the national average.
Now, let’s look at spending by Age Group.
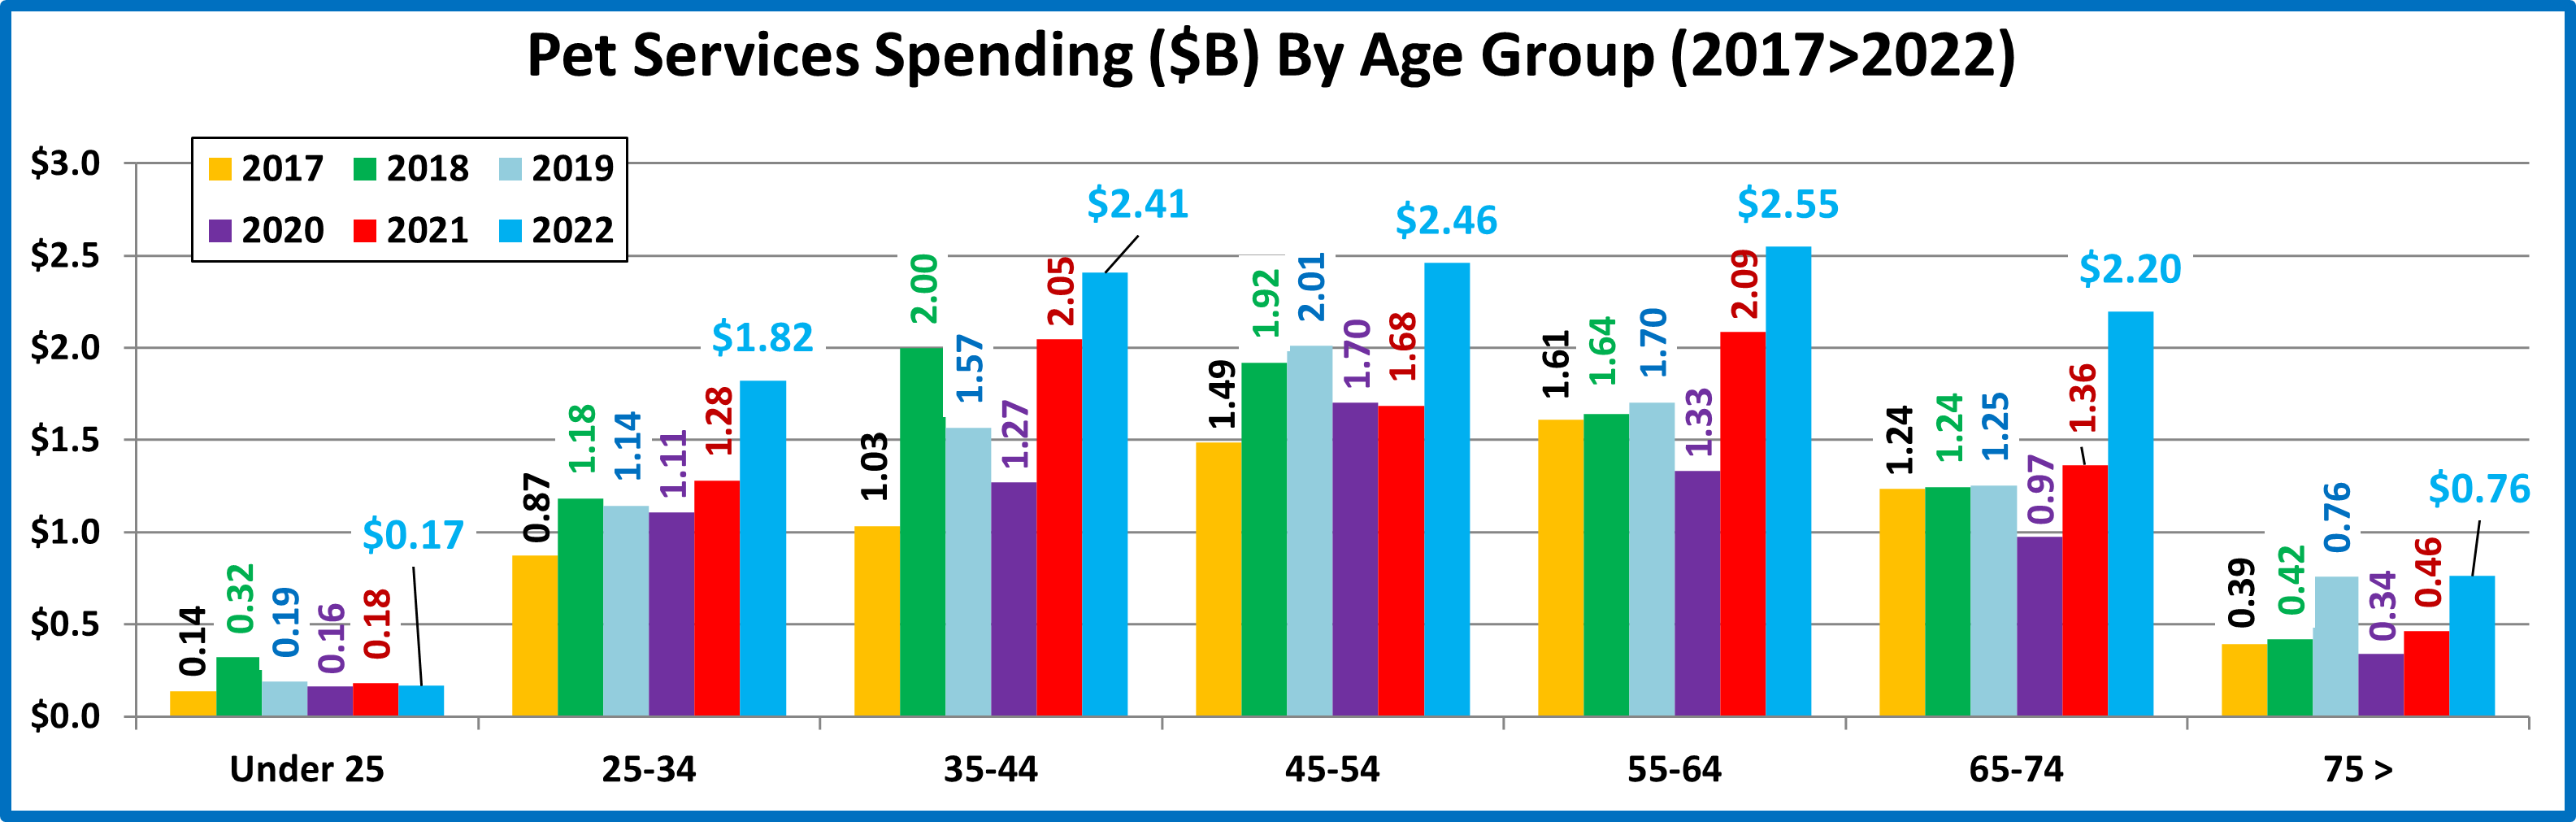
All age groups but <25 spent more on Services in 2022. The biggest lifts came from 65>74 & 45>54. 55>64 held onto the top spot, but you can see that spending share has become more balanced from 35 to 64. Here are the specifics:
- 75> (11.4% of CU’s) – $49.91 per CU (+57.1%) – $0.76B – Up $0.30B (+64.9%) They have a big need for pet services, but money is always an issue. In 2019 they had the biggest lift but gave it all back in 2020. In 2021 spending surged with a big increase in frequency. In 2022 $ were up 65% as 4.9% more CU’s spent 23.8% more $, 27.0% more often.
- 65>74 (16.2% of CU’s) – $101.08 per CU (+59.3%) – $2.20B – Up $0.83B (+61.1%). This group is very value conscious and growing in numbers. From 2017 to 2019 their spending was stable. In 2020 it fell 20%. In 2021 they came back strong but in 2022 they had the biggest $ increase as 1.2% more CU’s spent 48.7% more $, 7.1% more often.
- 55>64 (18.2% of CU’s) $104.30 per CU (+23.8%) – $2.55B – Up $0.46B (+22.2%) 2017>2019 they slowly increased Services spending. A big drop in frequency drove spending down in 2020 but they had a strong recovery and took the top spot in Pet Services $ in 2021. They held on in 2022 as 1.3% less CUs spent 6.9% more $, 15.8% more often.
- 45>54 (16.9% of CU’s)- $108.46 per CU (+43.5%) – $2.46B – Up $0.78B (+46.2%) This highest income group was #1 in Services $ in 2019 and held on in 2020 despite a 20% drop in frequency. In 2021 they increased frequency but had the only $ drop and fell to #3. In 2022 1.8% more CU’s spent 14.2% more $, 25.7% more often. They are now #2.
- 35>44 (17.0% of CU’s) – $105.54 per CU (+18.2%) – $2.41B – Up $0.36B (+17.6%) A $1B increase in 2018 pushed them to #1. In 2019 and 2020 spending fell. In 2021 they had the largest increase and moved up to #2 in Services $. In 2022 $ grew 17.6% as 0.5% less CU’s spent 7.9% more $, 8.4% more often. They fell to #3 but just 5.5% below #1
- 25>34 (15.6% of CU’s) – $87.27 per CU (+43.4%) – $1.82B – Up $0.54B (+42.6%) This group of Millennials “found” the Services segment in 2018. Their spending slowly fell in 2019 & 2020 but reached a record high in 2021 due solely to a big increase in frequency. In 2022 their $ surged +42.6% as 0.6% less CU’s spent 29.2% more $, 11.0% more often.
- <25 (4.7% of CU’s) – $26.49 per CU (-3.5%) – $0.17B – Down $0.02B (-8.4%) After 2018 spending fell and stabilized. In 2022 they had the only drop in spending. It was small as 5.1% less CU’s spent 19.8% less $, 20.3% more often.
In 2020, 62% of the $1.7B decrease in Services $ came from the 55> groups. In 2021, only 45>54 yr-olds spent less and the biggest increase was from the 35>44 group. In 2022, only <25 spent less. 65>74 & 45>54 had the biggest lifts. However, Services spending became more balanced as all CUs from 35>74 spent 10>18% more than the average CU.
Finally, here are some key demographic “movers” that drove the big lift in Pet Services Spending in 2022. The segments that are outlined in black “flipped” from 1st to last or vice versa from 2021. A red outline stayed the same.
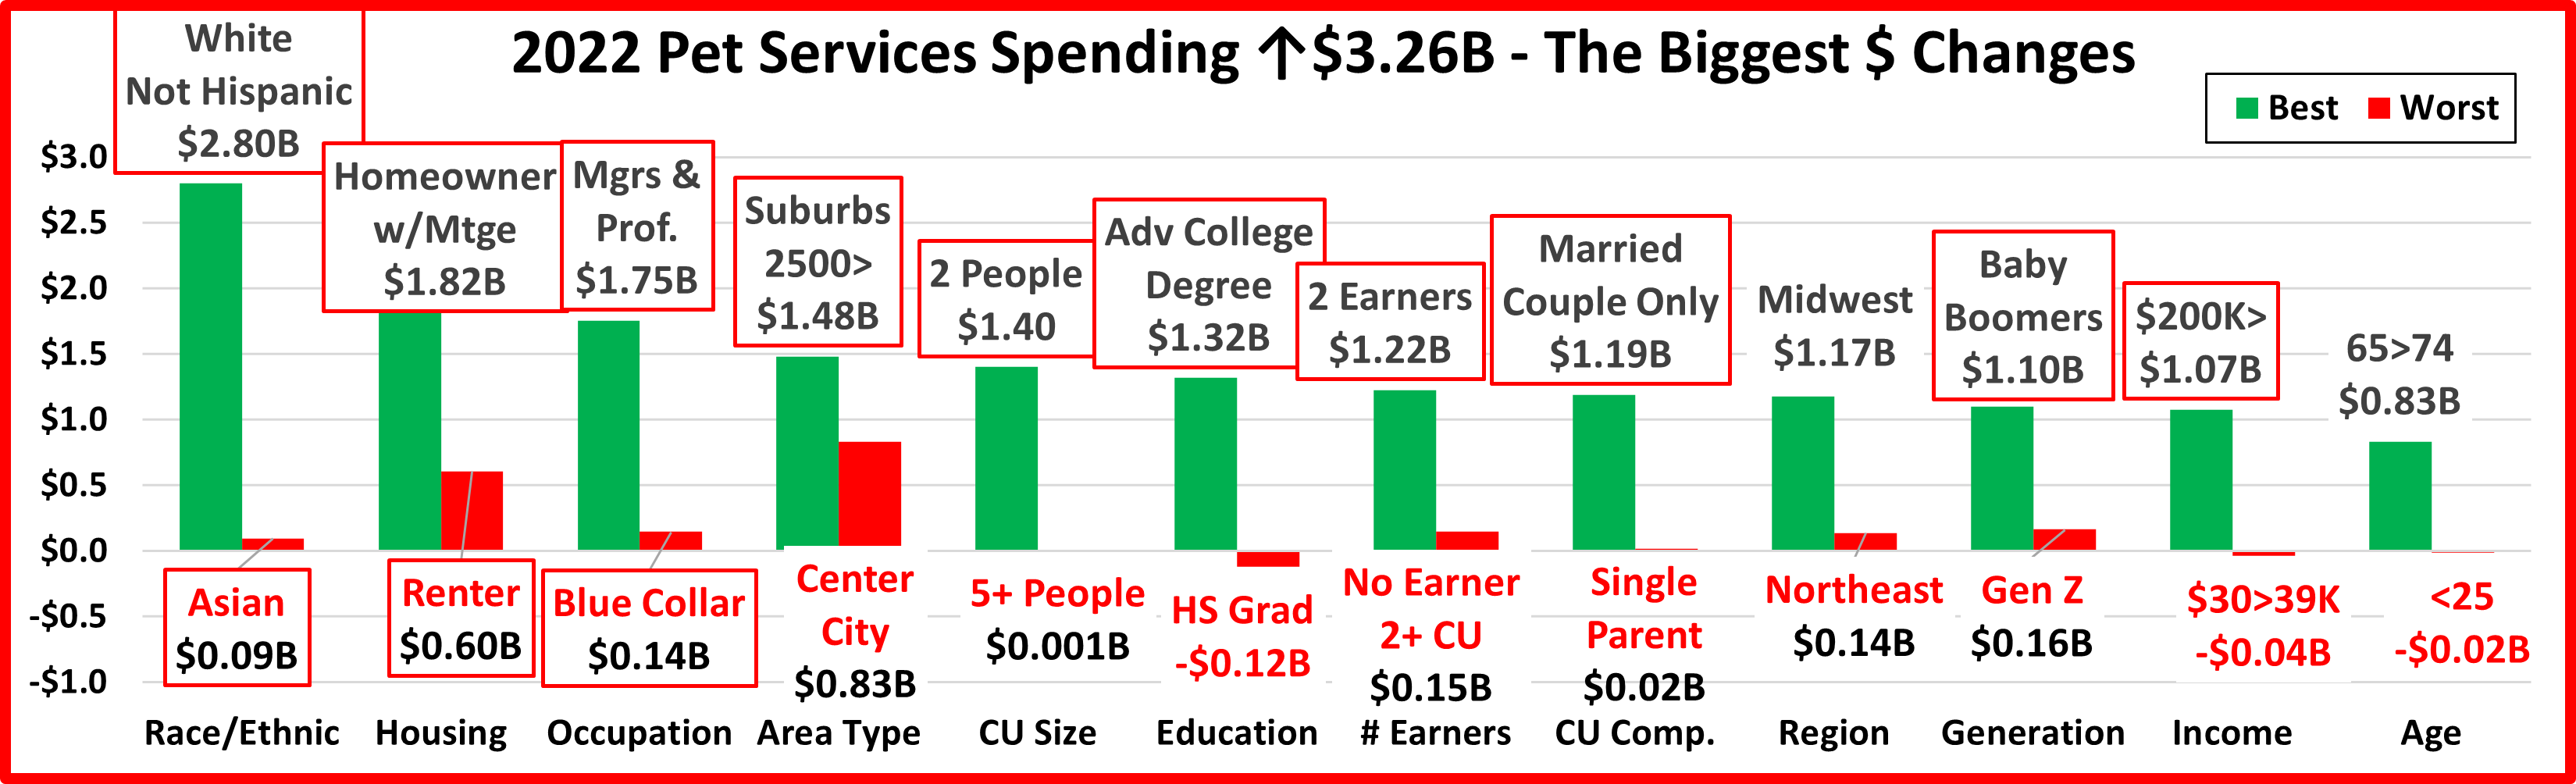
You see the stability in 2022 as 13 segments held their position and there were no flips. In all of our years of analysis, we have never seen this level of stability in any industry segment. Also, 9 categories had no segments that spent less on Services. In fact, 89 of 96 segments (93%) spent more on Services. This beat the previous best of 90% in 2021 and was a big change from 2020 when 79% spent less. In fact, only 2 segments spent less in 2022 than in 2020 – $30>39K & HS Grads and the drop by $30>39K was solely due to significantly fewer CUs. The recovery has been strong and truly widespread.
You see from the graph that the winners’ changes were all substantially larger than the losers’. This speaks to the strength and widespread nature of the lift in $ in the segments. We should also note that regardless of Race/Ethnicity, housing arrangements, the number of people or makeup of your household, your occupation or work status, the region of the country or type of area that you lived in, you spent more on Pet Services. That’s a pretty all-encompassing lift.
10 of the winners held their spot. Pet Services are a regular part of their Pet Parenting, and its importance continues to grow. The winners also demonstrate the importance of income to Services. While this segment has become more demographically widespread, higher incomes dominate. 8 of the 12 winners are either 1st or 2nd in income in their categories. The only winner that is bit of a surprise is 65>74 yr olds. High need, but low income – But now all Boomers.
Almost all of the losers are not unexpected. Once again, if we look at income, 8 of 12 are at or near the bottom in income in their category. 3 are definitely not – Asians & the Northeast have the highest income in their category and 5+ CUs are 2nd. Asians are not a surprise loser. Apparently, cultural differences cause them to spend less on their Pets than other Racial/Ethnic groups. Center City has the lowest income but is still somewhat of a surprise. Services spending tends to skew towards more populated areas. They also “lost” despite a 27.4% increase in $.
With 93% of demographic segments spending more on Services from 2021 and 99% from 2020, the recovery was strong and almost universal. There are no truly unique patterns, but one trend should be noted. Income continues to be the most important factor in Services spending. The 50/50 income dividing line in Services spending is now up to $134,000. That is 43% more than the average CU income and 80% more than the median income. $134K> is 23% of all CUs but accounts for 50% of Services $ and 52% of the $3.26B lift from 2021, but 60% of the $5.5B increase from 2020.
Overview – After the huge lift in 2018, Services spending plateaued in 2019. That changed with the pandemic in 2020. Like many retail services segments, Pet Services outlets were deemed nonessential and subject to restrictions. This resulted in a radically reduced frequency of visits and was the biggest reason behind the 20% drop in spending.
2021 brought a strong recovery with the biggest increase in history. The segments that were hit the hardest by the pandemic generally had the strongest recovery. However, the recovery had a widespread demographic reach. In 2022 the “recovery” accelerated with a new record increase of $3.26B to $12.36. The lift was largely driven by the same groups as 2021 but 93% of all segments spent more. With the humanization of our pets, Pet Services have become more important to Pet Parents and the Pet Industry. For Pet Stores, offering Services provides a key point of differentiation and a reason to shop in their store. You can’t get your dog groomed on the internet. Like other segments, Services had strong inflation in 2022. This had a minimal impact on this segment as both transaction size and frequency increased.

