2022 U.S. TOTAL PET SPENDING $102.71B…Up ↑$2.73B
In 2022 Total Pet Spending in the U.S. was $102.71B, a $2.73B (2.7%) increase from 2021. Spending fell in Veterinary and Supplies as the record 2021 binges were not repeated. However, Pet Food returned to a more normal pattern with a 12.5% increase and Services spending continued to surge with another record lift. Together this produced a small increase in Total Pet $. Another factor also affected spending in 2022 – high inflation in all segments.
- A $4.29B (+12.5%) increase in Food
- A $1.86B (-7.8%) decrease in Supplies
- A $2.95B (-9.0%) decrease in Veterinary
- A $3.26B (+35.8%) increase in Services
Let’s see how these numbers blend together at the household (CU) level. Weekly, 25.3 million CU’s (1/5) spent $ on their Pets – food, supplies, services, veterinary or any combination – up from 24.4MM in 2021 but still below 27.1MM in 2019.
In 2022, the average U.S. CU (pet & non-pet) spent a total of $766.20 on their Pets. This was a +2.3% increase from the $748.93 spent in 2021. However, this doesn’t “add up” to a 2.7% increase in Total Pet Spending. With additional data provided from the US BLS, here is what happened.
- 0.4% more CU’s
- Spent 0.5% less $
- 2.8% more often
If 68% of U.S. CU’s are pet parents, then their annual CU Total Pet Spending was $1126.76. Now, let’s look at the recent history of Total Pet Spending. The rolling chart below provides a good overview. (Note: All numbers in this report come from or are calculated by using data from the US BLS Consumer Expenditure Surveys – The 2016>2022 Totals include Veterinary Numbers from the Interview survey, rather than the Diary survey due to high variation)
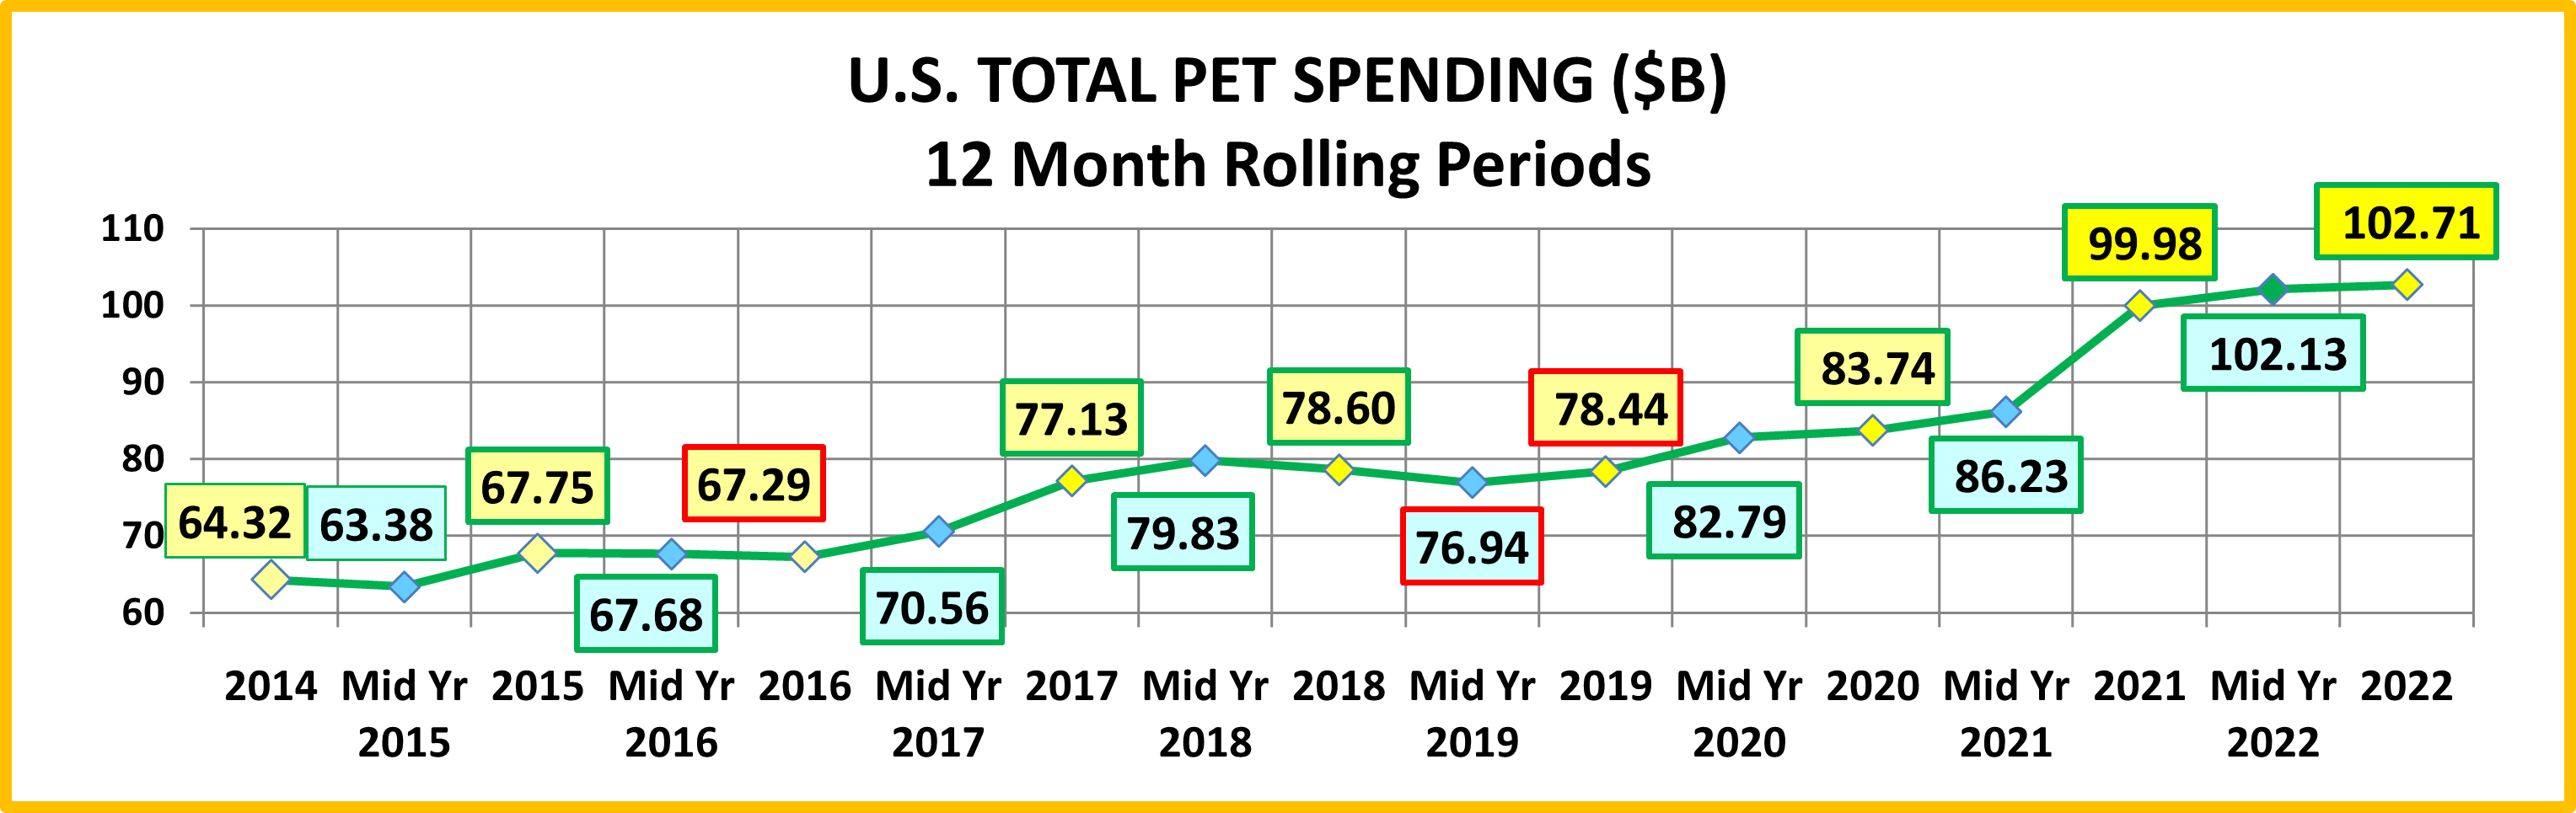
- In 2014-15, the Super Premium Food upgrade began, with the biggest lift coming in 2015.
- In 2016, Pet Parents value shopped for super premium foods. They spent more in other segments, but spending fell slightly.
- In 2017, spending took off in all but Services, especially in the 2nd half. Consumers found more $ for their Pets.
- In 2018, a spectacular lift in Services overcame the FDA issue in Food, tariffs on Supplies and inflation in Veterinary.
- In 2019, a bounce back in Food and small lift in Veterinary couldn’t overcome the drop in Supplies from “tarifflation”.
- In 2020, consumers focused on necessities, Food & Veterinary (+$8.7B) while Services & Supplies suffered (-$3.4B).
- In 2021, there was no Food binge but in all other segments consumers made up for all the lost ground…and more!
- In 2022, big lifts in Food & Services overcame drops in Supplies & Veterinary.
- The 2022 lift was the 3rd in a row, breaking a pattern since 2010 – 2 years of increases followed by a small decrease.
Now we’ll look at some Demographics. First, 2022 Total Pet Spending by Income Group

Only the $30>70K & $100>149K income groups spent more but all of the big groups, <$70> & <$100k> had increases.
Nationally: · Total Pet: ↑$2.73B · Food: ↑$4.29B · Supplies: ↓$1.86B · Services: ↑$3.26B · Veterinary: ↓$2.95B
- < $70K – (52.7% of U.S. CUs); CU Pet Spending: $472.48, +9.9%; Total $: $33.35B, ↑$1.59B (+5.0%) from…
- Food ↑$2.60B Supplies ↓$1.16B Services ↑$0.46B Vet ↓$0.30B
- Money matters a lot to this group. In the pandemic they focused on Pet needs. In 2021 they spent less on food but more in all other segments. In 2022, their segment spending matched the national pattern and their $ grew 5.0%
- >$70K – (47.3% of U.S. CUs); CU Pet Spending: $1093.30, -4.4%; Total $: $69.36B, ↑$1.15B (+1.7%) from…
- Food ↑$1.69B Supplies ↓$0.70B Services ↑$2.81B Vet ↓$2.65B
- This group continues to grow in size, up 6.0% in 2022, but they only produced 42% of the spending increase. Only $100>150K spent more. They also matched the national pattern but accounted for 90% of the drop in Veterinary.
- < $30K – (23.8% of U.S. CUs); CU Pet Spending: $349.31, +4.0%; Total $: $10.84B, ↓$0.41B (-3.7%) from…
- Food ↑$0.08B Supplies ↓$0.59B Services ↑$0.23B Vet ↓$0.13B
- This lowest income group still has relatively stable spending but they remain committed to their pets. They also only spent less in Supplies & Veterinary but their lift in Food was so small that their Total $ fell -3.7%.
- $30>$70K – (28.9% of CUs); CU Pet Spending: $569.03, +11.8%; Total $: $22.51B, ↑$2.00B (+9.8%) from…
- Food ↑$2.52B Supplies ↓$0.57B Services ↑$0.22B Vet ↓$0.17B
- Another National Pattern match. However, they had the biggest lncrease in Food and the 2nd largest in Total Pet.
- $70>$99K – (14.1% of CUs); CU Pet Spending: $766.36, -3.6%; Tot $: $14.58B, ↓$1.16B (-7.3%) from…
- Food ↓$0.40B Supplies ↑$0.08B Services ↑$0.63B Vet ↓$1.47B
- This mid-income group is very price sensitive. They had the biggest drop in Veterinary and the only drop in Food.
- $100K>$149K– (15.5% of CUs); CU Pet Spend: $1013.24, +3.6%; Tot $: $20.99B, ↑$2.49B (+13.4%) from…
- Food ↑$1.25B Supplies ↑$0.61B Services ↑$0.69B Vet ↓$0.06B
- After years of stability they became reactive and they have the money to take action. In 2020 they led the way in the Food binge. In 2021 they had a huge drop in Food $ but big increases in the other segments. In 2022 they got more “on track”. They had a small drop in Veterinary but big increases in the other segments. This generated the biggest increase in Total Pet $ for any income segment.
- $150K> – (17.7% of CUs); CU Pet Spending: $1424.79, -12.1%; Total $: $33.79B, ↓$0.18B (-0.5%) from…
- Food ↑$0.83B Supplies ↓$1.39B Services ↑$1.49B Vet ↓$1.11B
- This group consists of 2 segments, $150>199K and $200K>. In 2021 both groups had double digit increases in all segments and they generated 87% of the Total Industry’s Record Increase. 2022 was different. The $150>199K group had a small increase in Food and big lifts in Supplies & Services but were down -$1.5B in Veterinary. Net: +$0.23B. The $200K> group had a huge increae in Services and strong lifts in Food & Veterinary but a -$2.68B drop in Supplies. Net: -$0.41B. High incomes can have different behaviors but together they do 32.9% of Pet $.
- < $100K – (66.8% of CUs); CU Pet Spending: $534.79, +5.4%; Total $: $47.93B, ↑$0.43B (+0.9%) from…
- Food ↑$2.20B Supplies ↓$1.08B Services ↑$1.09B Vet ↓$1.77B
- A spending sandwich, with the “meat” in the middle <40K: -$0.54B; $40>69K: +$2.13B; $70>99K: -$1.16B
- >$100K – (33.2% of CUs); CU Pet Spending: $1232.94, -6.3%; Total $: $54.78, ↑$2.30B (+4.4%) from…
- Food ↑$2.09B Supplies ↓$1.78B Services ↑$2.17B Vet ↓$1.18B
- The $100K> group exceeded 50% of Pet $ for the 1st time in 2020. Their lead is growing as they now do 53.3%.
Income Recap – The top 2 drivers in consumer spending behavior are value (quality + price) and convenience. That makes income very important in Pet Spending. We also often see motivation brought by new products. In 2020 we saw the results from perhaps the biggest human motivator – fear. This drove the binge buying of pet food. The huge lift from $100>149K helped push the 50/50 $ divide up to $103K, a huge change from $94K in 2019. 2021 brought a record lift and record spending in all segments but Food. This increase was driven by the $150K> income group and the 50/50 spending divide moved up to $107K. In 2022, Food & Services $ grew while Vet & Supplies fell. This produced a small, 2.7% increase in Total Pet $. However, a big lift by the $100>149K segment pushed the spending divide up slightly to $108K. Income continues to grow in importance in Total Pet Spending.
Next let’s look at 2022 Total Pet Spending by Age Group
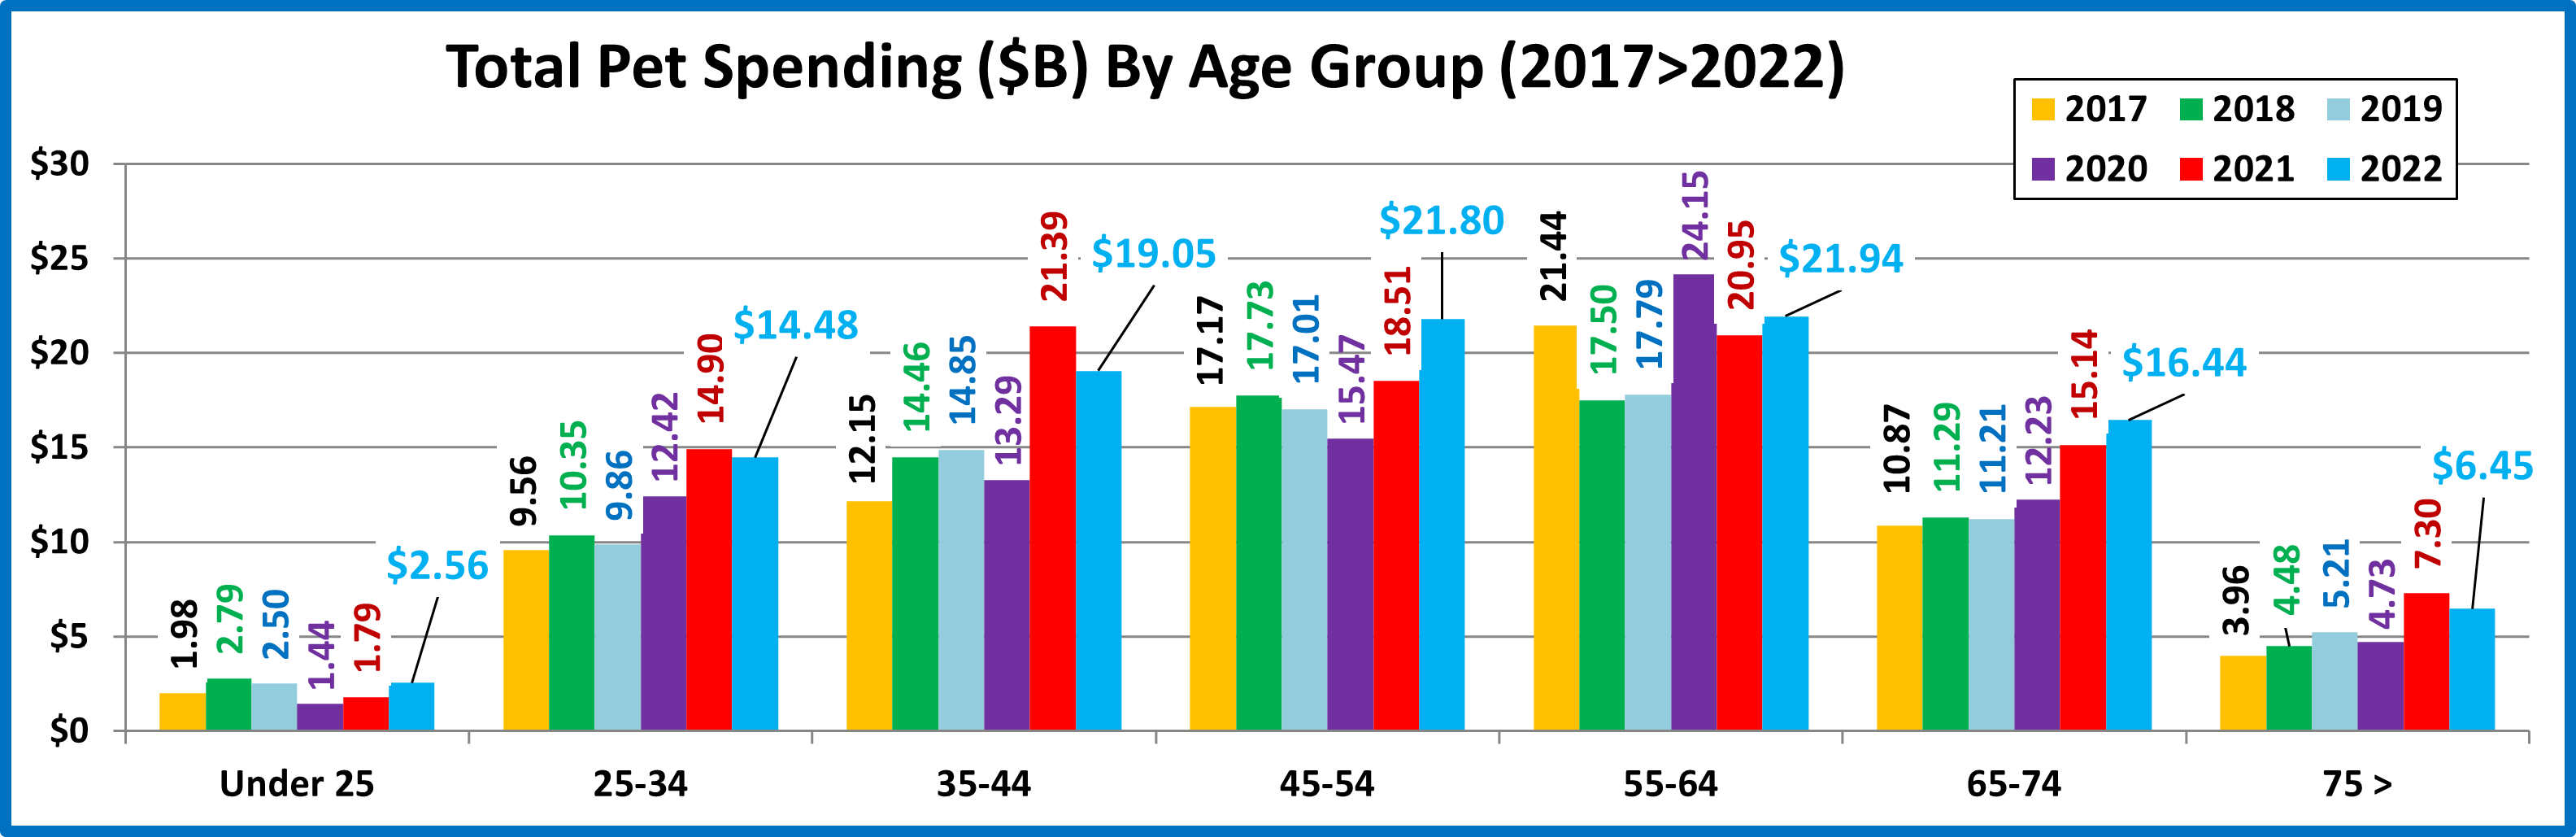
The 25>44 and 75> yr-old groups spent less while all others spent more. The 45>54 group had the biggest increase.
Nationally: · Total Pet: ↑$2.73B · Food: ↑$4.29B · Supplies: ↓$1.86B · Services: ↑$3.26B · Veterinary: ↓$2.95B
- <25 – (4.7% of U.S. CUs); CU Pet Spending: $386.78, +43.4%; Total $: $2.56B, ↑$0.77B (+42.8%) from…
- Food ↑$0.72B Supplies ↑$0.11B Services ↓$0.02B Vet ↓$0.04B
- Many consolidated into bigger CUs and some got married but their Pets were included. Plus, more pets were added which generated a huge lift in Food. Overall, 5.1% fewer CUs spent 55.9% more $, 3.6% less often.
- 25-34 – (15.6% of U.S. CUs); CU Pet Spending: $687.59, -1.9%; Total $: $14.48B, ↓$0.42B (-2.8%) from…
- Food ↓$0.11B Supplies ↓$0.06B Services ↑$0.54B Vet ↓$0.80B
- In 2021 these Millennials had a 20% increase with a big lift in all segments. In 2022 they dialed back their spending in all but Services, with a big drop in Veterinary as 0.6% fewer CUs spent 3.6% less $, but 1.4% more often.
- 35-44 – (17.0% of CUs); CU Pet Spending: $822.61, -12.3%; Total $: $19.05B, ↓$2.34B (-10.9%) from…
-
- Food ↑$1.56B Supplies ↓$2.81B Services ↑$0.36B Vet ↓$1.45B
- They have the largest families and are building their careers, so they are very sensitive in times of change. In 2021 they spent more in all segments and became #1 in Total Pet $. In 2022 they matched the national pattern with big changes in every segment. 0.5% fewer CUs spent 12.3% less $, but 2.0% more often. They fell to #3 in Pet spending.
- 45-54 – (16.9% of U.S. CUs); CU Pet Spending: $967.31, +16.8%; Total $: $21.80B, ↑$3.29B (+17.8%) from…
- Food ↑$1.29B Supplies ↑$0.42B Services ↑$0.78B Vet ↑$0.80B
- They have the highest income and were #1 in Pet Spending in 2018. In 2019 & 2020 their spending and rank fell. In 2021, their spending started to grow. In 2022 they were the only group with an increase in all segments. They are #1 in CU spending but 2nd in $ because of fewer CUs. 1.8% more CUs spent 12.7% more $, 2.6% more often.
- 55-64 – (18.2% of U.S. CUs); CU Pet Spending: $905.56, +6.6%; Total $: $21.94B, ↑$0.99B (+4.7%) from…
- Food ↑$1.86B Supplies ↑$0.18B Services ↑$0.46B Vet ↓$1.51B
- 80% are still younger Baby Boomers and they are very reactive. They were the drivers behind the 2020 binge and 2021 drop in Pet Food. Except for a big rollback in Veterinary their spending returned to a more normal pattern. 1.3% fewer CUs spent 3.0% less $, but 9.3% more often and they returned to the top in Total Pet $.
- 65-74 – (16.2% of U.S. CUs); CU Pet Spending: $765.42, +7.6%; Total $: $16.44B, ↑$1.30B (+8.6%) from…
- Food ↑$0.51B Supplies ↑$0.09B Services ↑$0.83B Vet ↓$0.14B
- This group is growing and are all Baby Boomers. They are careful with their money, but their commitment to their pets is very apparent. They are the only group with a spending increase every year from 2020>2022. In 2022 they increased spending in all but Veterinary as 1.2% more CUs spent 5.3% more $, 1.9% more often
- 75> – (11.4% of U.S. CUs); CU Pet Spending: $429.29, -14.9%; Total $: $6.45B, ↓$0.84B (-11.5%) from…
- Food ↓$1.53B Supplies ↑$0.21B Services ↑$0.30B Vet ↑$0.18B
- Pet parenting is more difficult, and money is tight for these oldest Pet Parents, but their commitment is still there. In 2021 they had increases in all segments. In 2022, only Food spending fell, and the drop was substantial. In response to skyrocketing inflation many CUs may have even downgraded their Pet Food. 4.9% more CUs spent 11.4% less $, 4.9% less often.
Age Group Recap: In 2022 Total Pet Spending definitely skewed away from the younger groups to the older 45>74 groups. However, it was still driven by the 3 highest income groups from 35 to 64.
Next, we’ll take a look at some other key demographic “movers” in 2022 Total Pet Spending. The segments that are outlined in black “flipped” from 1st to last or vice versa from 2021. The red outline stayed the same.
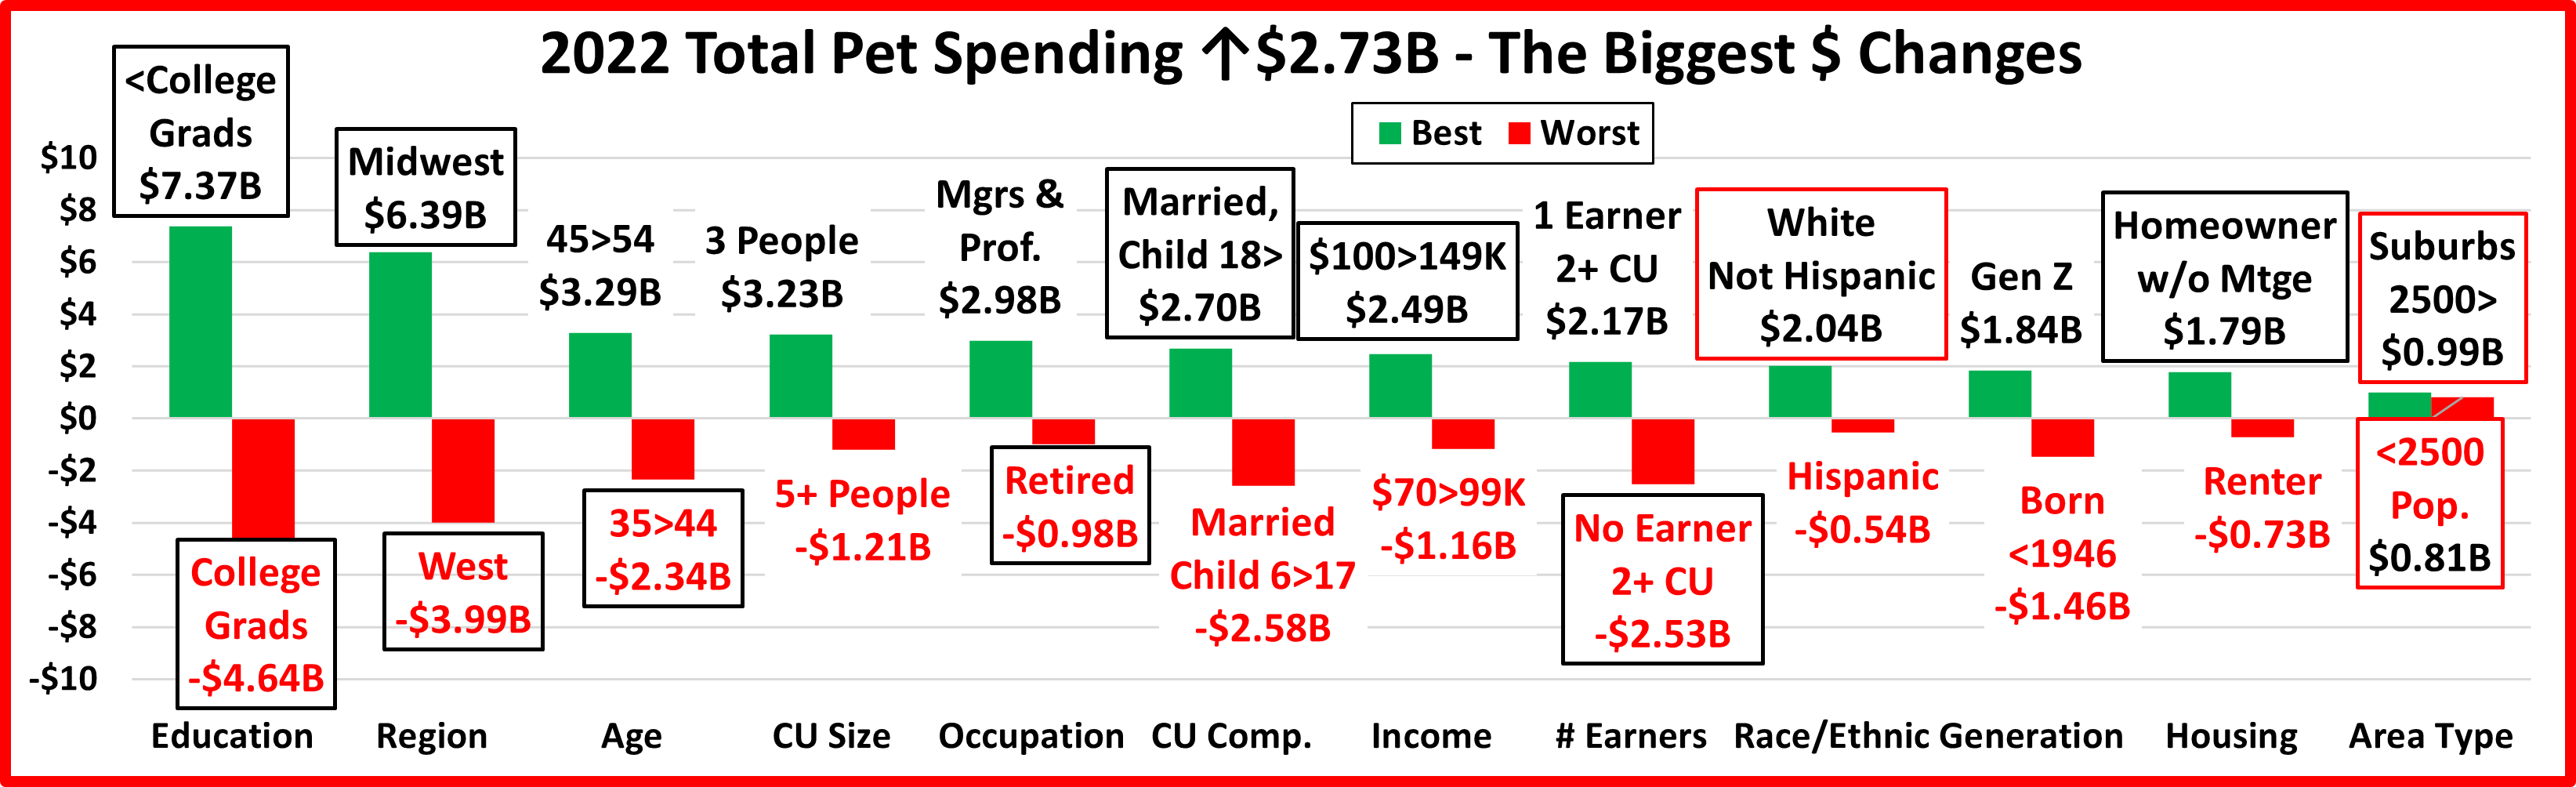
In 2022, 69 of 96 Demographic Segments (72%) spent more on their Pets, a big drop from 83% in 2021. Although they were different, both years had 1 category where all segments spent more. However, there was less turmoil in 2022 as 3 segments held their spot and only 10 of the 24 segments flipped from 1st to last or vice versa. In 2021 there were 16 flips. In 2022 the flips were evenly divided between 1st and last. Last year most were to last because of big drops in Food $ from the 2020 binge. In 2022 most of the biggest lifts weren’t significantly larger than the biggest drops, an indication of more balanced spending. We should also note the stability in the Area category. Both the winner and loser held their position and Rural “lost” with an $0.81B increase, less than 20% below the winner. As noted earlier, both 2021 & 2022 had 1 category in which all segments spent more – In 2022 it was Area Type; In 2021 it was # of Earners.
Let’s look at some specifics.
7 of the winners are often on Top and all of them have higher incomes.
- 45>54 • Mgrs & Prof. • Married, Child 18> • $100>149K • Suburbs 2500> • White, Not Hisp. • Midwest
3 winners are surprising:
- < College Grads • Gen Z • Homeowners w/o Mtge
Among the losers, 5 often find themselves in this position:
- Retirees • No Earner, 2+ CUs •Hispanics •Born <1946 •Renters
All of the “usual” losers have low incomes. There were 4 surprises:
- College Grads • West • 35>44 yr-olds • <2500 Population, aka “Rural” (despite a $0.8B spending increase)
All but Rural have a high income. However, Rural is a big Pet spender, with over $1000 in annual CU pet spending.
Recap: After a slight downturn in 2019, Pet Spending turned up in 2020, primarily due to the pandemic binge buying of Pet Food in the 1st half of the year. The Food binge ended in 2021 and Food $ fell as Pets “ate up” the overstock. However, it was replaced by binges in the other segments. Pet Parents caught up with all the Supplies purchases that they had postponed due to the pandemic and spending grew by 57%. COVID also caused them to focus on the health of their Pet Children so Veterinary also had a record increase. Services were hit hard by pandemic restrictions and closures, but they came back strong, $ were up 32%. Together, this produced a record $16.23B increase in Pet Spending. 2022 brought a new challenge – radically high inflation. Supplies and Veterinary had drops in spending as their 2021 binge couldn’t be repeated. Food spending bounced back with a 12.5% increase. However, the $4.29B Food lift didn’t make up for the combined $4.81B drop in Veterinary & Supplies. Without the record $3.26B increase in Services, Pet spending would have been down -$0.53B in 2022. This mixture produced a small $2.73B (+2.7%) lift in 2022. However, if you consider 8.9% Petflation in 2022, the amount of Pet Products & Services sold in 2022 was really down 5.7%. Spending skewed towards older groups but became more balanced among the 3 groups with the highest incomes. The 50/50 spending divide moved up a little in Total Pet. However, the impact of inflation was largely hidden. Petflation started slowing in July 23, but in September the 2023 YTD rate was still +9.1% vs 2022 and +17.9% vs 2021. We’ll see what happens.

