2022 U.S. PET FOOD SPENDING $38.69B…Up ↑$4.29B
After the record increase in 2021, Total Pet spending grew slightly to $102.71B, up $2.73B (+2.7%). Pet Food spending had double digit growth while Veterinary and Supplies $ fell after their record increases in 2021. The big news was Services. They had a record increase of $3.26B and 2 consecutive years of 30+% growth. However, a new factor affected 2022 Pet spending – strong inflation in every segment. Here are the 2022 spending specifics
- Pet Food – $38.69B; Up $4.29B (+12.5%)
- Pets & Supplies – $21.94B; Down $1.86B (-7.8%)
- Veterinary – $29.71B; Down $2.95B (-9.0%)
- Pet Services – $12.36B; Up $3.26B (+35.8%)
The industry truly is a “sum” of its integral segments, and each segment has very specific and often very different buying behavior from the many consumer demographic segments. For this reason, we’re going to analyze each of the industry segments first. This will put the final analysis of Total Pet’s 2022 Spending into better perspective. Note: The numbers in this report come from or are calculated by using data from the current and past US BLS Consumer Expenditure Surveys. In 2022, this was gathered by the U.S. Census Bureau from over 42,000 interviews and spending diaries. The final data was then compiled and published by the US BLS. All inflation numbers are also provided by the US BLS.
We will start with the largest Segment, Pet Food (and Treats). In 2022 Pet Food Spending totaled $38.69B in the U.S., a $4.29B (+12.5%) increase from 2021. Pet Food inflation was 10.2% in 2022 so 82% of the lift came from higher prices. In earlier research we discovered a distinct, long-term pattern in Pet Food Spending. In 2018 we broke the pattern due to outside influences – 1st the FDA warning, then with COVID in 2020. Here is Pet Food Spending since 1997 in full Retail Dollars and adjusted for inflation. Blue highlight indicates plateau year and a red outline is a spending drop.
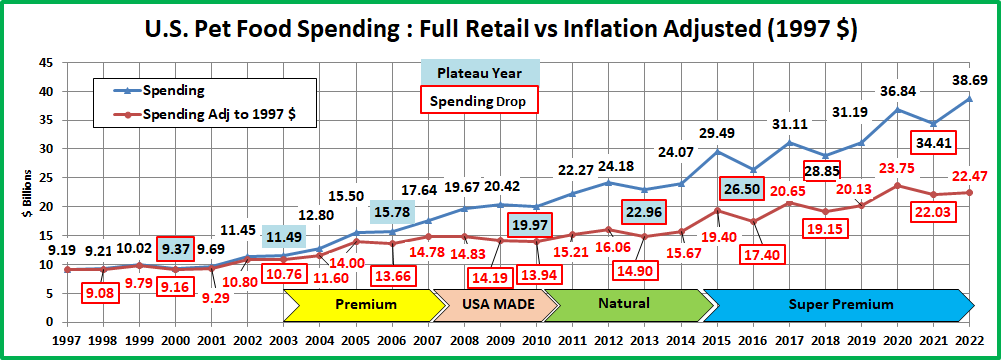
The pattern began in 1997. Retail Pet Food Spending increases for 2 consecutive years then reaches a plateau year or even drops. There was a notable exception in the period from 2006 to 2010. During this time, there were two traumas which directly impacted the Pet Food Retail market. The first was the Melamine recall, which resulted in radically increased prices as consumers insisted on made in USA products with all USA ingredients. The second affected everyone – the great Recession in 2009. This was the first time that annual U.S. retail spending had declined since 1956. The net result was that the plateau period was extended to include both 2009 and 2010.
For 20 years, Pet Food was driven by short term trends. A new trend catches the consumers’ attention and grows …for 2 years. Then sales plateau or even drop…and move to the next “must have”. After 2014, the changes became bigger and the situation got more complex due to a number of factors starting with the move to high priced super premium foods, but including increased competition, especially from the internet, and behavioral changes, like increased value shopping. In 2018, outside influences came into prominence. The first was the FDA warning on Grain Free dog food. This caused many Pet Parents to back away from certain foods. When the warning was declared bogus, the Food segment began to recover. Then came COVID. Fear of possible shortages caused some groups to binge buy food. That ended and spending dipped in 2021. It turned up again in 2022. However, it may have been largely due to 10.2% inflation. Of note: Considering inflation, only 45% of the 97>22 growth is real. Now, let’s take a closer look at spending since 2014.
First, some specifics behind the $4.29B (+12.5%) increase to $38.69B. In 2022, the average U.S. Household spent a total of $288.75 on Pet Food. This was an +11.9% increase from the $258.09 spent in 2021, which doesn’t exactly “add up” to the +12.5% increase in total Food Spending. With additional data provided from the US BLS, here is what happened.
- 0.5% more U.S. CUs
- Spent 6.5% more $
- 5.1% more often
By the way, if 68% of U.S. CUs are pet parents then their annual Pet Food Spending is $424.63. Here’s a recent rolling history.
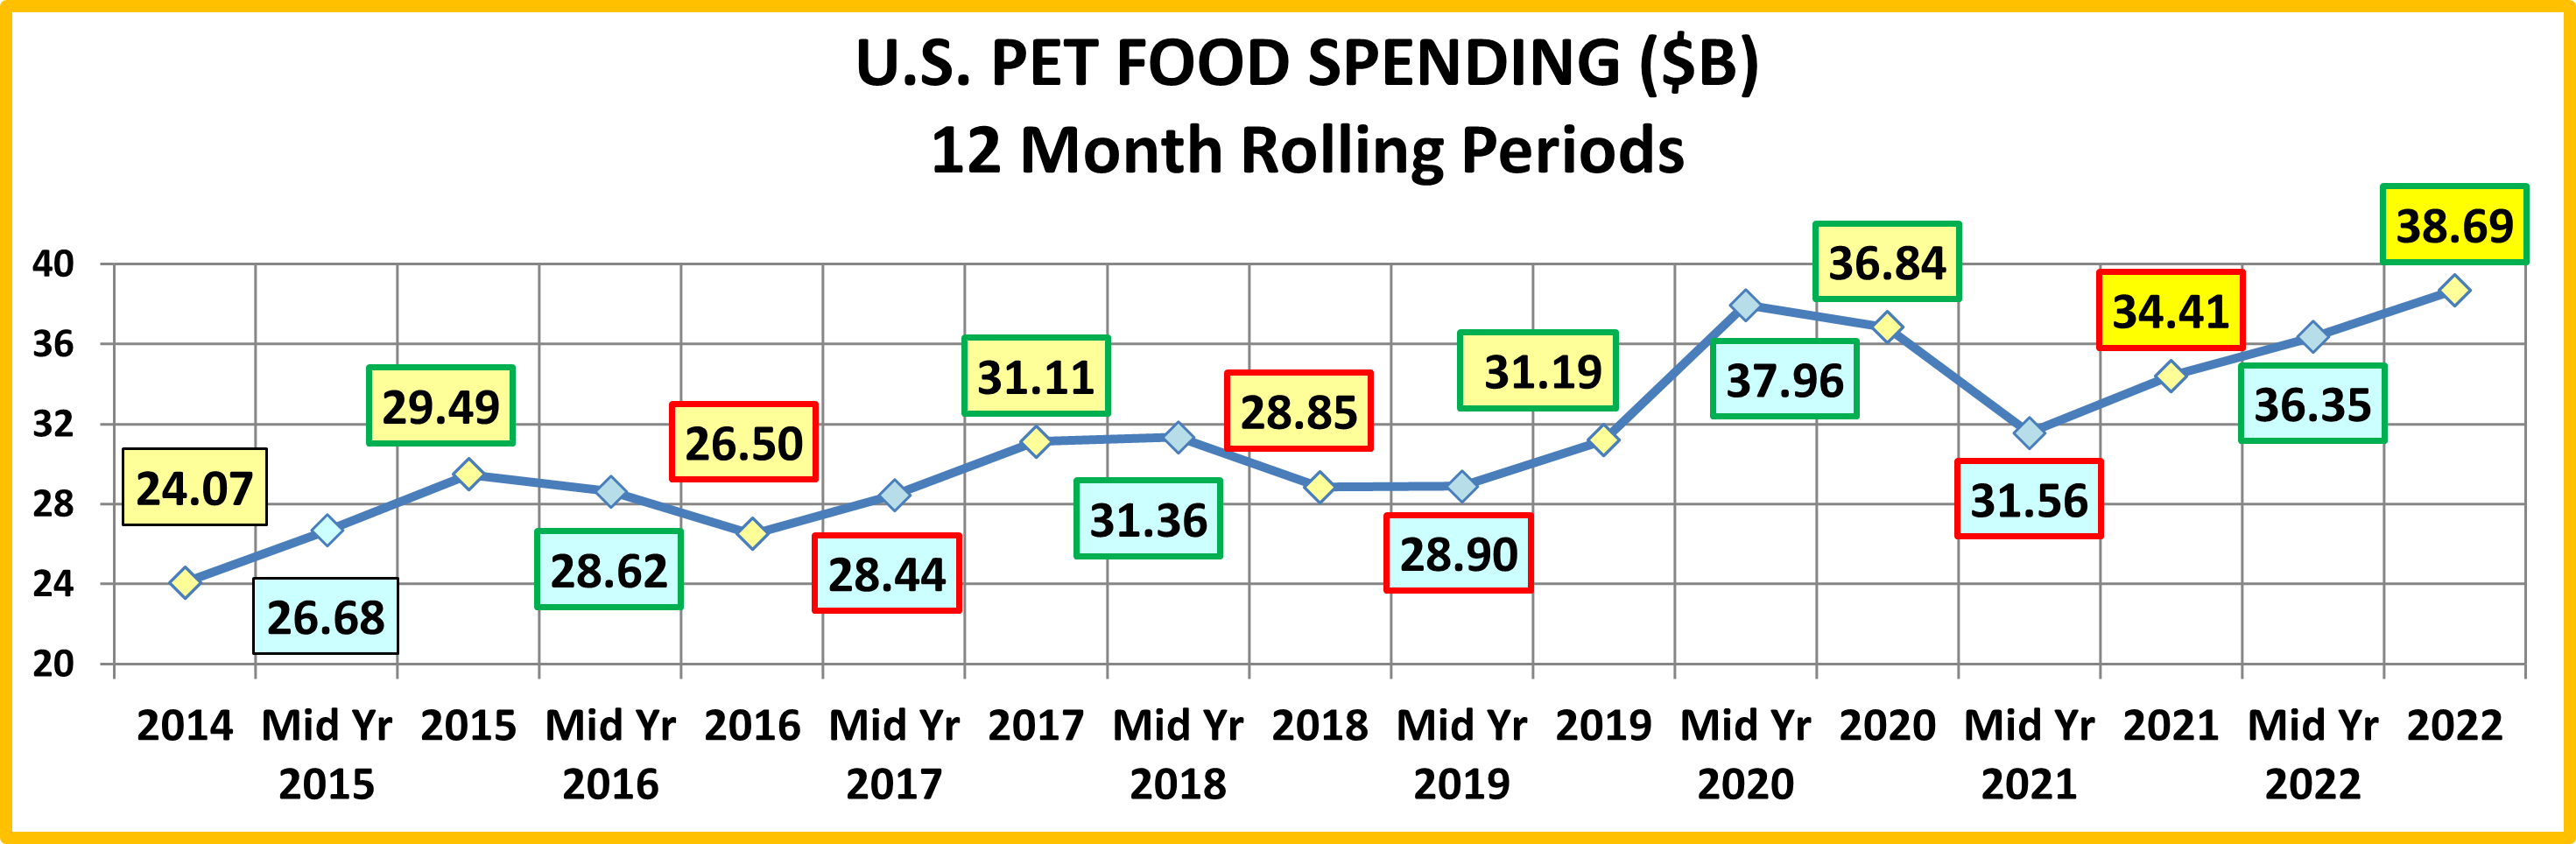
2014 marks the beginning of the Super Premium era. It began in the 2nd half of 2014 with the 25>34-year-old Millennials making the 1st move. In 2015 the Baby Boomers got on board in a big way, producing a $5.42B increase in spending, the biggest lift in history at the time. 2016 saw a spending change that was accelerated by the high prices of Super Premium Pet Foods. After consumers upgraded to a more expensive pet food, their #1 priority became, “Where can I buy it for less?” Value Shopping on the internet was a major contributing factor in the big spending drop in 2016.
2017 was an up year which should have been due to a “must have” trend. However, a closer look at the data showed that the $4B increase in Pet Food spending in 2017 came not from a new trend but from a deeper demographic penetration of Super Premium foods. Value shopping in a highly competitive market, especially on the internet, had made Super Premium pet foods more accessible to a broad swath of consumers.
Like Pet Food, human behavior has changed over the years in regard to our pets. In the 90’s, Pet Owners became Pet Parents. Then, after 2000 we began truly humanizing our pets, which is very accurately reflected in the evolution of Pet Food. We became more focused on fulfilling the health needs of our pets, beginning with the first move to premium foods in 2004. This radically increased after the Melamine scare in 2007. Now consumers read pet food labels, research ingredients and expect their pet foods to meet the same quality standards as the best human foods. This was very evident in 2018. It should have been a year of increased spending but the consumers’ reaction to the FDA grain free warning threw the pattern out the window. In 2019 the warning lost credibility. Pet Food spending stabilized in the 1st half of the year and then grew by $2.3B in the 2nd half. Some Pet Parents began to return to the topline Super Premium Foods while others opted for even more expensive varieties. Also, new groups got on board the Super Premium Express.
After the 2019 recovery came the pandemic of 2020. There is nothing more necessary to a Pet Parent than pet food. This spurred binge buying, especially in the 1st half of the year and drove the biggest annual spending increase in history. However, binge buying doesn’t increase usage and it causes an overstock in home supply. In 2021, Pets “ate down” the extra food so spending fell. Another factor was the ongoing strong search for value & convenience which continues to drive many consumers online. In 2022, Pet Food spending returned to a more normal pattern. There were 0.5% more CUs. They spent a little more and bought a little more frequently. Inflation was a big factor in the spending increase in transactions. The increase in frequency came from more regularly scheduled deliveries and in an effort to lower the transaction price due to skyrocketing inflation, some pet parents also downsized their purchases but bought more often.
The growth of Pet Food spending since 2014 reflects the rise of Super Premium but also another trend – the spectacular increase in the number and use of Pet Medications and Supplements, which are often produced in the form of treats. Together, the strength of Pet Food and these product subcategories reflect the Pet Parents’ absolute number 1 priority –
the health, wellbeing and safety of their Pet Children, which starts with the quality of their food.
Now let’s look at some specific 2022 Pet Food Spending Demographics. The first is income. Prior to 2014 it was less of a factor in Food spending. However, the move to Super Premium has brought it more to the forefront. In 2015 the spending of the over $70K group exceeded the <$70K for the first time. In 2022, <$70K had a bigger lift but was still only 65% of the $70K> spending. The $30>70K group had the biggest increase and $70>100K had the only decrease. In 2015, the 50/50 divide on Pet Food spending was about $70K. By 2020, it was up to $107K, breaking the $100K barrier for the first time. In 2021 it fell to $92K and is down to $91K in 2022. That’s about 3% less than the average CU income but 22% more than the median income. Higher income is still important in Pet Food spending. Although all incomes over $40K have 100+% performance (Share of $/Share of CUs) the $150K> group is by far the best at 159%. The chart below shows annual spending for major income groups from 2017>2022. This should put the 2022 numbers into better perspective.
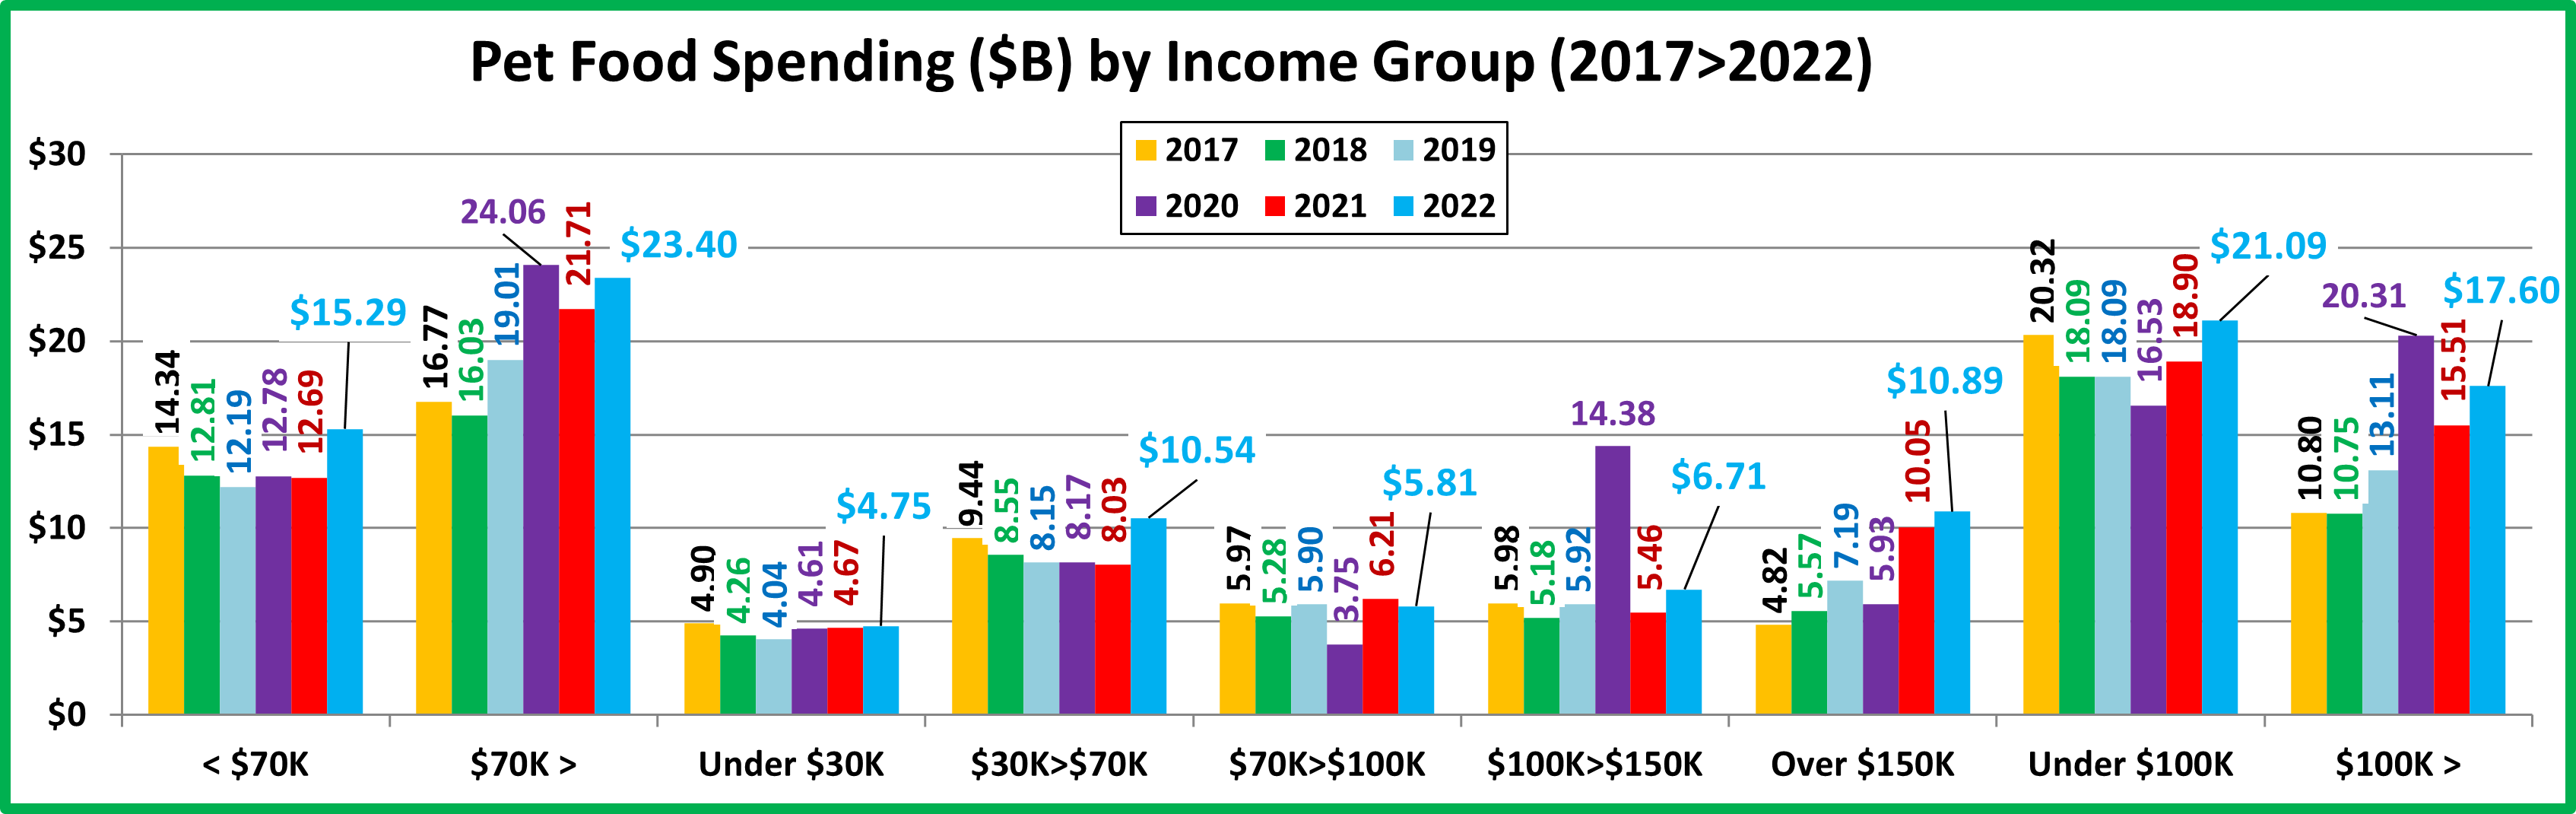
In 2022, only one group spent less on Food. 2017 was the only year since 2015 with spending growth in every major income group. Since 2017, we have seen the major impact on various groups by outside influences. In mid-2018 it was the FDA grain free warning. In 2020 it was the pandemic and in 2022 it was +10.2% inflation. The high inflation means that any demographic segment with an increase below 10.2% actually bought less Pet Food in 2022.
2022 National: $288.75 per CU (+11.9%); $38.69B; Up $4.29B (+12.5%); 2017>2022: Up $7.58B (+24.3%); Avg: +4.4%
The biggest lift came from the $30>70K group, which is surprising. The only drop in spending was by the middle income $70>100K group. This comes after their big lift in 2021. The $100>150K group is back to normal after their 2020 binge.
Here are 2022 specifics:
- Under $30K: (23.8% of CU’s) – $158.24 per CU (+11.0%) – $4.75B – Up $0.08B (+1.7%). Obviously, this group is very price sensitive. The number of CU’s was down 6.4% in 2022 after a small increase in 2021. Their CU count is down 17.0% from 2015. Their spending lift in 2022 was primarily due to higher prices. The average CU bought a little more Pet Food but paid a lot more. They are still fully committed to their Pets. This is evidenced by the fact that they spend 1.00% of their Total CU expenditures on their pets, including 0.45% on Pet Food. The national averages are: Total: 1.05%; Food: 0.40%.
- $30K>$70K: (28.9% of CU’s) – $260.52 per CU (+34.0%) – $10.54B – Up $2.52B (+31.4%). They are also very price sensitive so inflation had an impact. Their average income was up 0.8% while the national average increased by 7.5%. They had a 2.2% decrease in the number of CUs but a 4.6% increase in CU spending. However, their Pet Food spending was far stronger with a huge increase by all segments. The $30>39K group lost 7% in CUs but increased CU spending by 31.7% and $ +$0.44B (+21.7%). The $40>49K group fell -1.8% in numbers but they increased their CU spending by 33.7% and $ grew by +$0.84B (+40.5%). $50>69K gained 0.9% in CUs and spent 34.8% more per CU on Pet Food. This pushed their Total Pet Food Spending up $1.23B (+31.5%). This low-income group is very committed to their pets and quality food. They spent 1.09% of total expenditures on their pets and 0.5% on Pet Food.
- $70K>$100K: (14.1% of CU’s) – $302.80 per CU (-3.5%) – $5.81B – Down $0.40B (-6.5%). The only $ drop. This group has a regular up/down spending pattern. They committed to Super Premium food in 2017 but they became very sensitive to outside influences – the FDA warning in 2018, COVID in 2020 and now inflation in 2022. They have big family responsibilities and are under considerable monetary pressure. We’ll see if they make a comeback in 2023.
- $100>150K (15.5% of CU’s) – $325.92 per CU (+12.5%) – $6.71B – Up $1.25B (+23.0%). This group was the driver in the binge buying of Food in 2020. It was pure emotion, but they had the $ to do it. In 2021, they “ate down” the excess inventory but the drop was $0.46B more than the 2020 lift. In 2022, mostly thanks to inflation and a 9.6% increase in CU’s they had a 23% increase in $. Their Pet Food spending is now 13.3% above pre-pandemic 2019.
- $150K> (17.7% of CU’s) – $457.91 per CU (-5.8%) – $10.89B – Up $0.83B (+8.3%). Their Pet Food CU spending fell by -5.8% after a 68.6% lift in 21 but a 12.4% increase in CUs pushed their total $ up 8.3%. However, when you factor inflation into the numbers, they actually bought 1.7% less pet food. Inflation has made comparisons more complex. In performance, share of $/share of CUs, their score of 159.3% is the clear winner. Higher income is still important.
The pandemic certainly caused turmoil. First, the fear-based binge buy which caused a record increase in 2020. This couldn’t be repeated so spending fell in 2021. Spending returned to more normal, positive behavior in 2022 as only the $70>100K group spent less. The biggest lifts came from $30>70K and groups over $100K. Inflation was high at 10.2% but the welfare of their Pet children mattered more than the price so most Pet Parents just paid more. It is significant in this year of record inflation that the 50/50 income divide in Pet Food $ still fell slightly from $92K to $91K.
Now, Spending by Age Group…
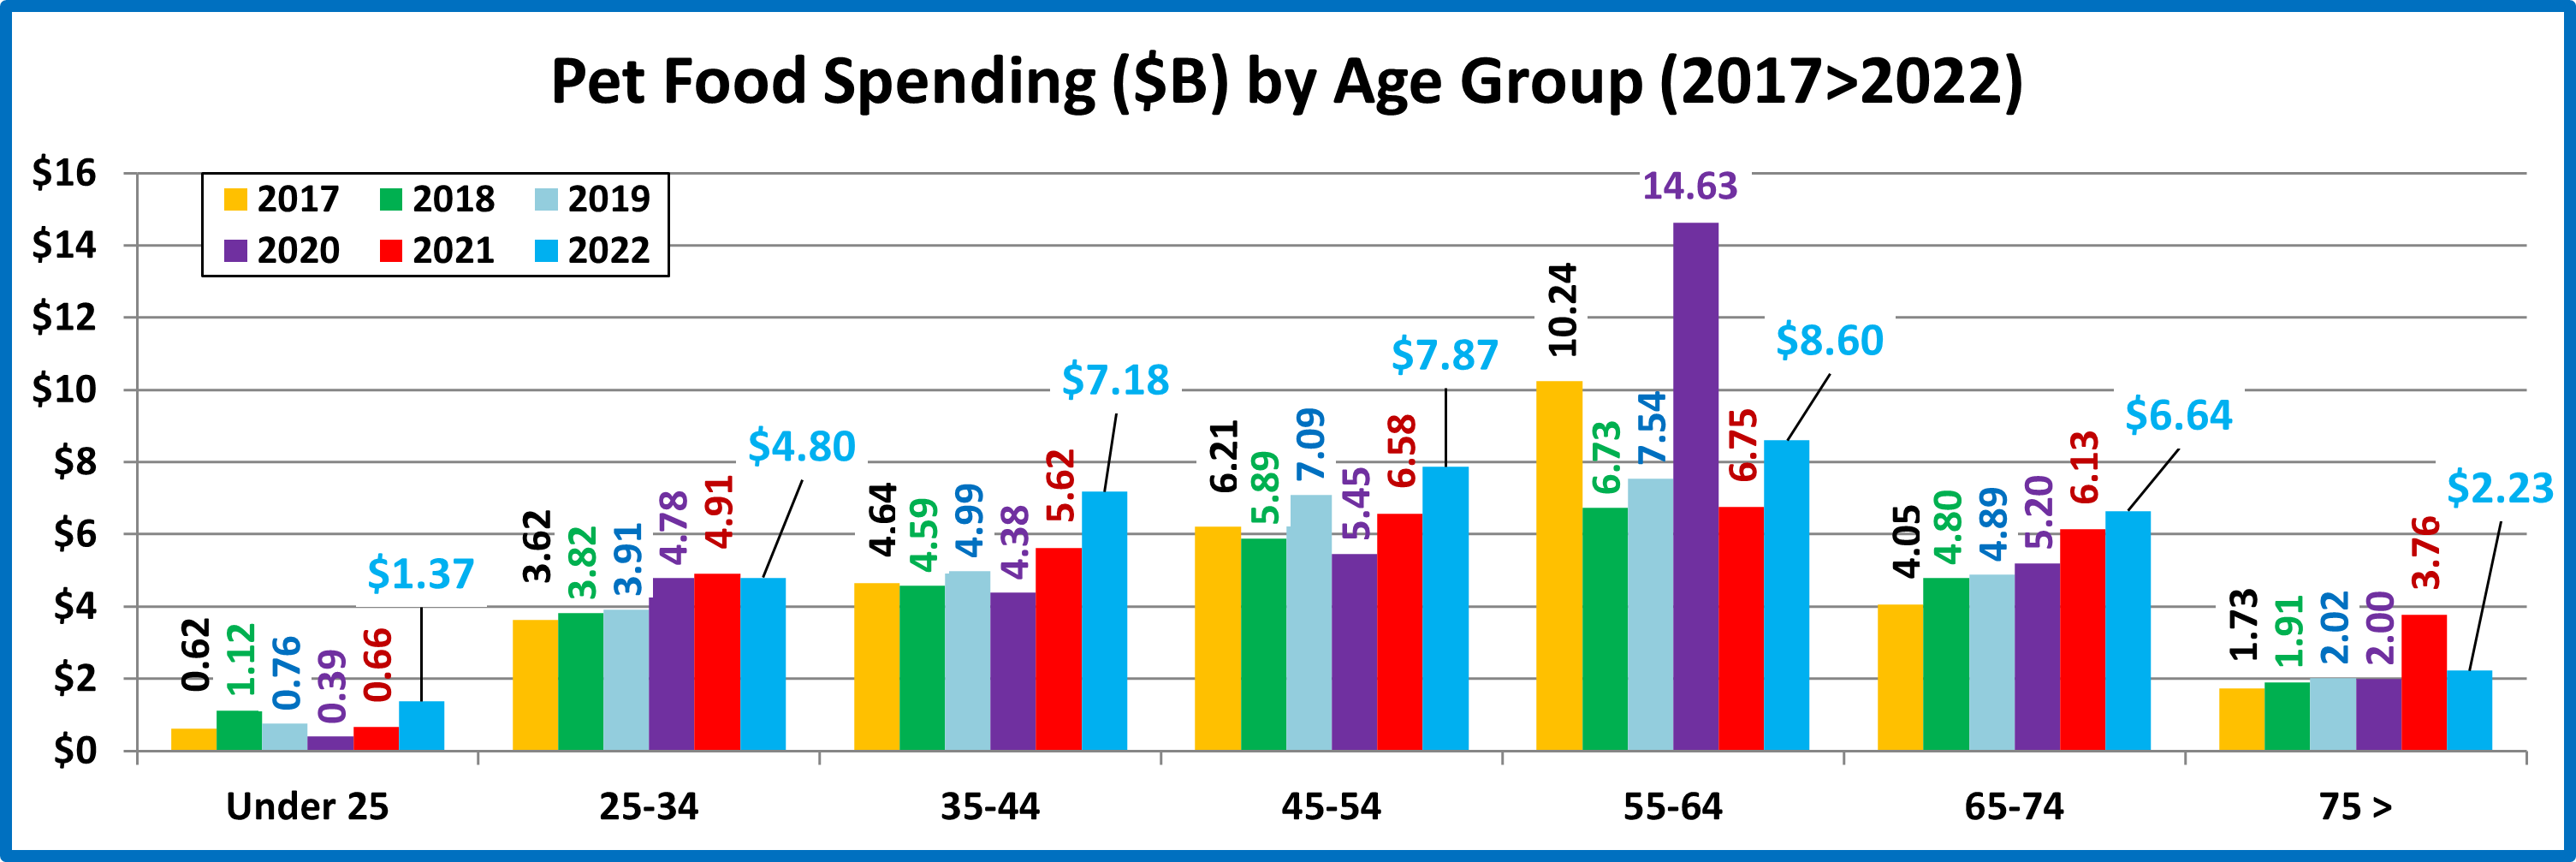
2022 National: $288.75 per CU (+11.9%); $38.69B; Up $4.29B (+12.5%); 2017>2022 – Up $7.58B (+24.3%); Avg: +4.4%
The 25>34 yr-old and 75+ yr-old groups spent less, while all other age groups spent more.
- 55>64 (18.2% of CU’s) – $359.76 per CU (+30.4%) – $6.75B – Up $1.86B (+27.5%). This group has been at the forefront of recent major spending swings. In 2015 they upgraded to Super Premium. In 2016 they shopped for a better price. In 2017 they led a deeper penetration of the upgrade. In 2018 they had a -$3.5B reaction to the FDA warning. They began to recover in 2019 but then came 2020, which saw a huge lift in spending. There were 3 major factors. First was panic, binge buying due to pandemic. They also were still recovering from the FDA warning. Finally, the pandemic caused the loss of over 2 million <25 CUs. Many of them moved back with their parents bringing their pets with them. In 2021, there was a big drop in $ as they “ate up” the “panic” extra stock and many of their kids moved out again. 2022 brought another big lift as 2.3% fewer CUs spent 22.8% more $, 6.2% more often.
- 45>54 (16.9% of CU’s) – $353.45 per CU (+20.8%) – $7.87B – Up $1.29B (+19.6%). This group is #1 in income and total CU expenditures. Up until 2015 they were #1 in Pet Food spending. They bought premium food but didn’t “buy in” to Super Premium until 2017. They were negatively impacted by the FDA warning, but they rebounded stronger than any other group. In 2020, their spending dropped significantly. It is likely that much of the decrease was due to value shopping on the internet. In 2021, they opted for even more expensive food, spending 24% more on each purchase. In 2022 they had 0.9% fewer CUs, but spent 12.8% more, 7.0% more often. The result: +19.6% more $.
- 65>74 (16.2% of CU’s) – $314.66 per CU (+7.8%) – $6.64B – Up $0.51B (+8.4%). This group is all Baby Boomers. They are starting to retire but many are still working (0.7 per CU). Their Pets are a major priority. They spent 1.26% of their total CU expenditures on their pets and 0.5% on Pet Food, the highest percentages of any group. They are also the only group to spend more on Pet Food every year since 2016. In 2022, 0.5% more CUs spent 2.8% more $, 4.9% more often. Inflation affected them as an 8.4% increase was really a -1.7% decrease in the amount purchased.
- 35<44 (17.0% of CU’s) – $302.24 per CU (+20.9%) – $7.18B – Up $1.56B (+27.6%). They are 2nd in income and CU spending but have the biggest families. Their spending pattern matches the 45>54 yr-olds but is usually less volatile. 5.5% more CUs spent 17.1% more $, 3.3% more often. They had the 2nd biggest $ lift and are now 3rd in Food $.
- 25>34 (15.6% of CU’s) – $224.30 per CU (-0.5%) – $80B – Down $0.11B (-2.2%). In the early Super Premium years their spending pattern often foreshadowed the overall market for the following year. In pandemic 2020 they spent 22.3% more then essentially held their ground in 2021. In 2022, 1.7% fewer CUs spent 7.9% less $, 8.0% more often.
- 75> (11.4% of CU’s) – $152.14 per CU (-41.8%) – $2.23B – Down $1.53B (-40.8%). Both the effort and the expense of Pet Parenting become issues as we reach 75+. High inflation affected them the most. They strongly moved to Super Premium Food in 2021. In 2022, many downgraded as 1.6% more CUs spent 41.8% less $, 0.2% more often.
- <25 (4.7% of CU’s) – $198.10 per CU (+101.5%) – $1.37B – Up $0.72B (+108.6%). Many moved in with other adults or got married. They also added a lot of pets. This is apparent as 5.1% less CUs spent 109.6% more $, 4.4% more often.
In 2020 the 55>64 yr olds binge bought Pet Food. In 2021 their spending naturally plummeted, the only decrease by any age group. In 2022 we had high inflation. It affected everyone but only 25>34 and 75> spent less $ on Pet Food and only 3 groups bought less product (add 65>74 to the other 2). Quality pet food remains a high priority for Pet Parents.
Next, let’s take a look at some other key demographic “movers” in 2022 Pet Food Spending. The segments that are outlined in black “flipped” from 1st to last or vice versa from 2021. The red outline stayed the same.
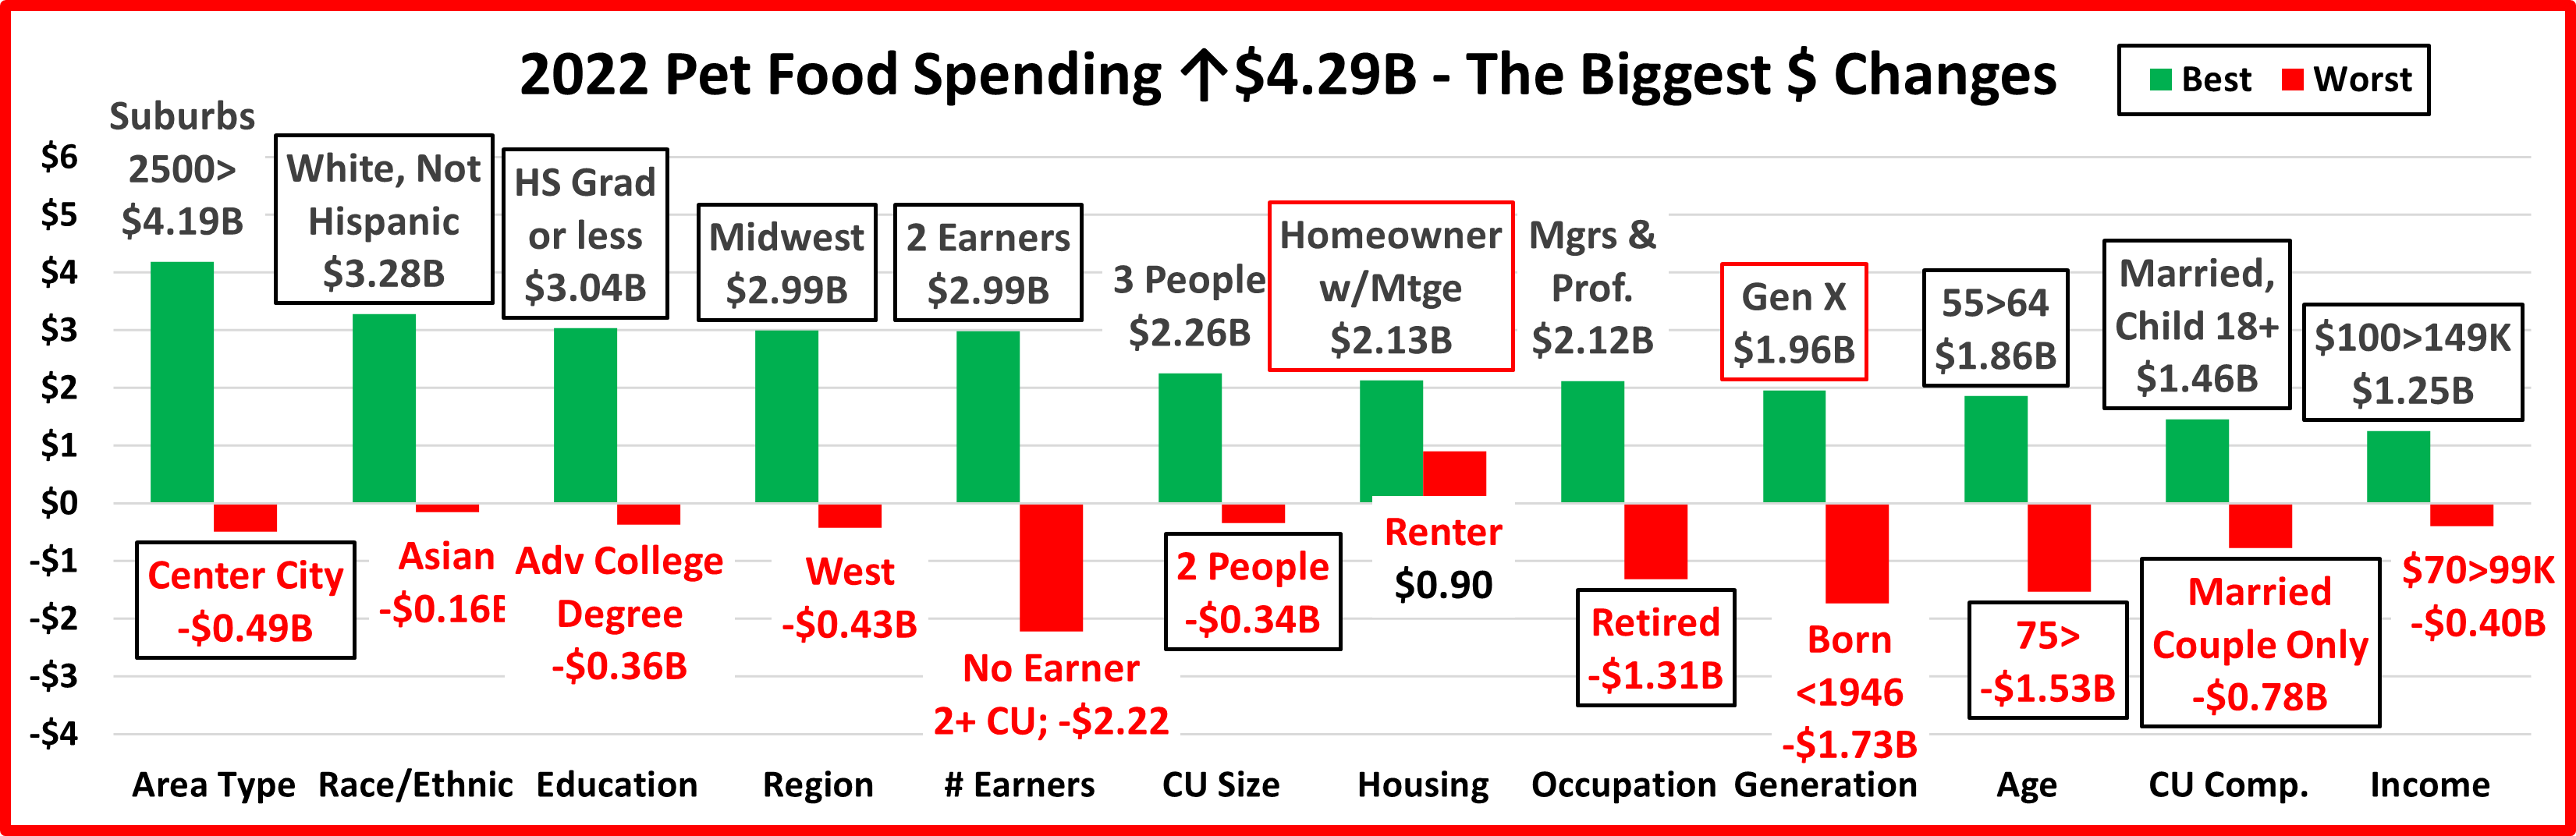
The first thing that you notice is that the biggest increases are almost always radically larger than the biggest decreases. We should also note that whether you rent or own your home, you spent more on Pet Food in 2022 than in 2021. The lift was also widespread as 82% of 96 demographic segments spent more in 2022. These are good signs that Pet Food spending is doing well.
You also see that half of the 24 segments flipped from last to first or vice versa. Only 2 held their position from 2021. 7 winners flipped from last to 1st and 2 held their position. 5 losers flipped to last from 1st in 2021.
Most of the winners are the “usual suspects”:
- Suburbs 2500>
- White, Not Hispanic
- 2 Earners
- Homeowners, w/Mtge
- Mgrs & Professionals
- Gen X
- 55>64
- Married, Child 18>
- $100>149K
There is only 1 surprise winner – High School Grads or Less
These winners indicate a return to more normal spending patterns but you should also consider that most have a higher income so they would be less impacted by strong inflation.
Among the losers, most of the segments are not unexpected. There are some that were obviously affected by inflation:
- No Earner
- Retired
- Born <1946
- 75>
- $70>99K.
There were a few surprises – Adv. College Degree, 2 People and Married Couple Only
The pandemic trauma may now be over. The $4.29B (+12.5%) increase was widespread across 82% of 96 demographic segments. However, 10.2% inflation is a new problem. The amount of Pet Food sold in 2022 was really only +2.2% from 2021 and only 59% of segments bought more. Pet Food spending is now up $7.5B from 2019, +24.0%, a growth rate of 7.4%, 40% more than the 5.3% from 2014>19. The downside is that 46% of that growth came from inflation…almost all in 2022. Real 19>22 growth: 4.1%. Inflation fell below 10% in August 2023. We’ll see what happens to prices & spending.


Trackbacks & Pingbacks
[…] 吉本斯 说 该行业的优势在于“宠物父母的绝对第一要务——宠物孩子的健康、福祉和安全,这首先从食品质量开始。” […]
[…] differs from retail sales; the BLS data, helpfully compiled and analyzed by John Gibbons, aka the Pet Business Professor, is based on surveys of U.S. consumer units (CUs, essentially […]
Comments are closed.