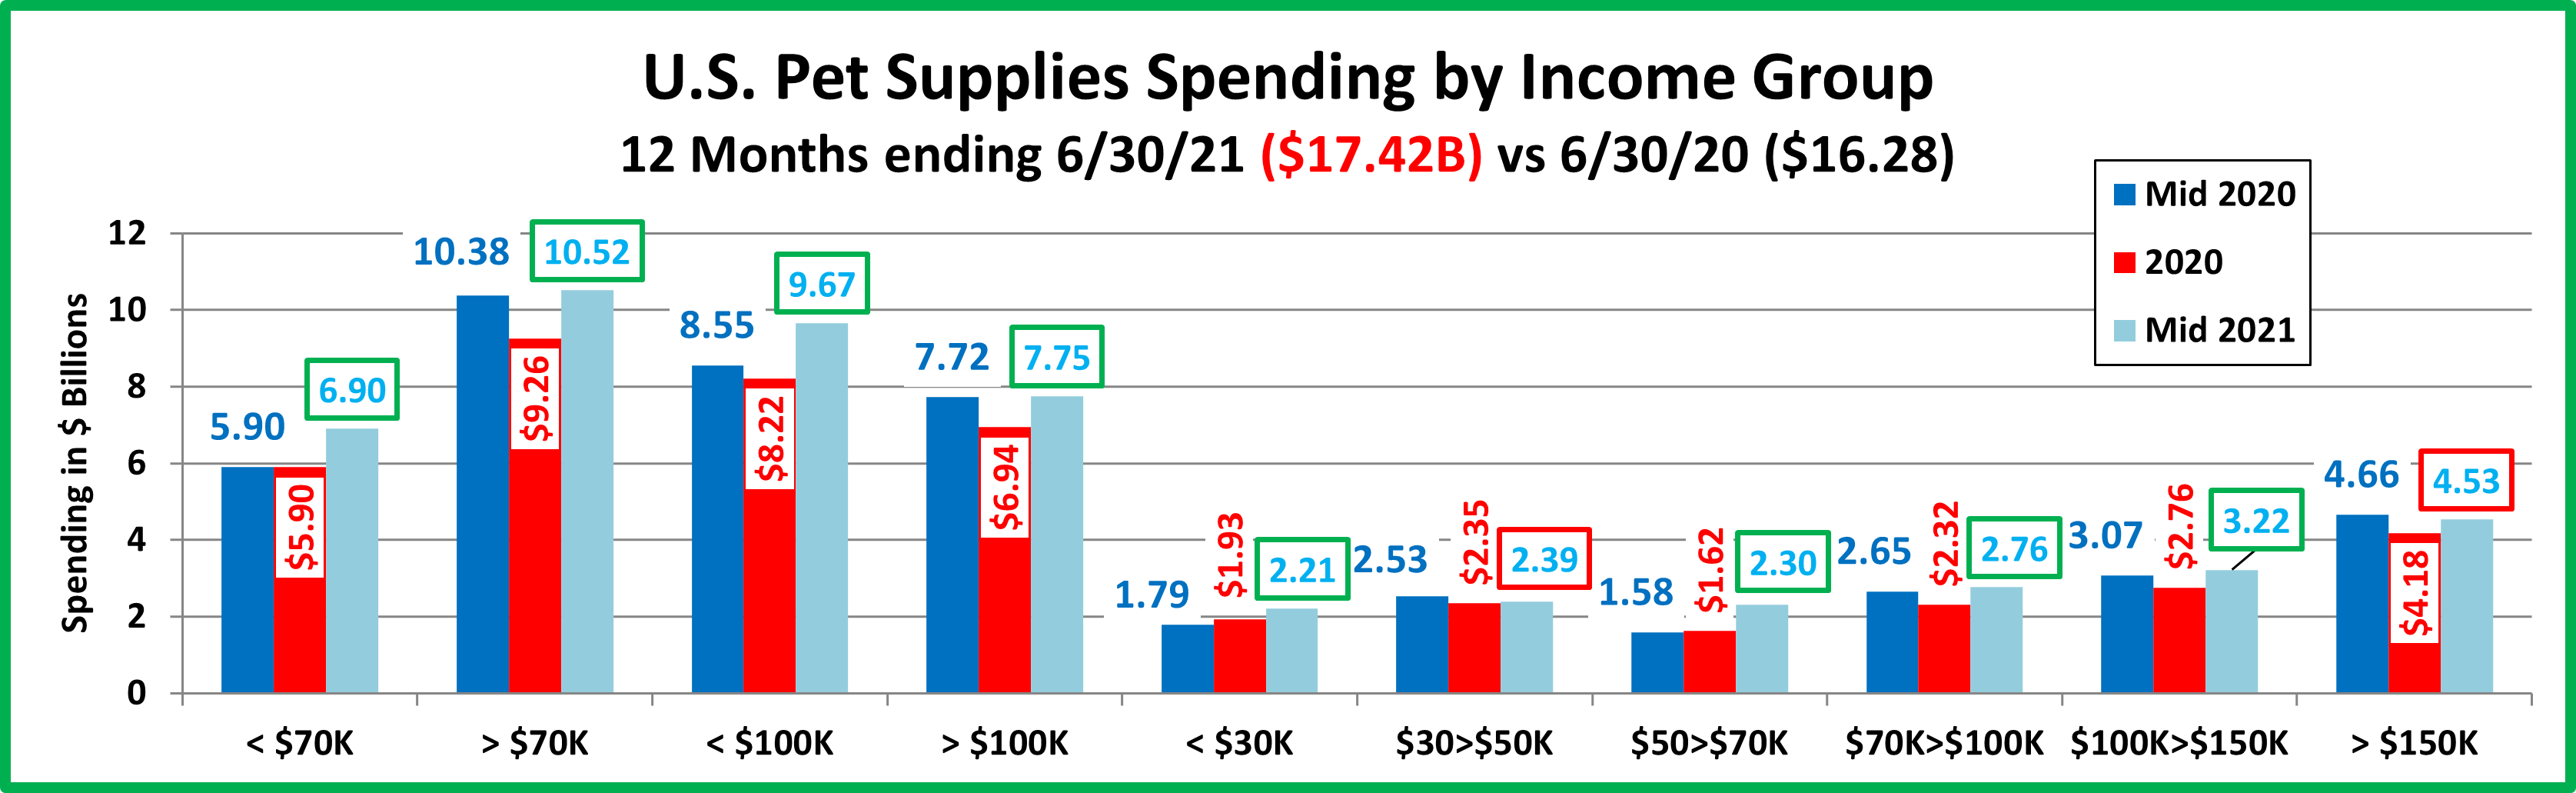
U.S. Pet Services Spending (Non-Vet) $7.44B (↓$0.40B): 2021 Mid-Year Update
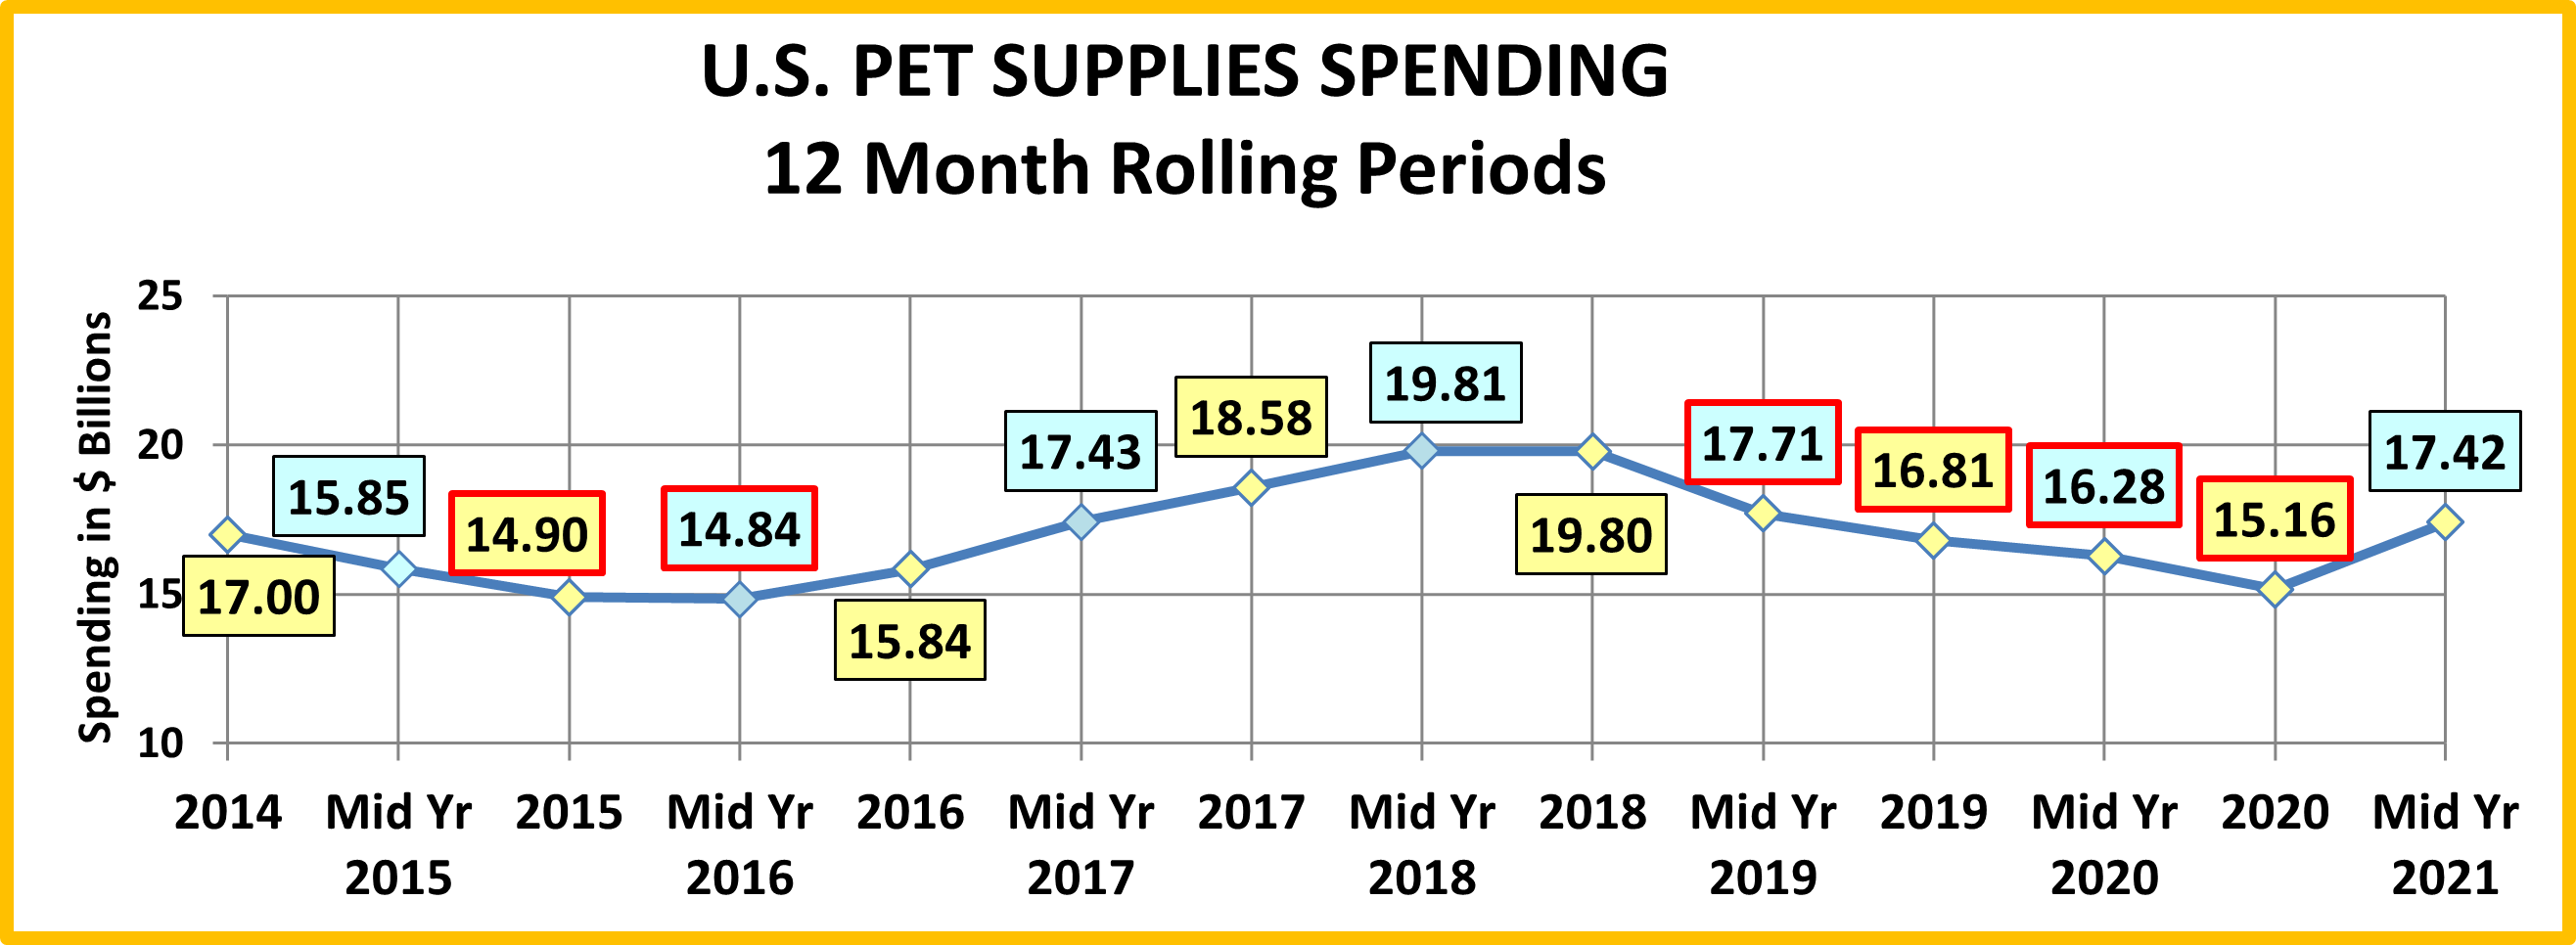
The US BLS released their Mid-Year Update of the Consumer Expenditure Survey covering the period from 7/1/2020 to 6/30/2021. In our analysis of Pet Supplies Spending, we saw an incredibly strong rebound from the 2-year decline caused by inflation then the pandemic. However, Pet Food Spending took the opposite route. Spending fell sharply in the 1st half of 2021 compared to the extra food that Pet Parents had “panic” bought due to the fear of pandemic induced shortages. Now we turn our attention to Pet Services. The Mid-year numbers show that spending in this segment was $7.44B, down $0.40B (-5.1%) from the previous year. Up until 2018, this segment was known for consistent, small growth. In 2018, increased outlets and competitive prices brought on a wave of new users and spending increased +$1.95B. Spending remained near this new high normal until we reached 2020. Closures due to the pandemic drove spending down $1.73B by yearend, essentially returning to the level of 2017. In 2021 things opened up and spending began to rebound. This deserves a closer look. First, we’ll look at Services spending history since 2014.

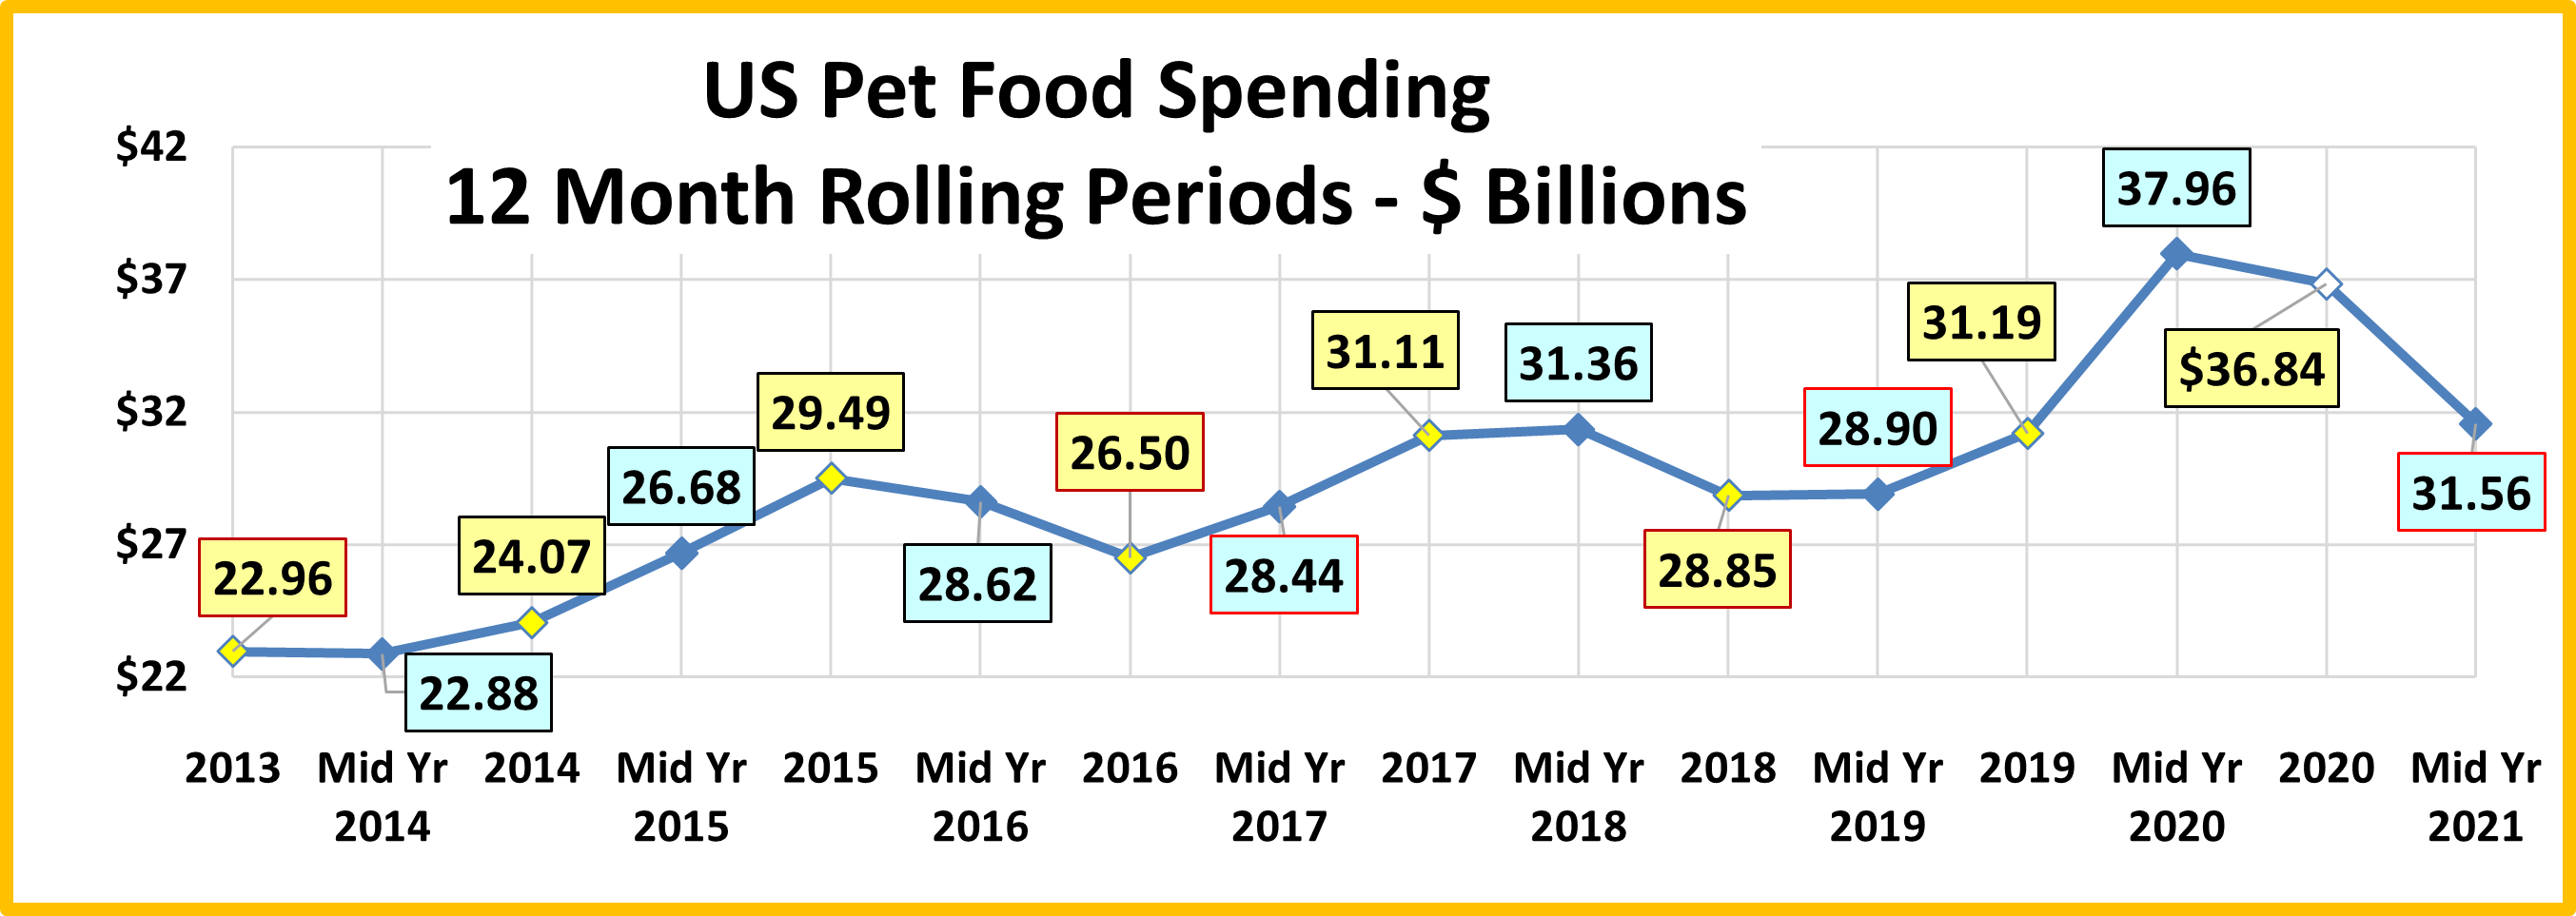
Here are the 2021 Mid-Year Specifics:
Mid-Year 2021: $7.44B, ↓$0.40B (-5.1%) vs Mid-Yr 2020
Jul > Dec 2020: ↓$0.95B Jan > Jun 2021: ↑$0.55B
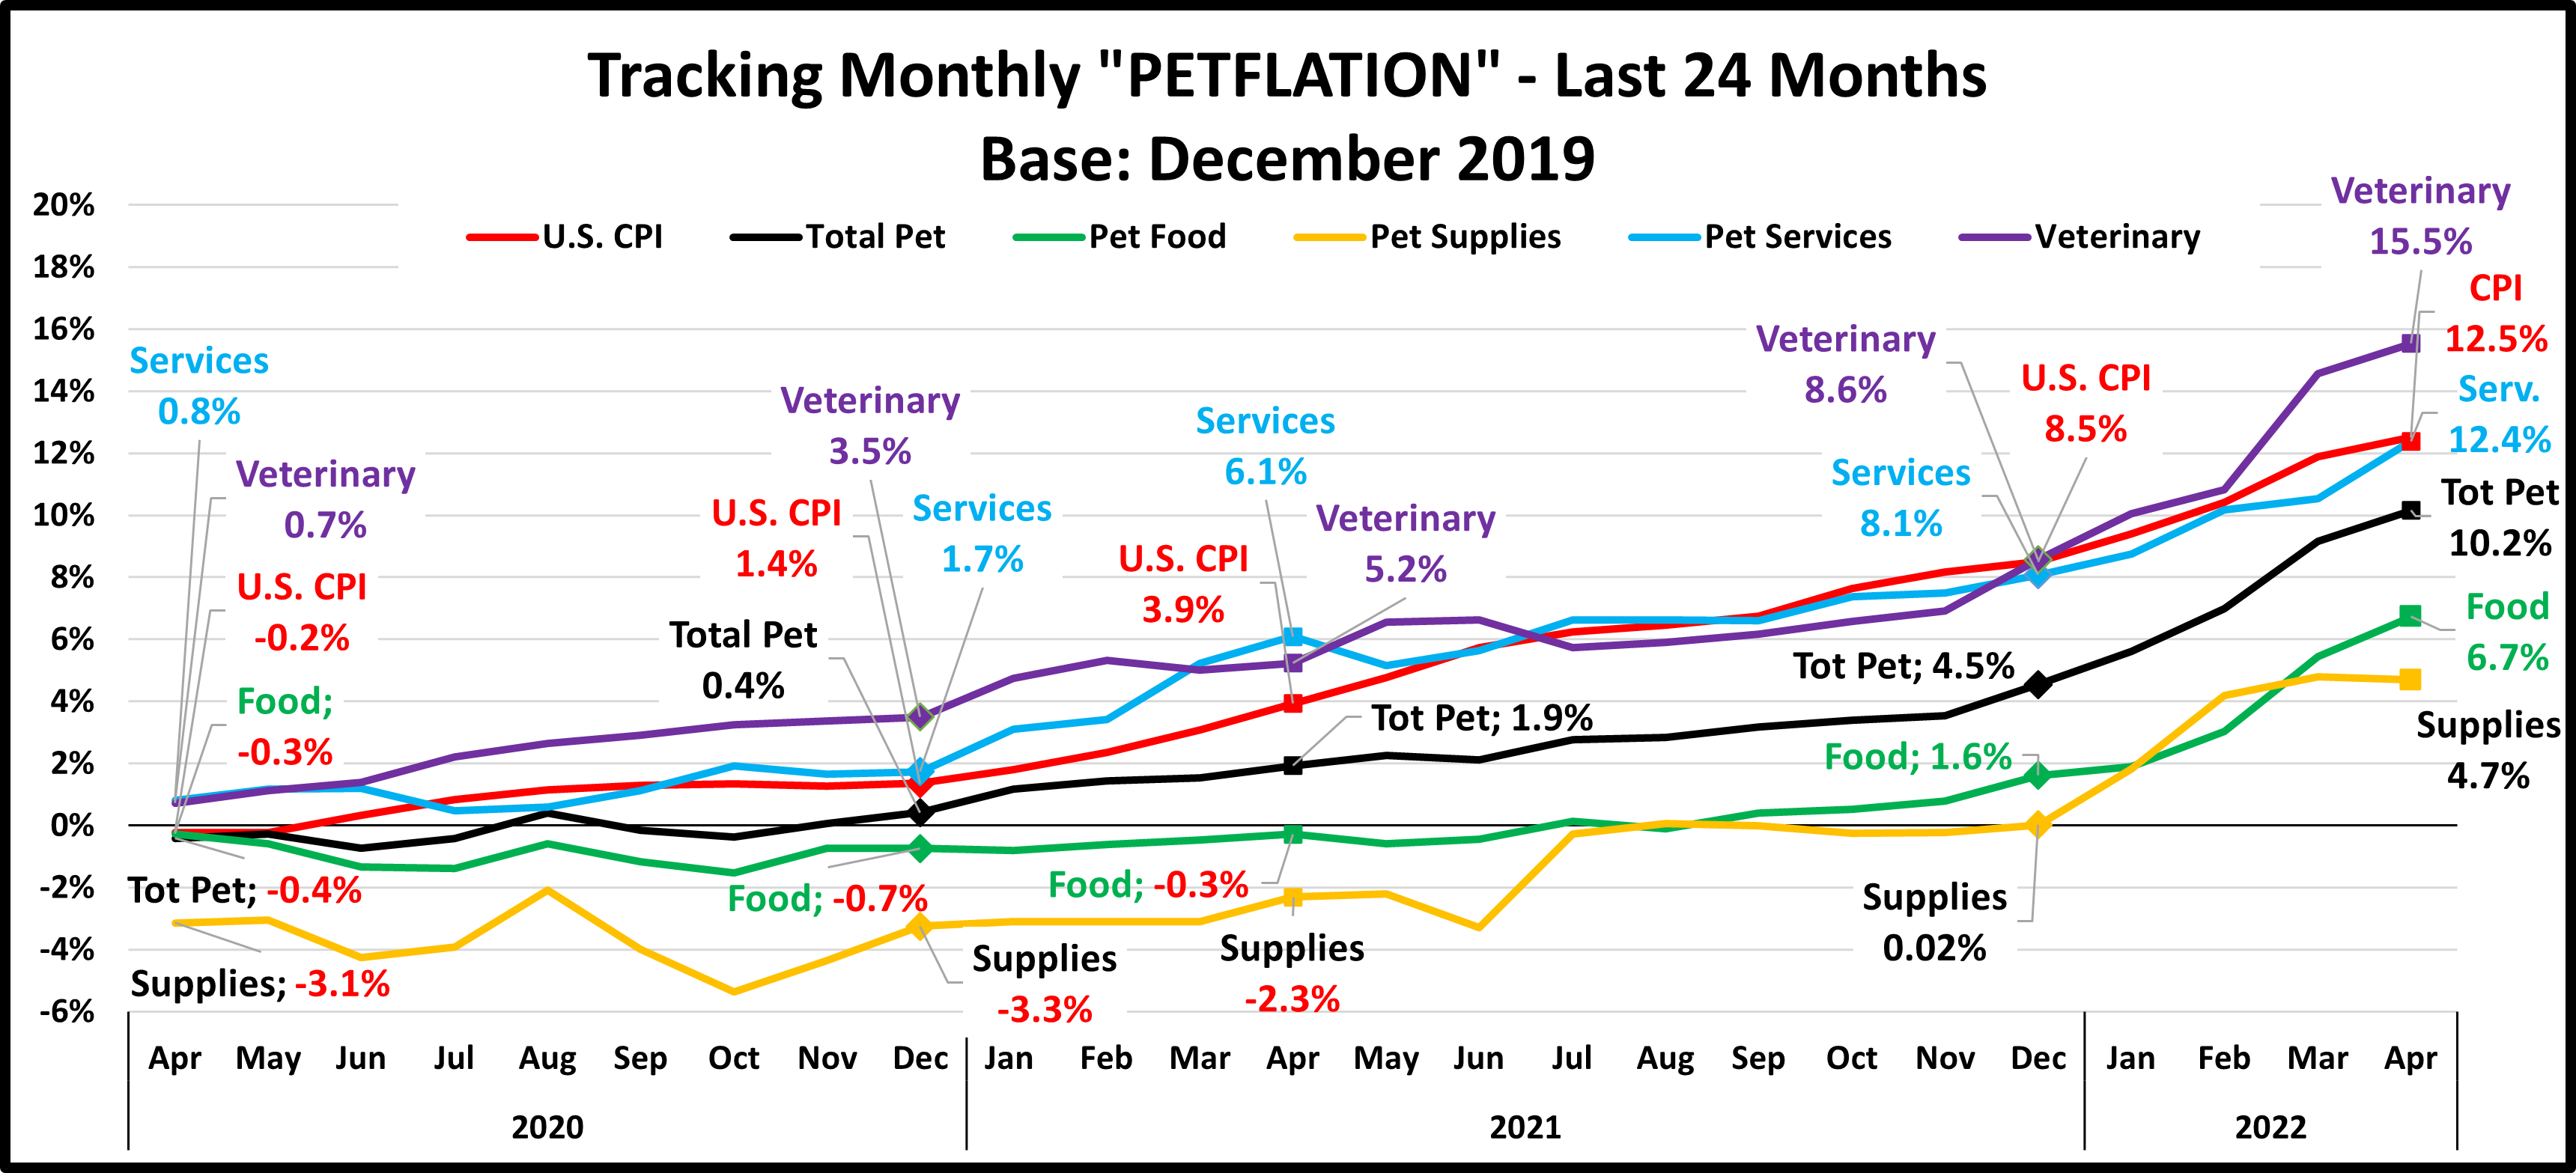
Pet Services is by far the smallest industry segment. However, except for 2010 and 2011, the period immediately following the Great Recession, it had consistent annual growth from 2000 through 2016. Spending in Food and Supplies have been on a roller coaster ride during that period. Services Spending more than tripled from 2000 to 2016, with an average annual growth rate of 7.6%. Spending in the Services Segment is the most discretionary in the industry and is more strongly skewed towards higher income households. Prior to the great recession, the inflation rate averaged 3.9% with no negative impact. The recession affected every industry segment, including Services. Consumers became more value conscious, especially in terms of discretionary spending. Services saw a slight drop in spending in both 2010 and 2011, but then the inflation rate fell to the 2+% range and the segment returned to more “normal” spending behavior. In mid-2016 inflation dropped below 2% and continued down to 1.1% by the end of 2017. This was primarily due to increased competition from free standing businesses but also an increase in the number of Pet Stores and Veterinary Clinics offering pet services. While prices still went up slightly, there were deals to be had and consumers shopped for the best price. There was no decrease in purchase frequency. Consumers just paid less so spending fell slightly. In the 2nd half of 2017 spending turned up again. More Consumers began to take advantage of the value and convenience of the increased number of outlets offering Services. This deeper market penetration caused Services Spending to take off in 2018, up $1.95B, by far the biggest annual increase in history. Prices turned up again in the first half of 2019, increasing 2.8% from 2018. However, Services spending inched up $0.09B. In the 2nd half of 2019 Value shopping again came to the forefront as spending fell -$0.19B. Then came 2020 and the pandemic. Many of these nonessential businesses were forced to close and spending fell precipitously, -$1.73B to $6.89B, about the same as yearend 2017. In 2021 things opened up again and spending bounced back, +$0.55B vs the 1st 6 months of 2020. However, there’s still a long way to go.
Let’s take a closer look at some spending demographics – Age and Income.
In the graphs that follow we compare spending for the 12 months ending 6/30/21 to the previous 12 months. The graphs also include the 2020 yearend $, so you can see spending changes in the 2nd half of 2020 and the 1st half of 2021.
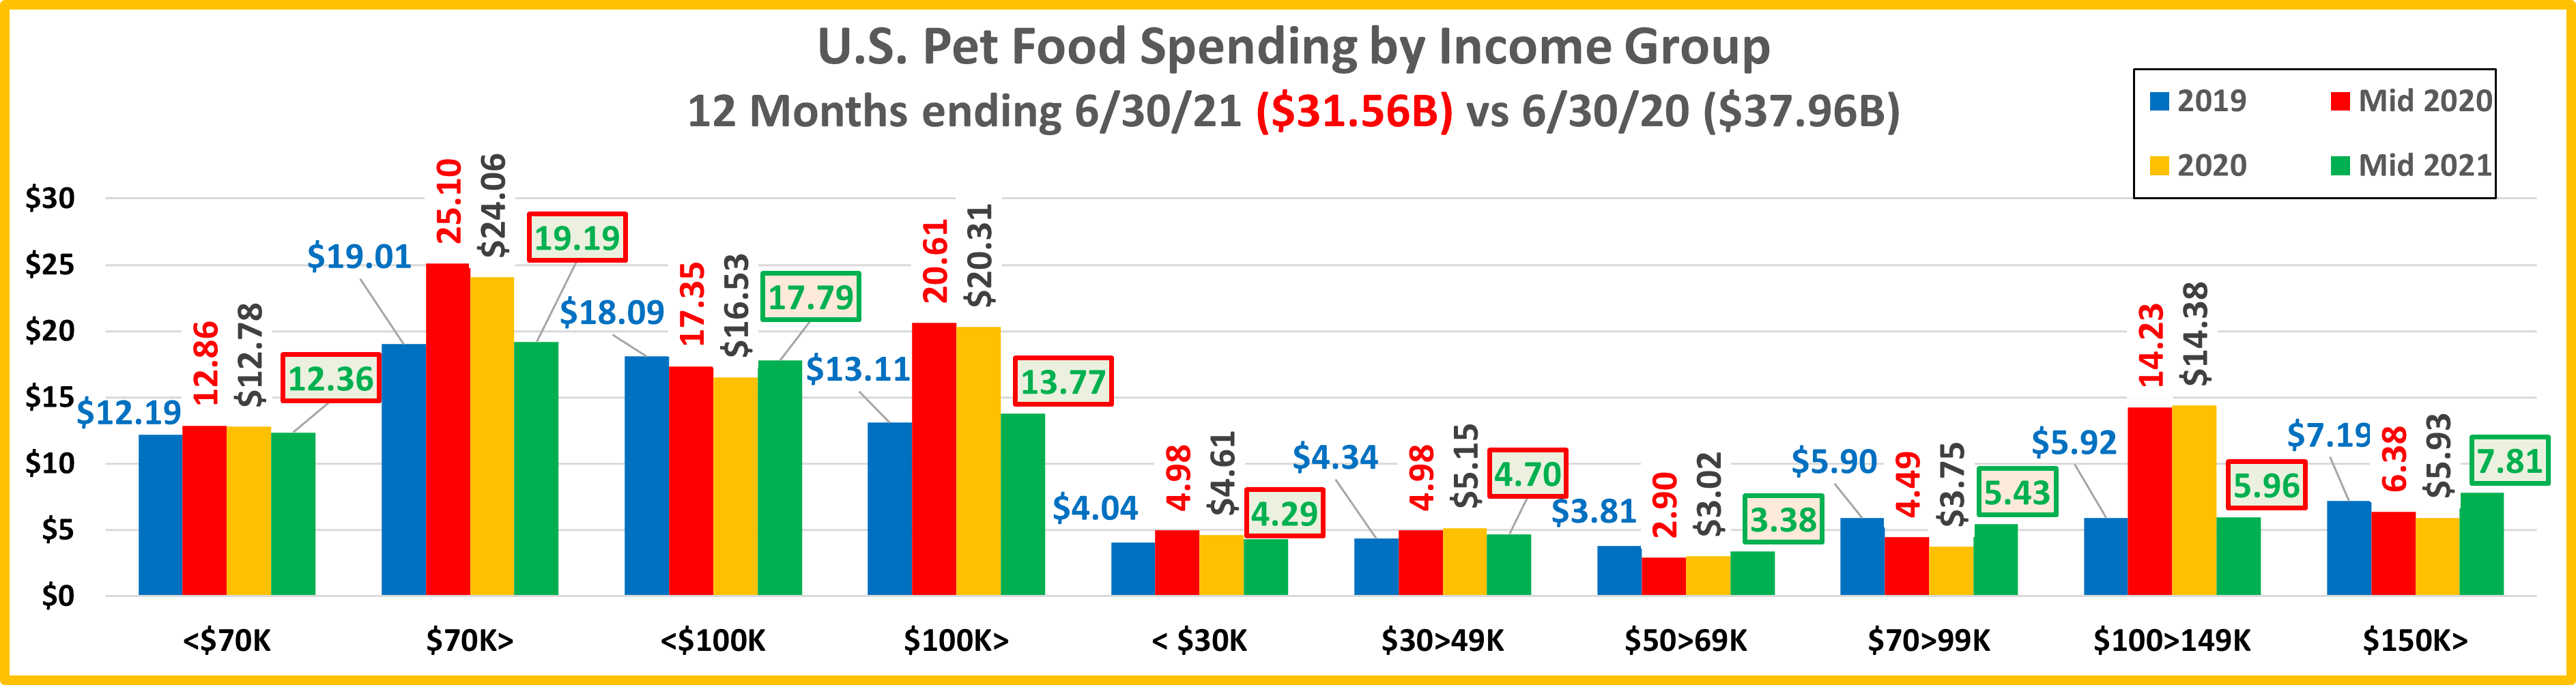
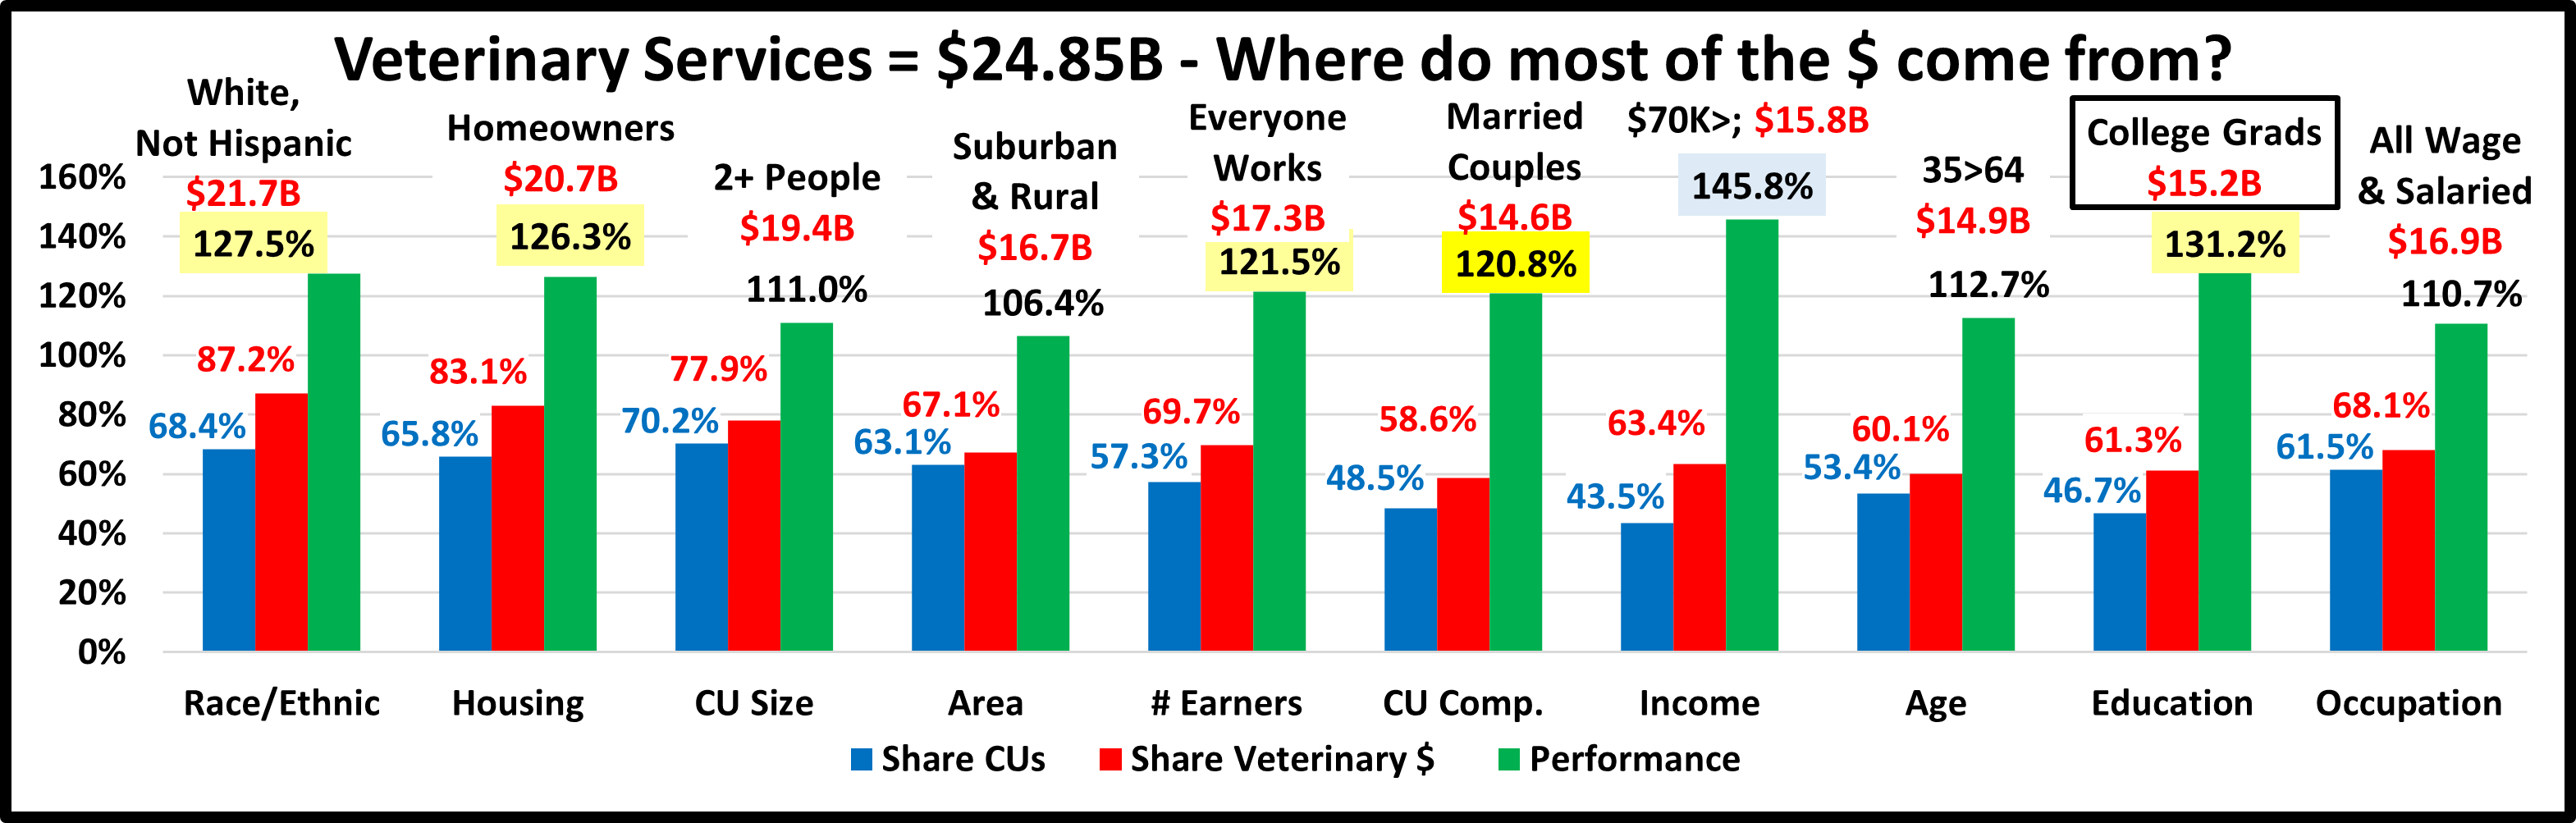
The first graph is for Income, the single most important factor in increased Pet Spending, especially in Services.
Here’s how you get the change for each half using the Over $70K group as an example:
- Mid-yr Total Spending Change: $5.04B – $6.02B = Down -$0.98B (Note green outline = increase; red outline = decrease)
- 2nd half of 2020: Subtract Mid-20 ($6.02B) from Total 2020 ($4.77B) = Spending was down $1.25B in 2nd half of 2020.
- 1st half of 2021: Subtract Total 2020 ($4.77B) from Mid-21 ($5.04B) = Spending was up +$0.27B in 1st half of 2021
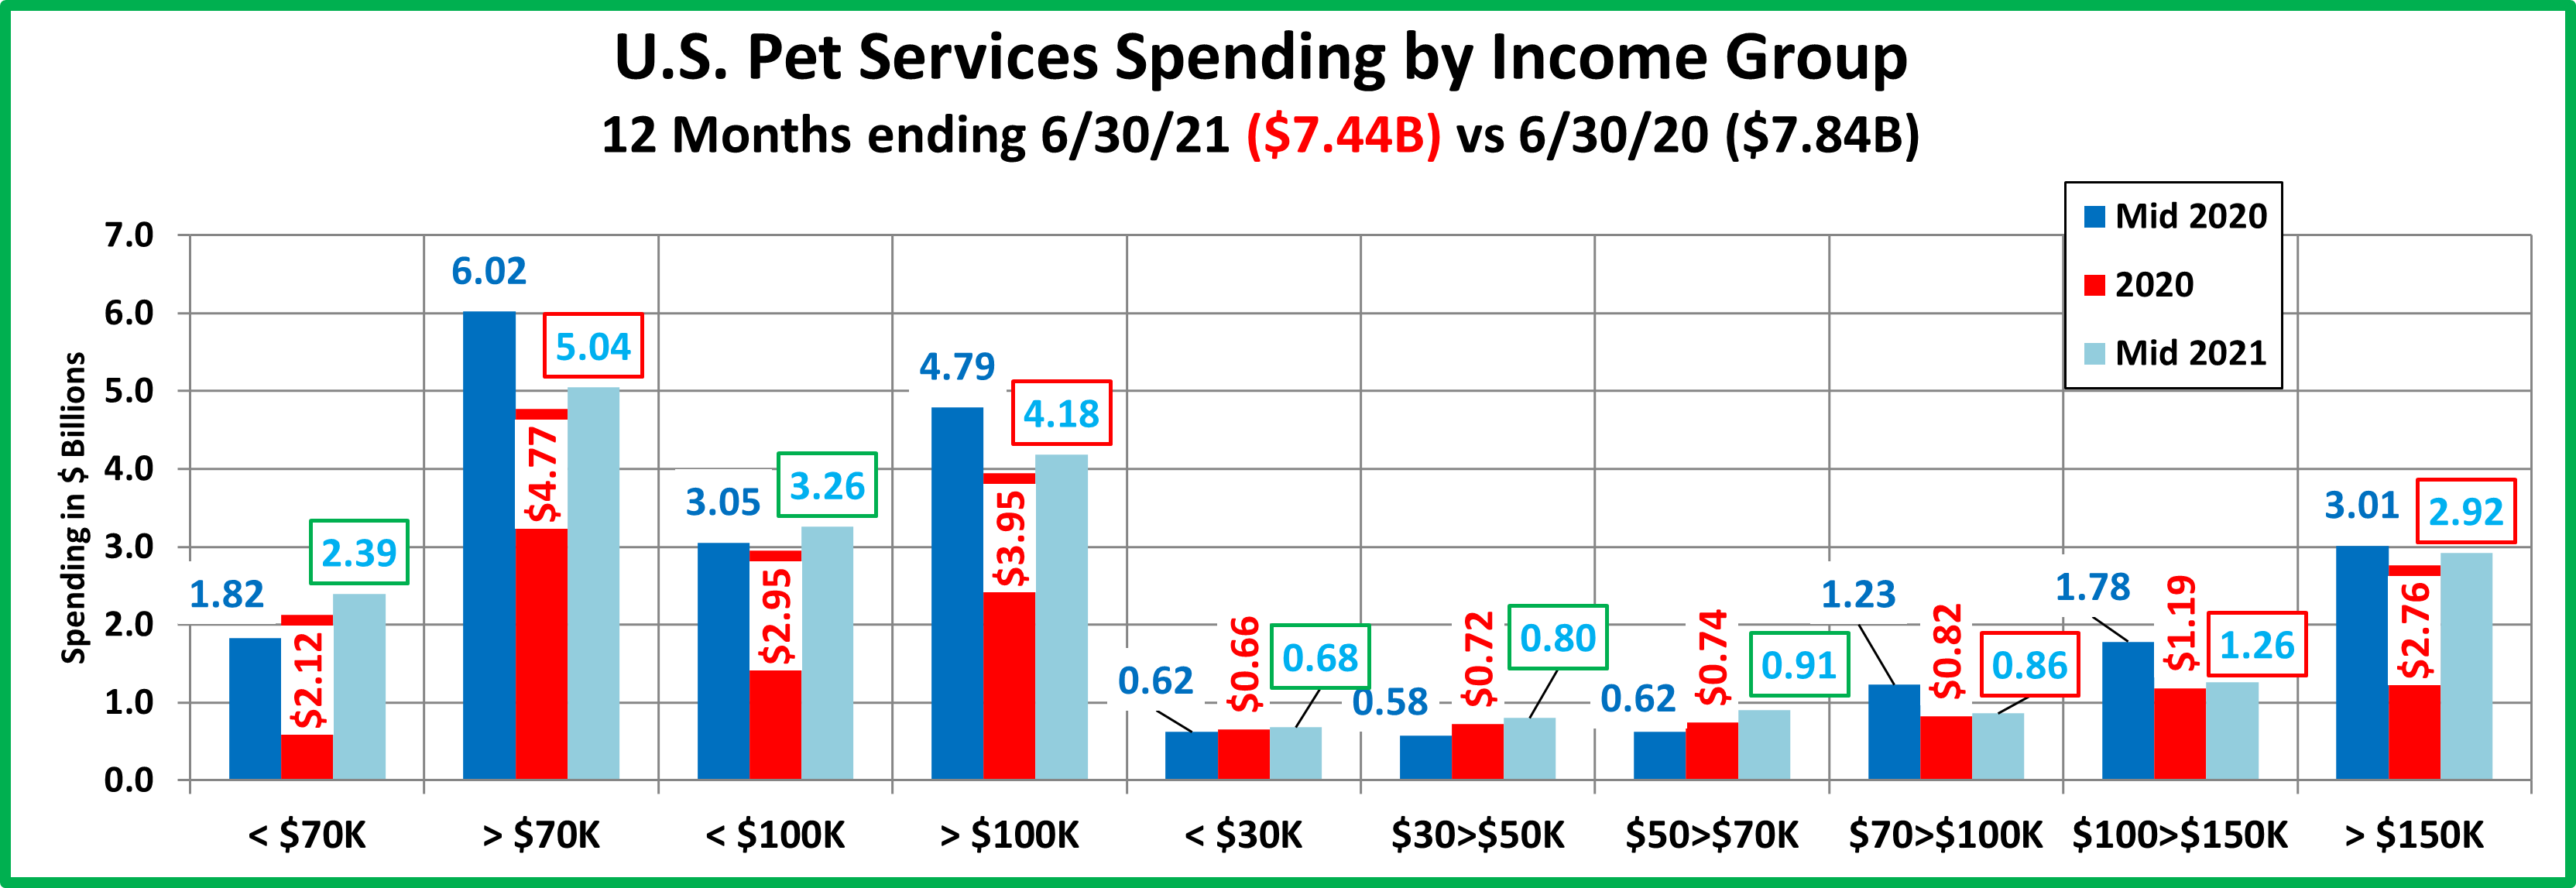
- With the Over/Under $100K measurement, you see how Services Spending is a little less skewed towards higher incomes. The halfway spending point is about $115K so about 25% of CUs spend 50% of Services $. The overall <$70K group grew consistently in both halves reflecting the pattern of all under $70K income groups.
- As we noted, all individual groups below $70K had steady growth. The $50>$70K led the way with a $0.29B (+46.7%) increase for the year and $0.17B lift in the 1st half of 2021.
- The middle to high income $70 to $150K groups had the biggest negative pandemic impact as spending fell $1B in the 2nd half of 2020. The $ increased slightly, +$0.1B in the 1st half of 2021 but they were still -$0.89B for the year.
- The over $150K group has 14.6% of the CUs but accounts for 39.2% of Services $. This is actually a larger share than the 37.6% that they had in pre-pandemic 2019. The pandemic had a minimal impact on this group.
- With gains from all the <$70K groups and big losses from the $70>150K groups, Services spending has become a little more balanced in regard to income. However, income, especially when it is over $150K, remains the single biggest factor in the discretionary spending in the Services segment.
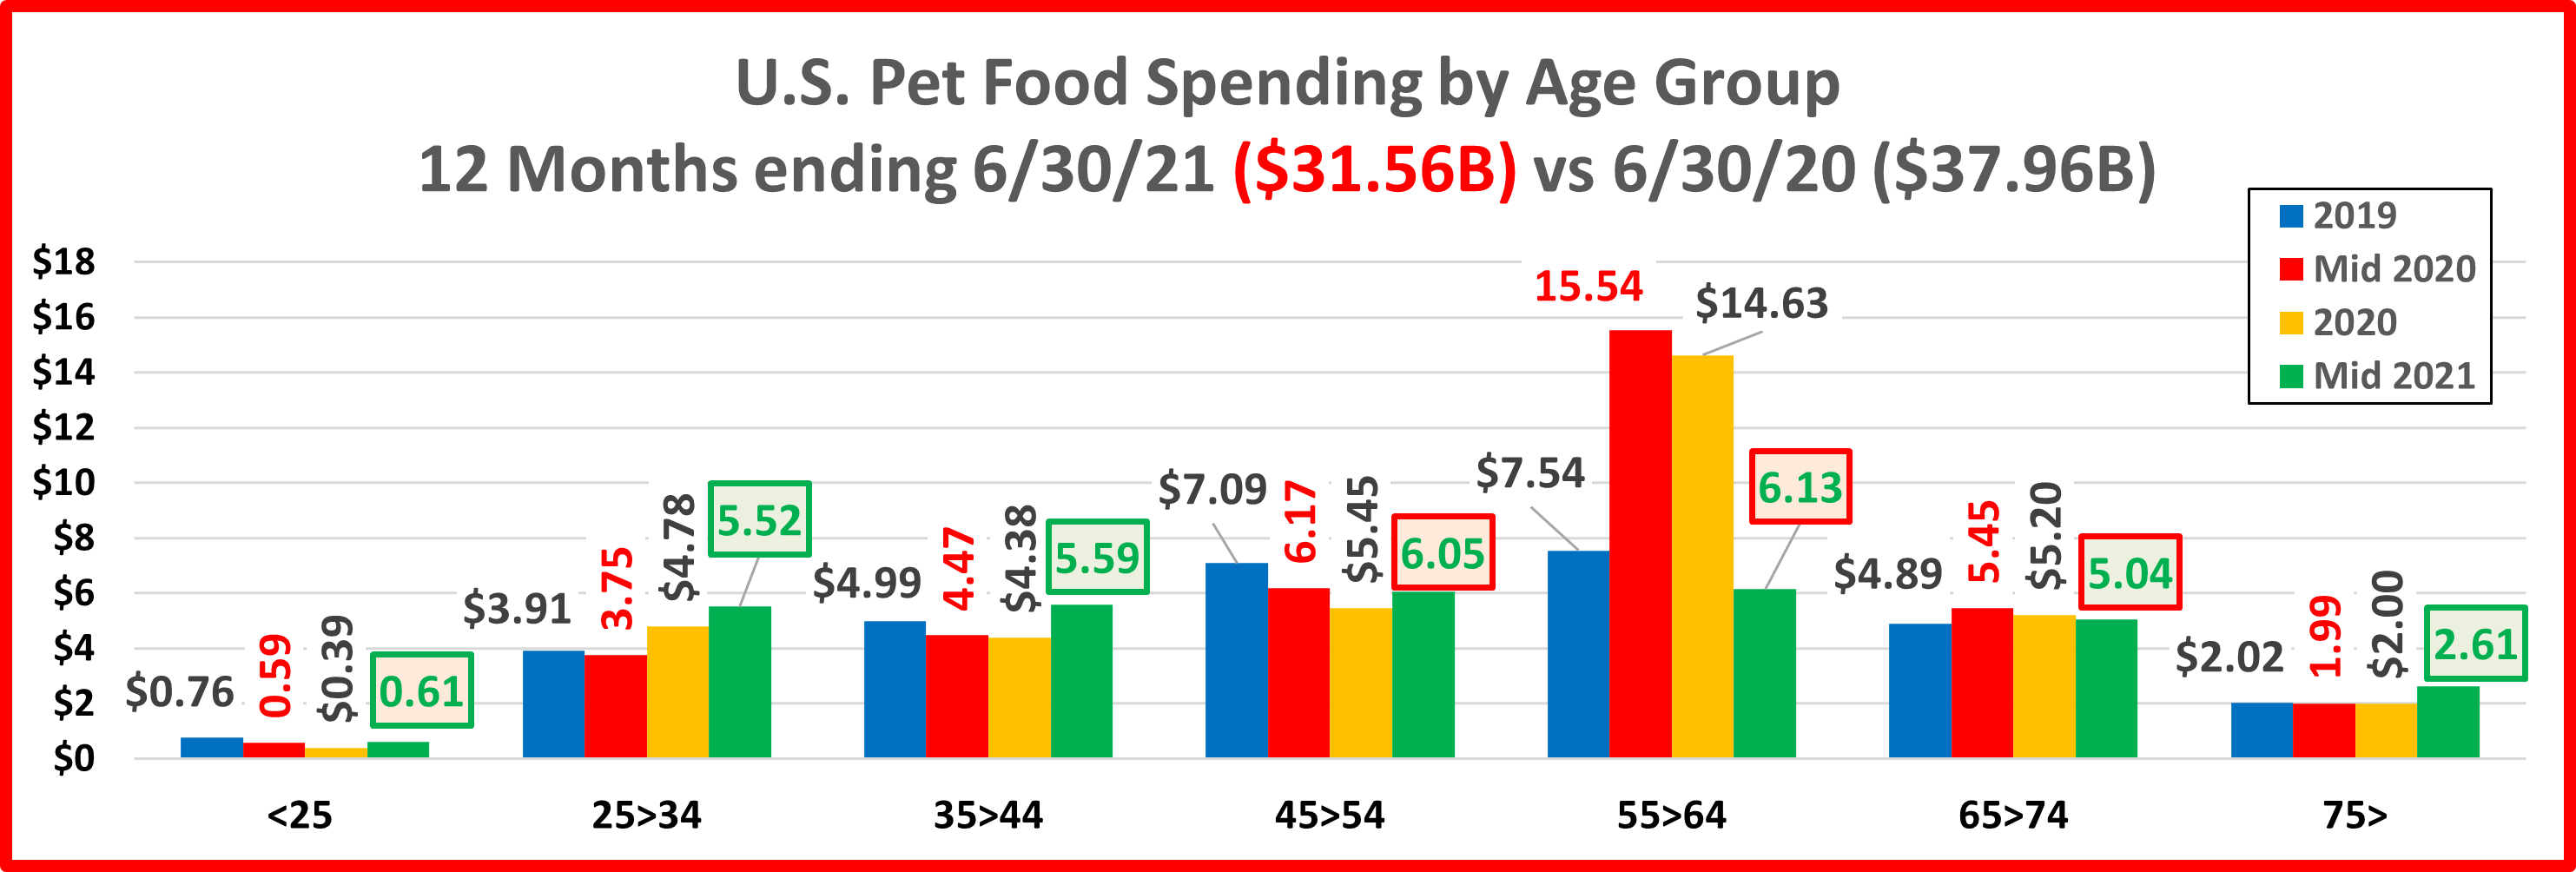
Now, Services’ Spending by Age Group.
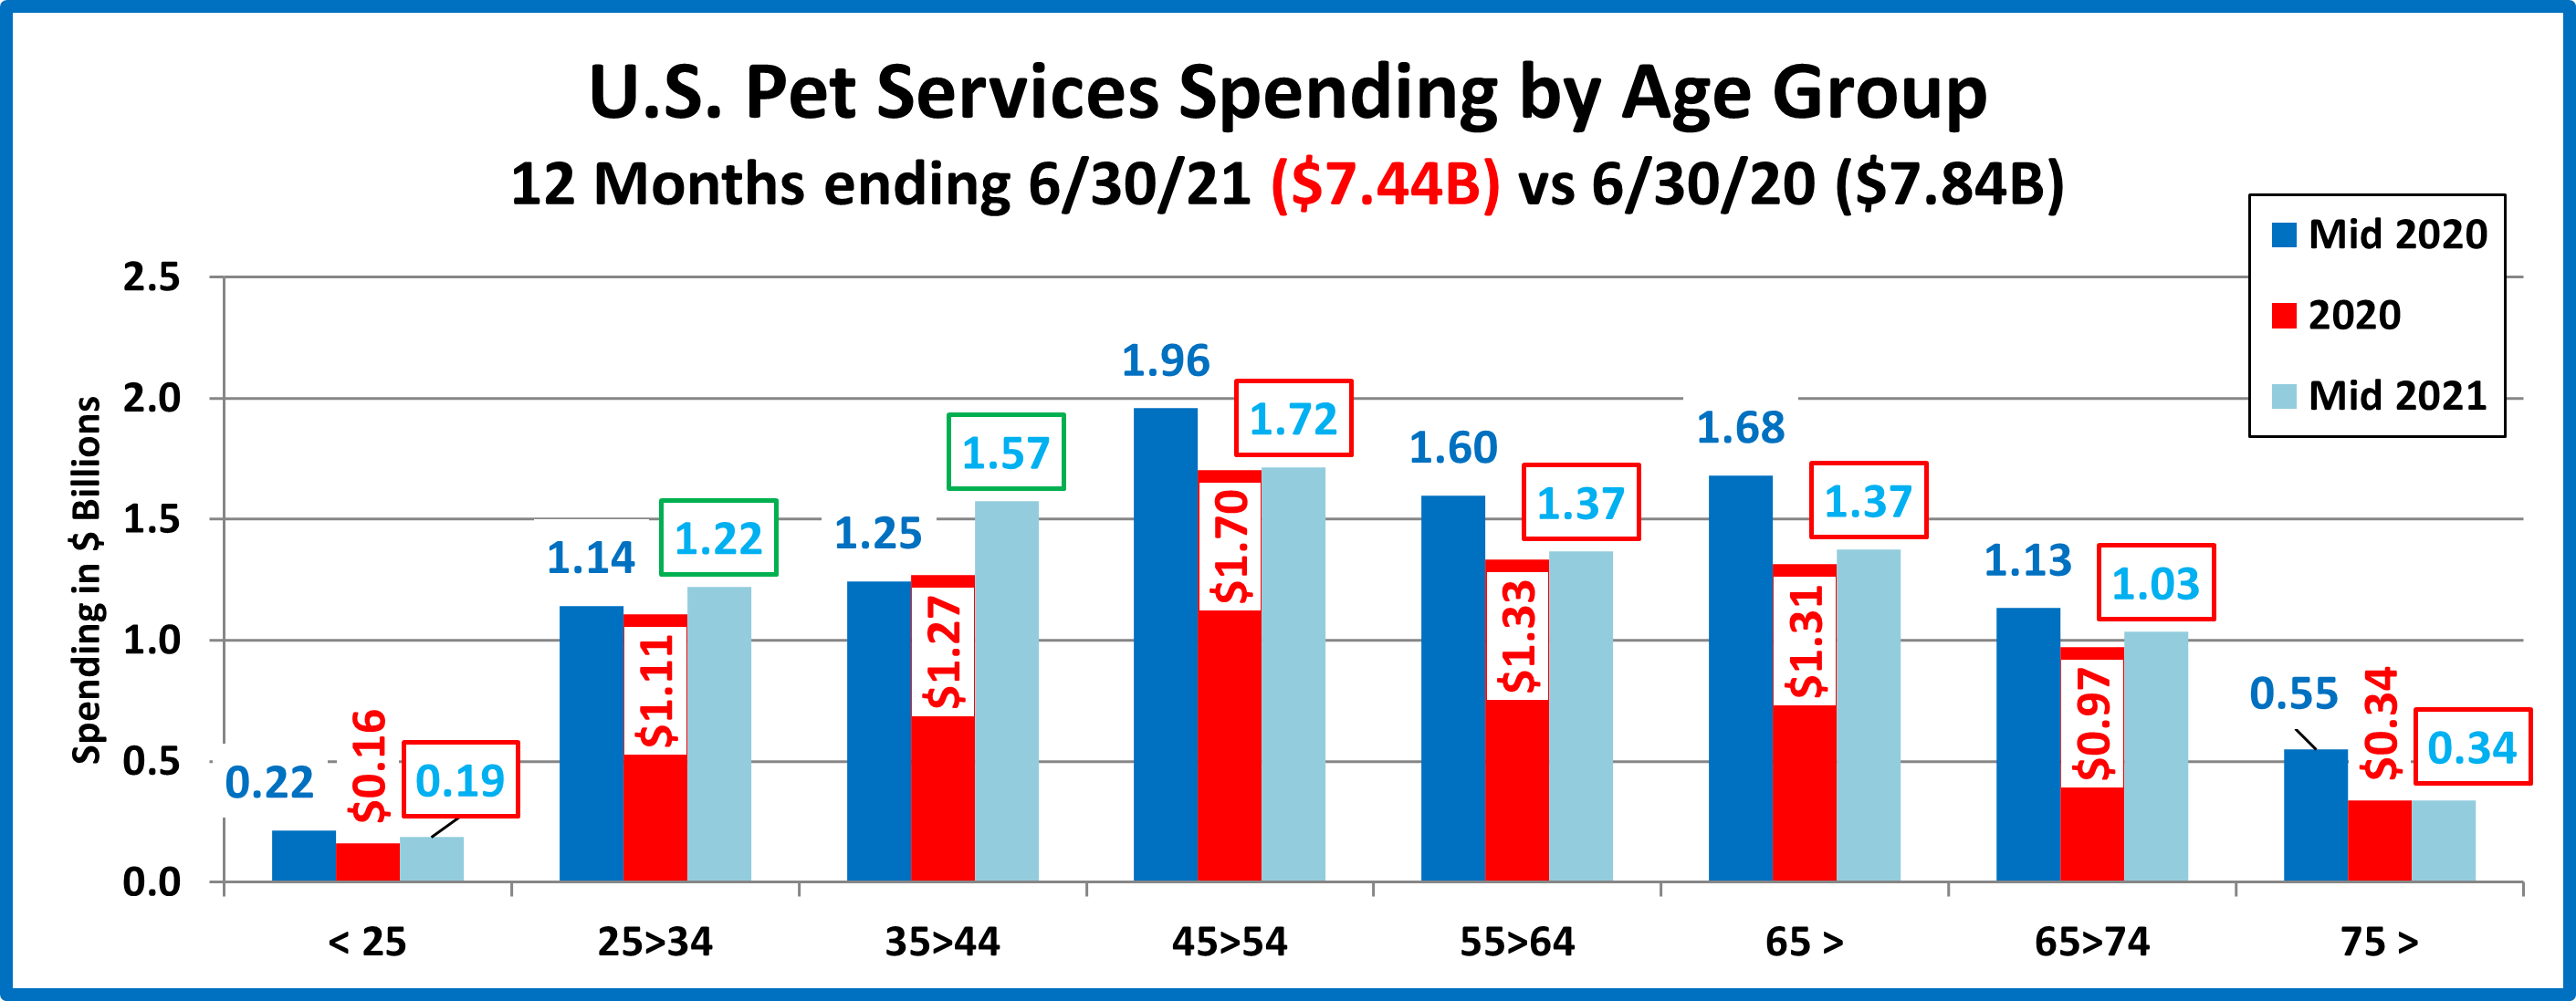
- Basically the 25>44 yr-olds spent more while everyone else spent less.
- Although their lift was minor this year, 25>34 are the only group with 2 consecutive mid-year increases.
- The 35>44 group had by far the biggest increase. They were up +$0.32B (+25.6%) for the year with a +$0.3B lift in the 1st half of 2021. They were the only group with increases in both halves.
- The older groups, 45>, continue to be the most negatively impacted by the pandemic. All spent less for the year and their increase in the 1st half of 2021 was minimal.
- All groups but 75+ did have a spending lift in the 1st half of 2021. Hopefully, the increase will grow in the 2nd
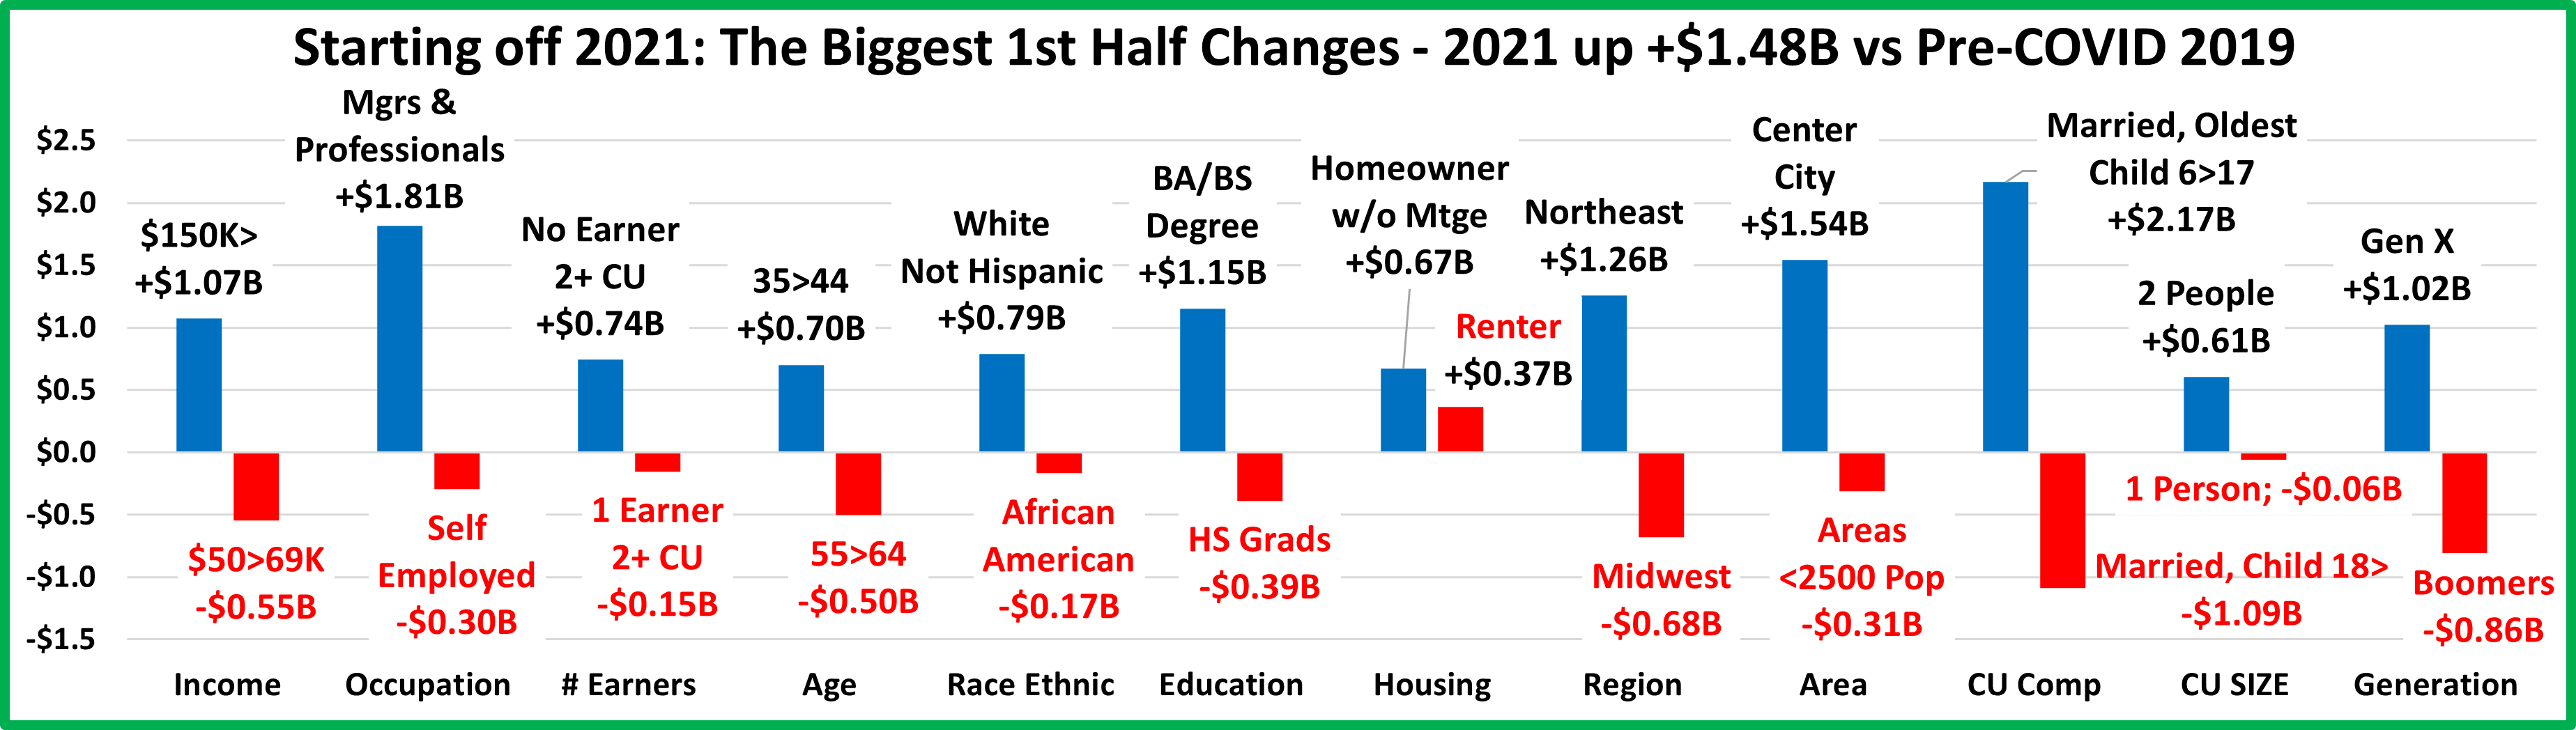
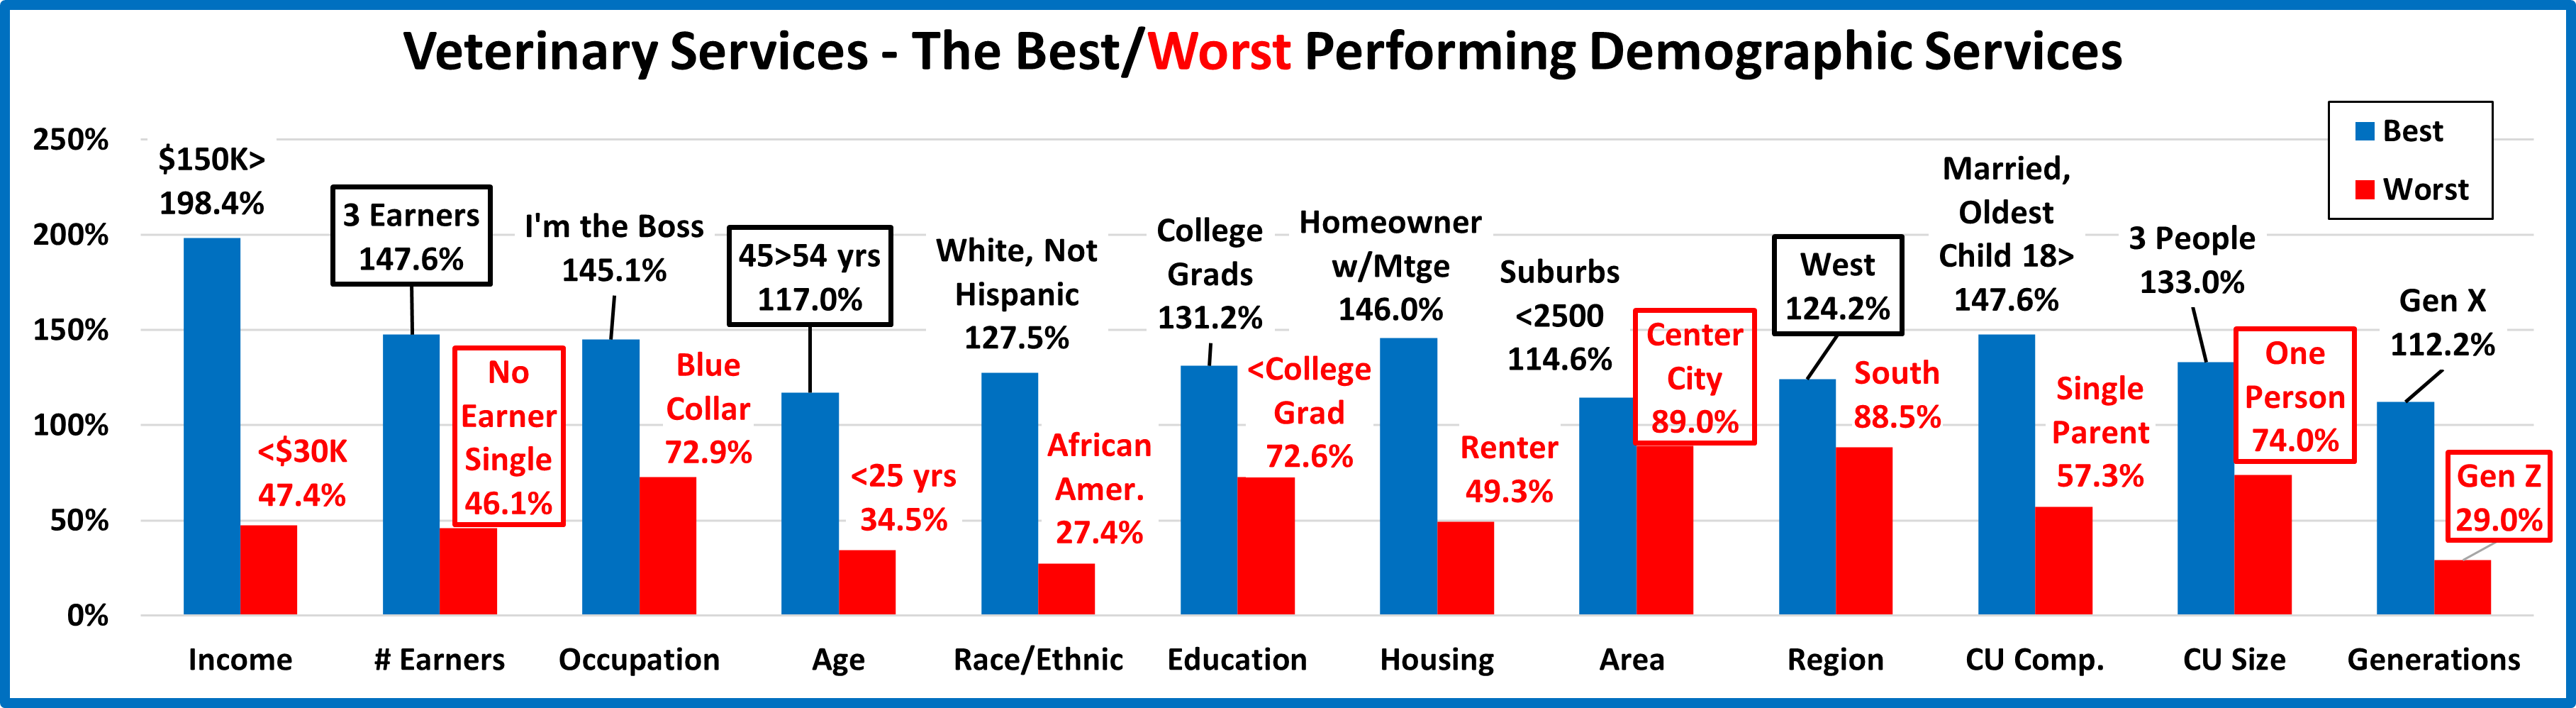
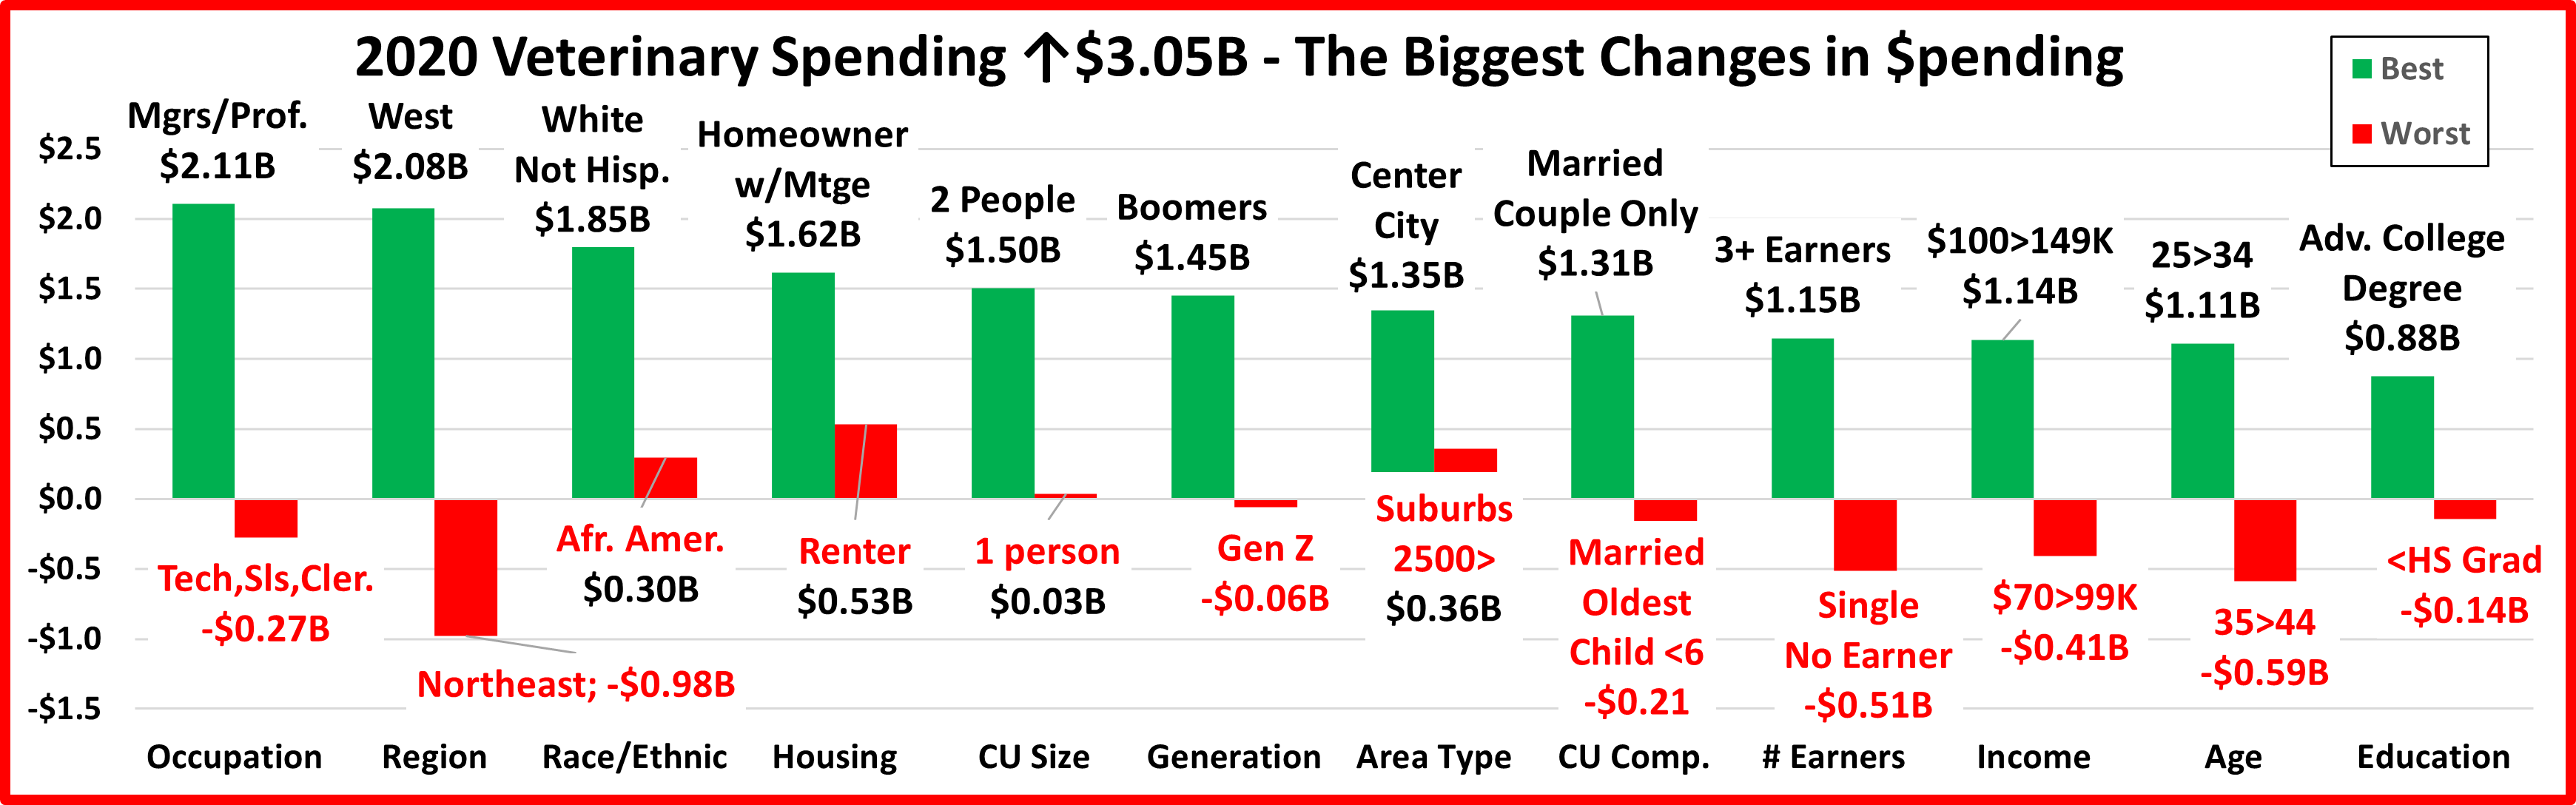
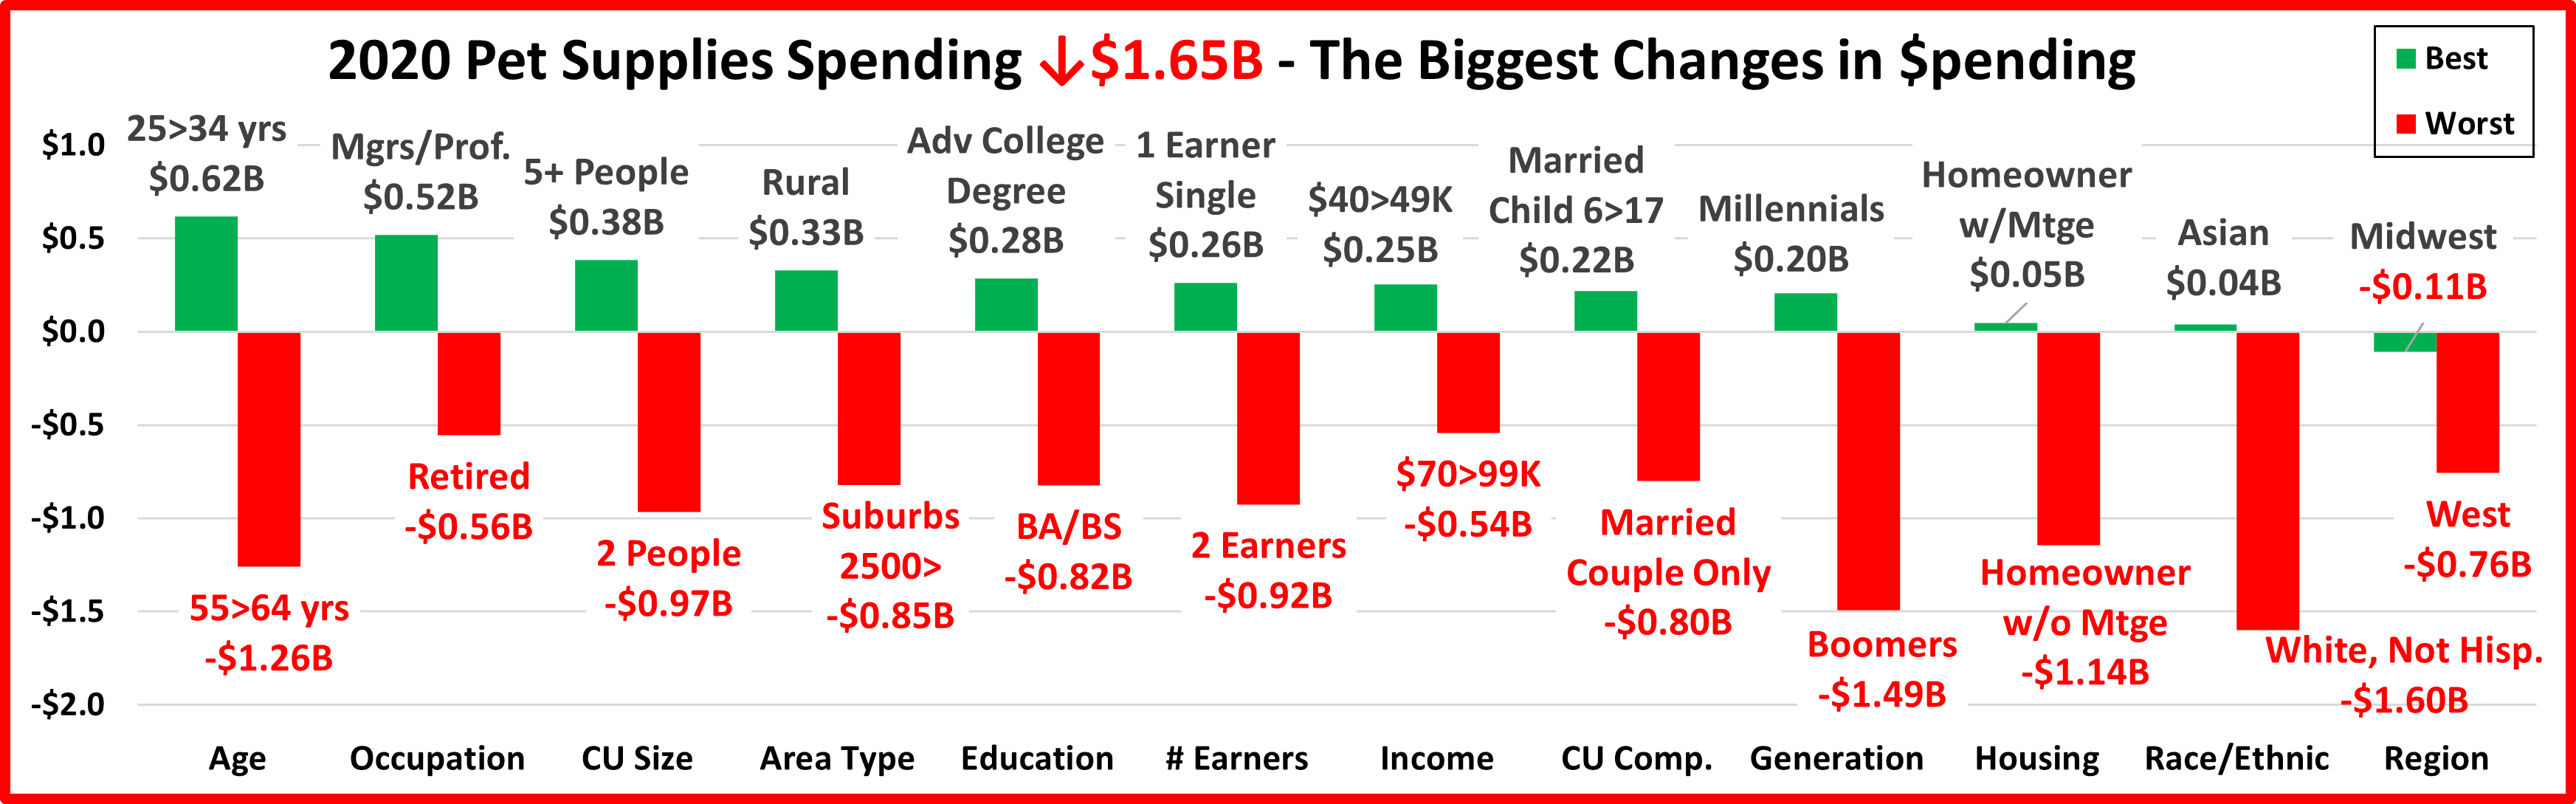
Now let’s look at what is happening in Pet Services spending at the start of 2021 across the whole range of demographics. In our final chart we will list the biggest $ moves, up and down by individual segments in 11 demographic categories. Remember, the lift in the 1st half of 2021 was +$0.55B, a big change from -$0.78B drop in 2020.

2021 has started much better than 2020 as the market begins to open up. In the Income category all segments spent more. Last year there were 4 categories in which all segments spent less on Services. Also, the $ changes from the winners are overwhelming larger than the negatives of the losers. The +$0.55B decrease in Pet Services came from 64 of 82 demographic segments (78%) spending more. Last year 88% spent less. The recovery is beginning and becoming more widespread.
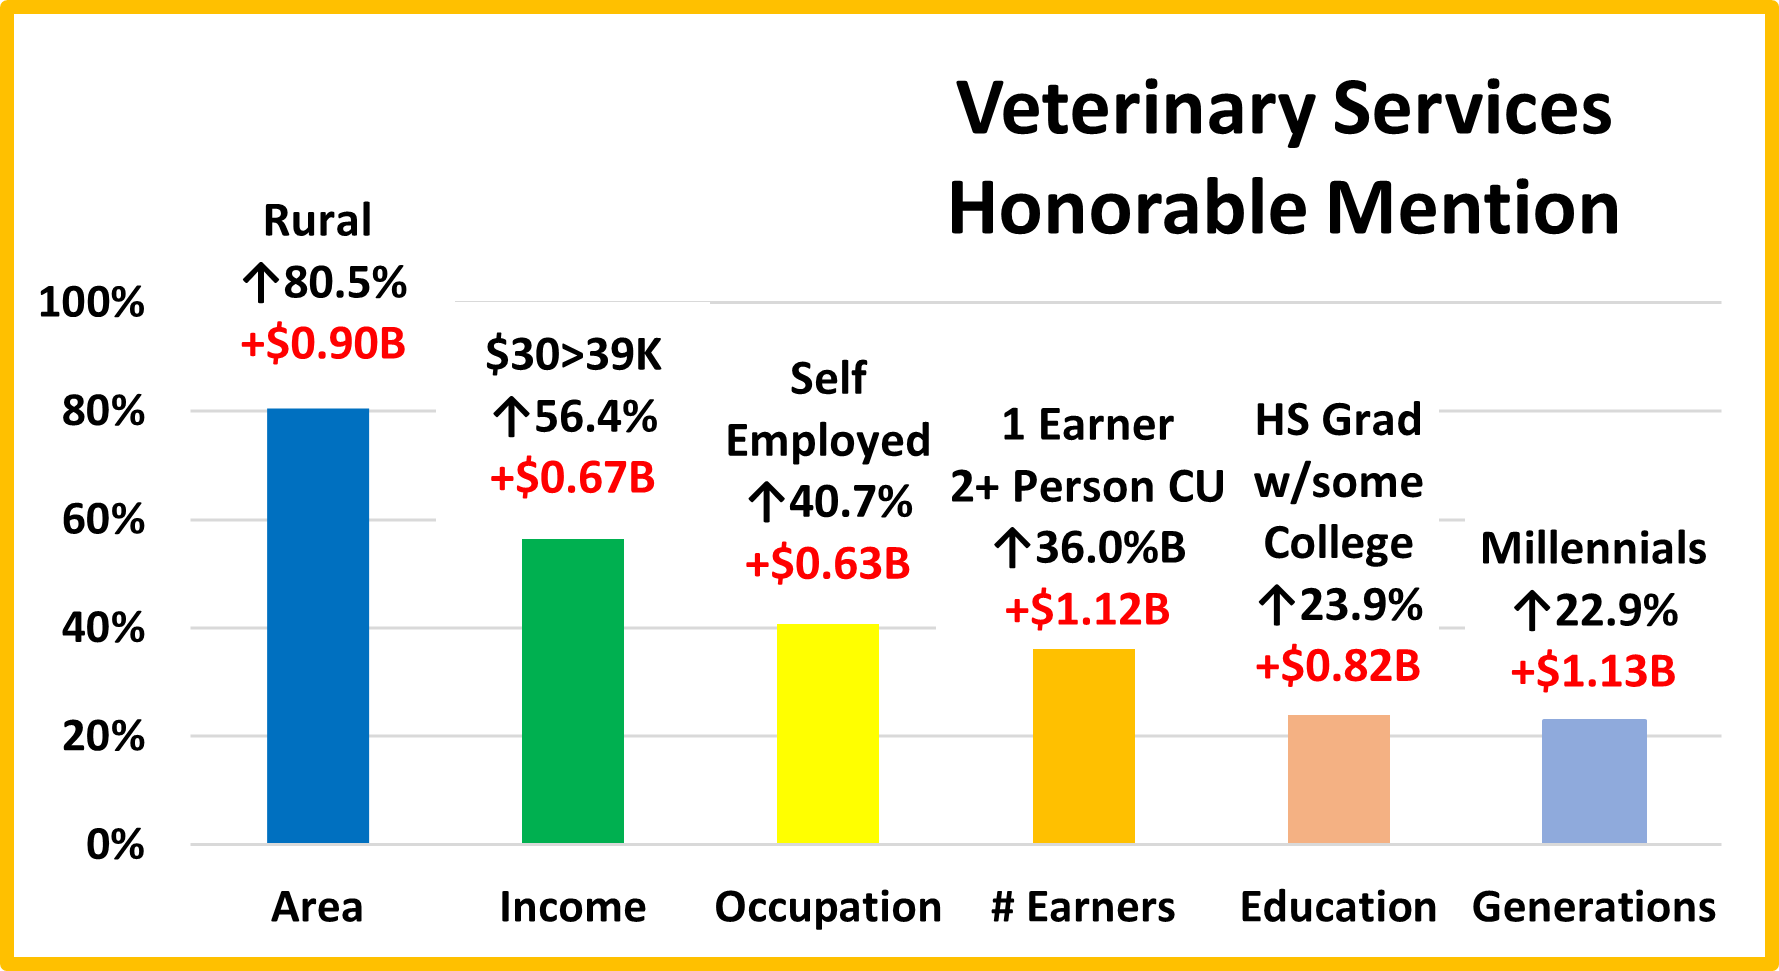
The usual winners have overwhelmingly returned but there are a couple of surprises:
- $50>69K
- 2+ Adults, No Kids
Most of the Losers are also expected. Here are the surprises:
- Self-Employed
- Suburbs 2500>
- Married, Couples Only
The younger groups are driving the 1st half lift which is demonstrated by the performance of Millennials, 35>44 yr-olds, 2 Earners and 2+ Adults, No Kids. The younger groups also had the best performance in the 1st half of 2020. Their importance continues to grow as the Baby Boomers must ultimately pass the torch.
Spending is turning up again. Let’s review how we got to this point and speculate on what comes next.
Except for the trauma caused by the Great Recession which hit Services in 2010>11, from 2000 to 2016 the Services segment had slow but consistent growth. The number of outlets also was increasing. Services were gaining in popularity and many retail pet stores were looking for a competitive edge over the growing pet product sales of online retailers. Afterall, you can buy product, but you can’t get your dog groomed on the internet. By 2017 the number of outlets offering Pet Services had radically increased. This created a highly competitive market and the inflation rate dropped to near record lows. Value conscious consumers saw that deals were available, and they took advantage of the situation. However, they didn’t increase the frequency of purchase. They just paid less. This drove overall Pet Services spending down in the 1st half of 2017. The segment started to recover in the 2nd half but not enough to prevent the first annual decrease in Pet Services spending since 2011. However, it was a start. In 2018, more consumers started to recognize the convenience offered by more outlets. The latest big food upgrade was also winding down. The result was that Services started a deeper penetration into the market, especially in the younger groups. The < 45 groups spent $1.47B more on Services in 2018, 74% of the total $1.95B increase in the segment. After such a big lift, a slight downturn in 2019 was not unexpected and it happened, -$0.1B. Then came 2020 and COVID. Although the consumer use of Services was becoming increasingly widespread, many Services outlets were deemed nonessential and were subject to pandemic restrictions and closures. Services Spending fell -$0.78B in the 1st half and -$0.95B in the 2nd half. This was a -$1.73B (-20.1%) decrease for the year and nearly wiped out the big gain made in 2018.
In 2021, things have opened up and Services spending began to rebound with a +$0.55B lift in the 1st half. What will happen in the 2nd half of 2022? Pet Services have become an important option that is exercised by an increasing number of Pet Parents. The growth in this segment should continue as we return to a new “normal”. We’ll get the yearend 2021 data in September