“Petflation” 2021 – A Closer Look at the CPIs for the Pet Industry
Inflation has made a lot of headlines recently. There have been year over year increases in the monthly Consumer Price Index (CPI) larger than we have seen in decades. In December 2021, overall prices were up 7.0% over December of 2020. Food for home consumption was up 6.5% and Gasoline prices went through the roof at +49.6%. That raises the obvious question, “What is happening in the Pet Industry?”
In this report we will attempt to answer that question? The simple answer is that prices for Total Pet Products & Services were 4.1% higher in December 2021 than in December 2020. That’s high, but still considerably better than the overall CPI increase. However, as usual, the answer is considerably more complex. We will look at the numbers in greater detail, including:
- Tracking the monthly changes in prices from December 2019 to December 2021
- Comparing the annual inflation rate for 2019 through 2021
- Comparing the December 2021 numbers to both 2020 and 2019
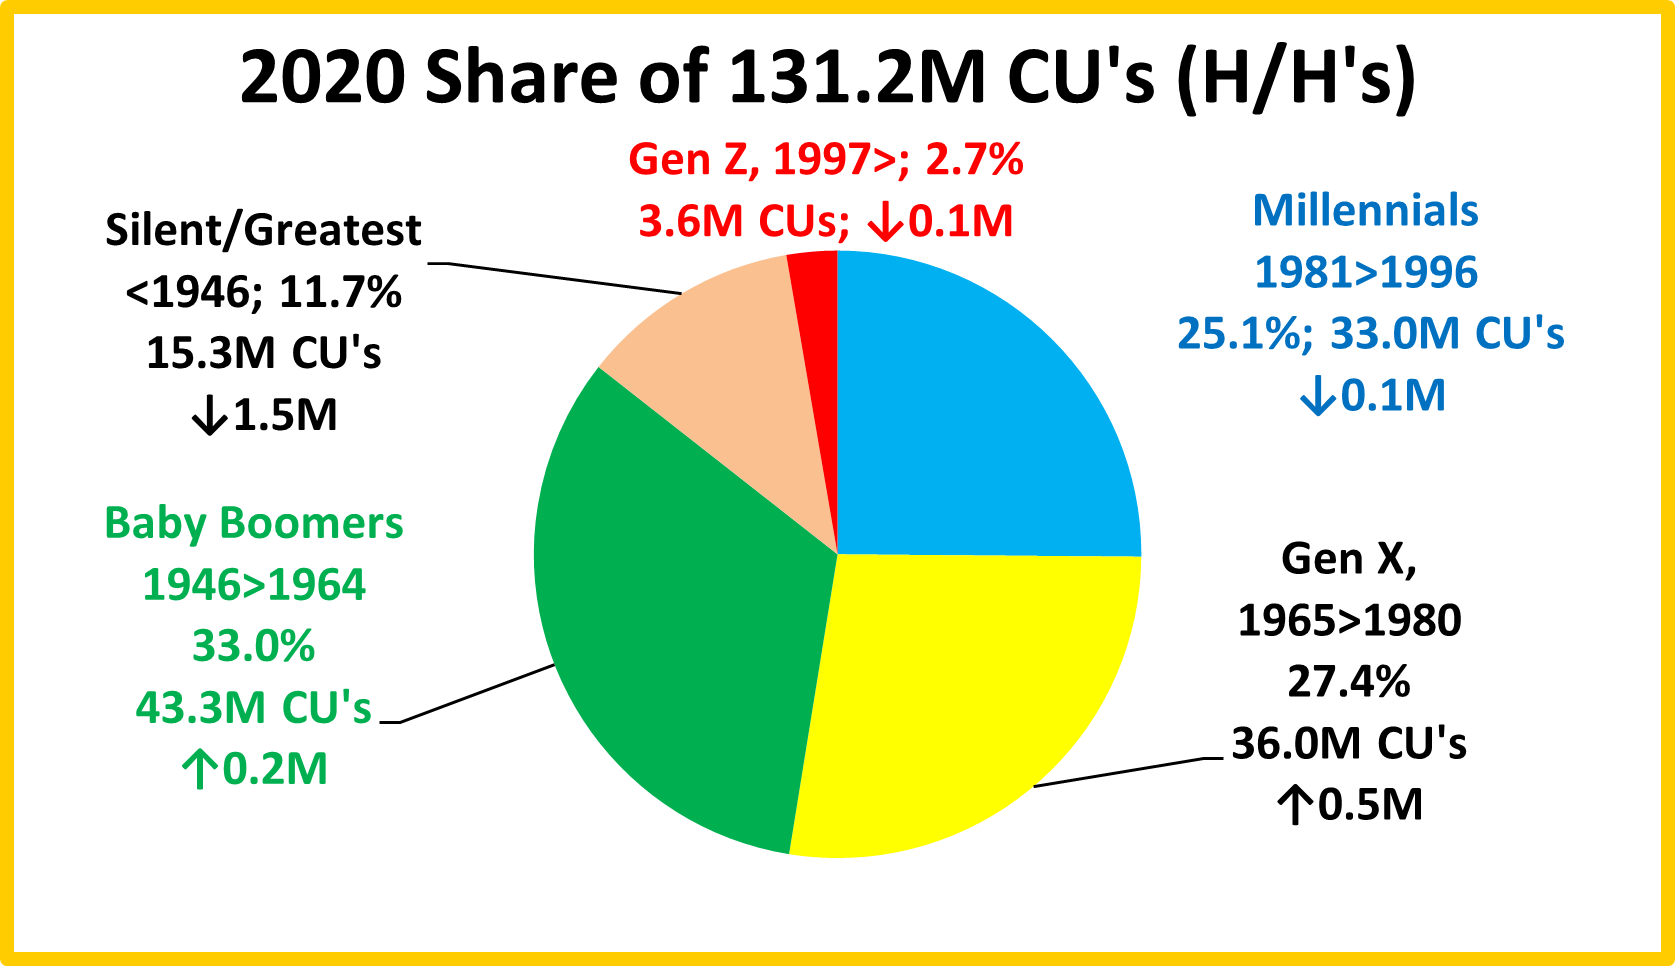
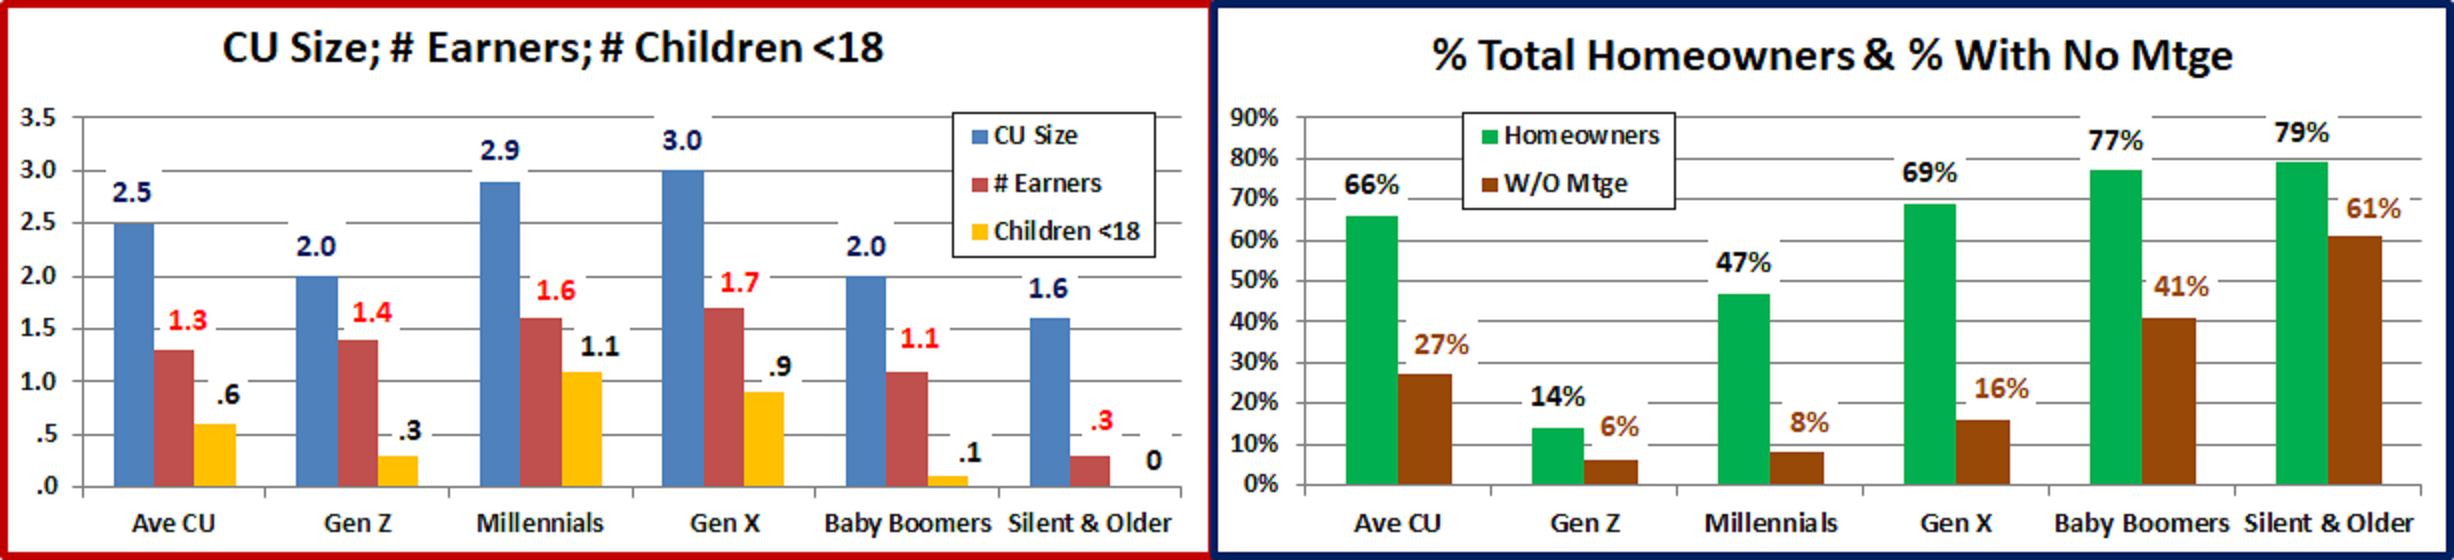
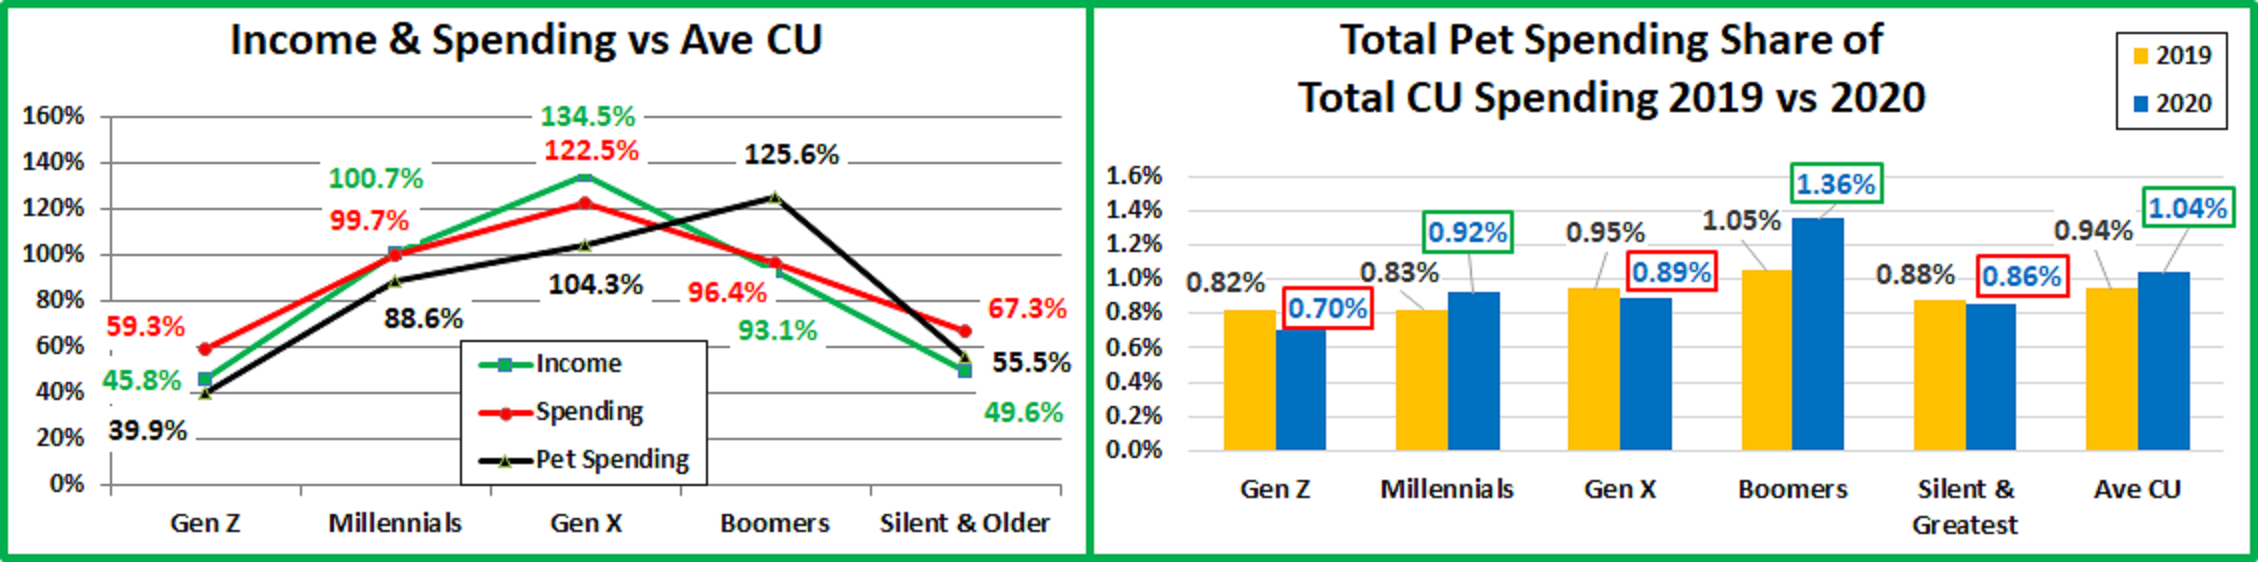
We will do this for Total Pet and all industry segments. We can now do this for all segments because on 2/11 the US BLS started reporting the CPI for Pet Services again. They had discontinued it at the start of 2021 because of problems caused by COVID. Upon learning of the discontinuation, we made the case for reversing this policy. We used their consumer spending data to craft a rationale to demonstrate the importance of the Pet Industry to U.S. Retail and the strong growth of the Services segment in recent years. We also pointed out the importance of Pets to U.S. families – 2/3 of U.S. H/Hs have a pet, twice as many as have a child under 18. They agreed with us and not only began publishing again but filled in all the missing monthly data for 2021. With that being said, let’s get started.
In our first graph we will track the monthly change in prices from December 2019 to December 2021. This is not designed to impart specific data, but rather to give you a visual image of the flow of pricing from the beginning of the pandemic through the retail recovery that the market experienced in 2021. You can see the similarities and differences in patterns between segments and compare them to the overall U.S. CPI. The end numbers, compared to December 2019 and some other key waypoints, like December 2021 are included.
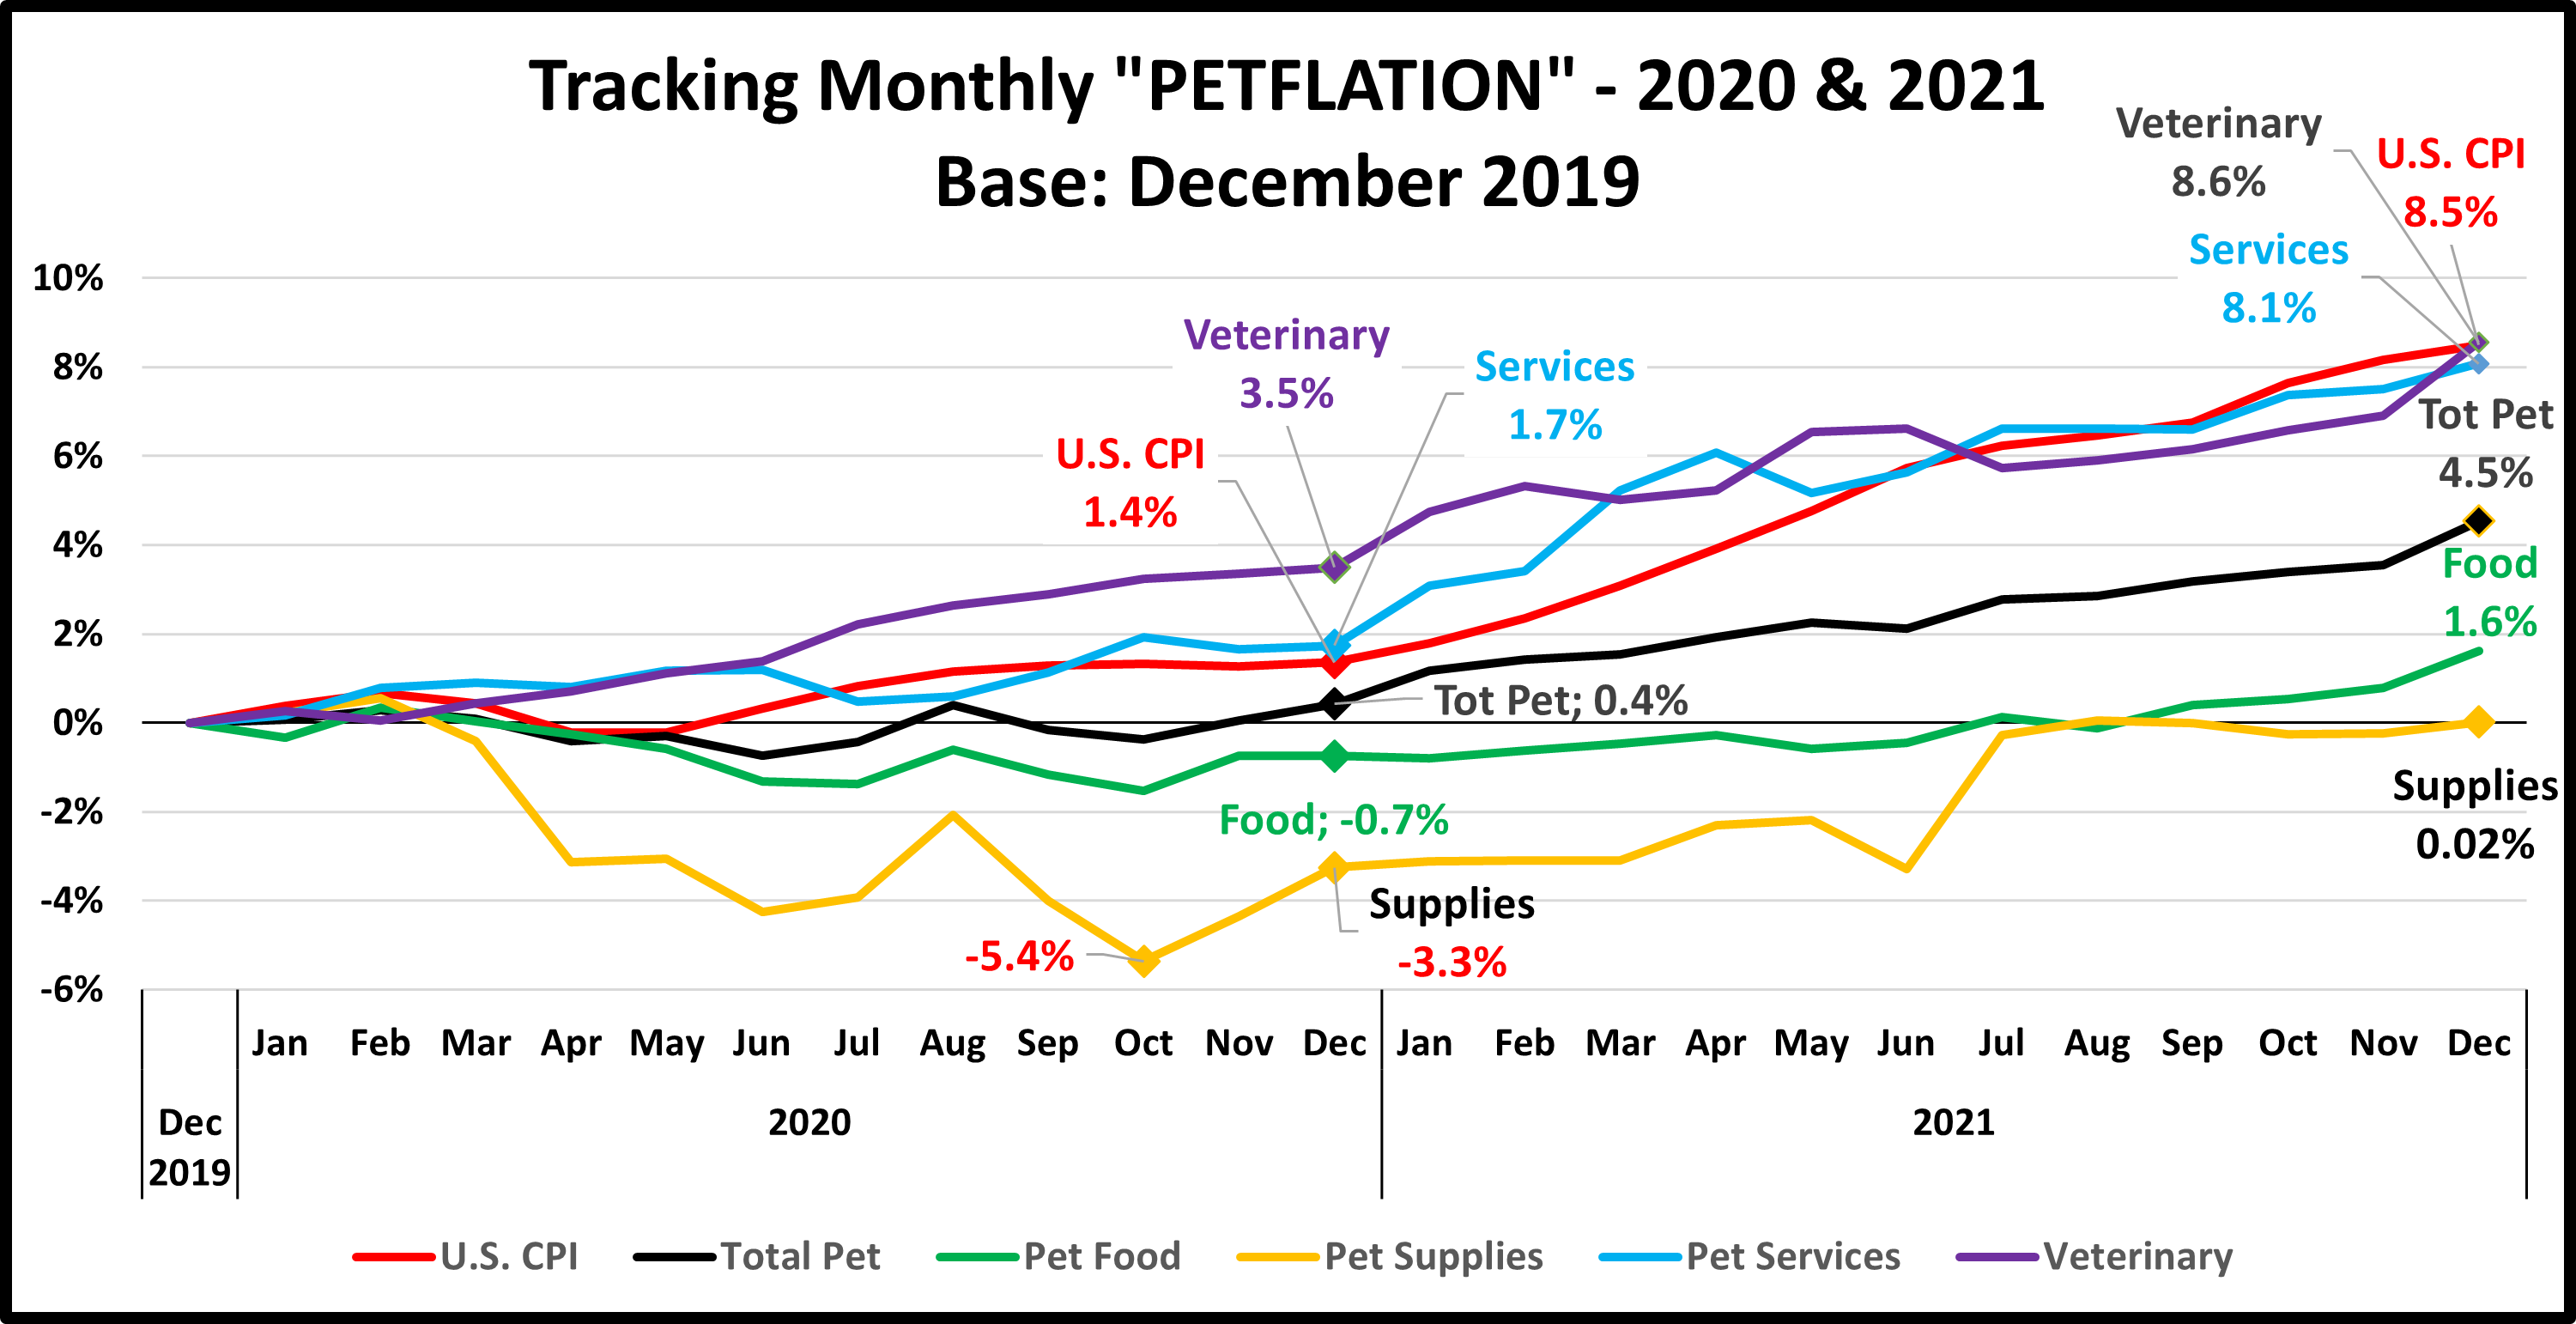
You immediately see a distinct difference in patterns between the 2 Services segments and the 2 Products segments. While there were some dips and differences, Veterinary and Services prices generally inflated during the whole 2-year period with an accelerated rate in 2021, a pattern similar to the overall CPI. Food and Supplies were generally deflated below December 2019 prices until mid-year 2021 when they turned slowly up. Here are some things to note:
- U.S. CPI – The inflation rate was low through 2020. It turned up in January and continued to grow steadily in 2021. 80+% of the overall 8.5% 2 year increase occurred in 2021.
- Pet Food – In April 2020 prices fell below December 2019. They stayed deflated until September 2021 when they turned up, with a sharp increase in December.
- Pet Supplies – First remember that Supplies prices were high in December 2019 due to the added tariffs implemented in late 2018. They had a “deflated” roller coaster ride until mid-2021 when they returned to December 2019 prices and essentially stayed there.
- Pet Services – A normal inflation rate is about 2+%. Despite or maybe because of closures, price increased at a lower rate in 2020. In 2021 consumer demand increased but there were probably fewer options. Prices increased strongly in 2021 with the biggest lift coming in the Spring.
- Veterinary – Inflation has always been something that you can count on in Veterinary Services. Prices started moving up at the start of the pandemic and grew consistently through the 2021 recovery. A price spike in December allowed them to edge out the overall CPI and win the top spot in inflation at +8.6%.
- Total Pet – You can see that the blending of the segment patterns make the Pet Industry look very price calm compared to the overall market. Inflation was basically nonexistent in 2020 but grew slowly and steadily in 2021.
We’ve seen the overall CPI patterns by month over 2 years. Now, let’s turn our attention to the annual CPI. We will use pre-COVID 2019 as our primary base year and we’ll add in Human Food for comparison. We will show these CPI changes:
- 2018>19
- 2019>20
- 2020>21
- 2019>21
- Avg Chge 19>21
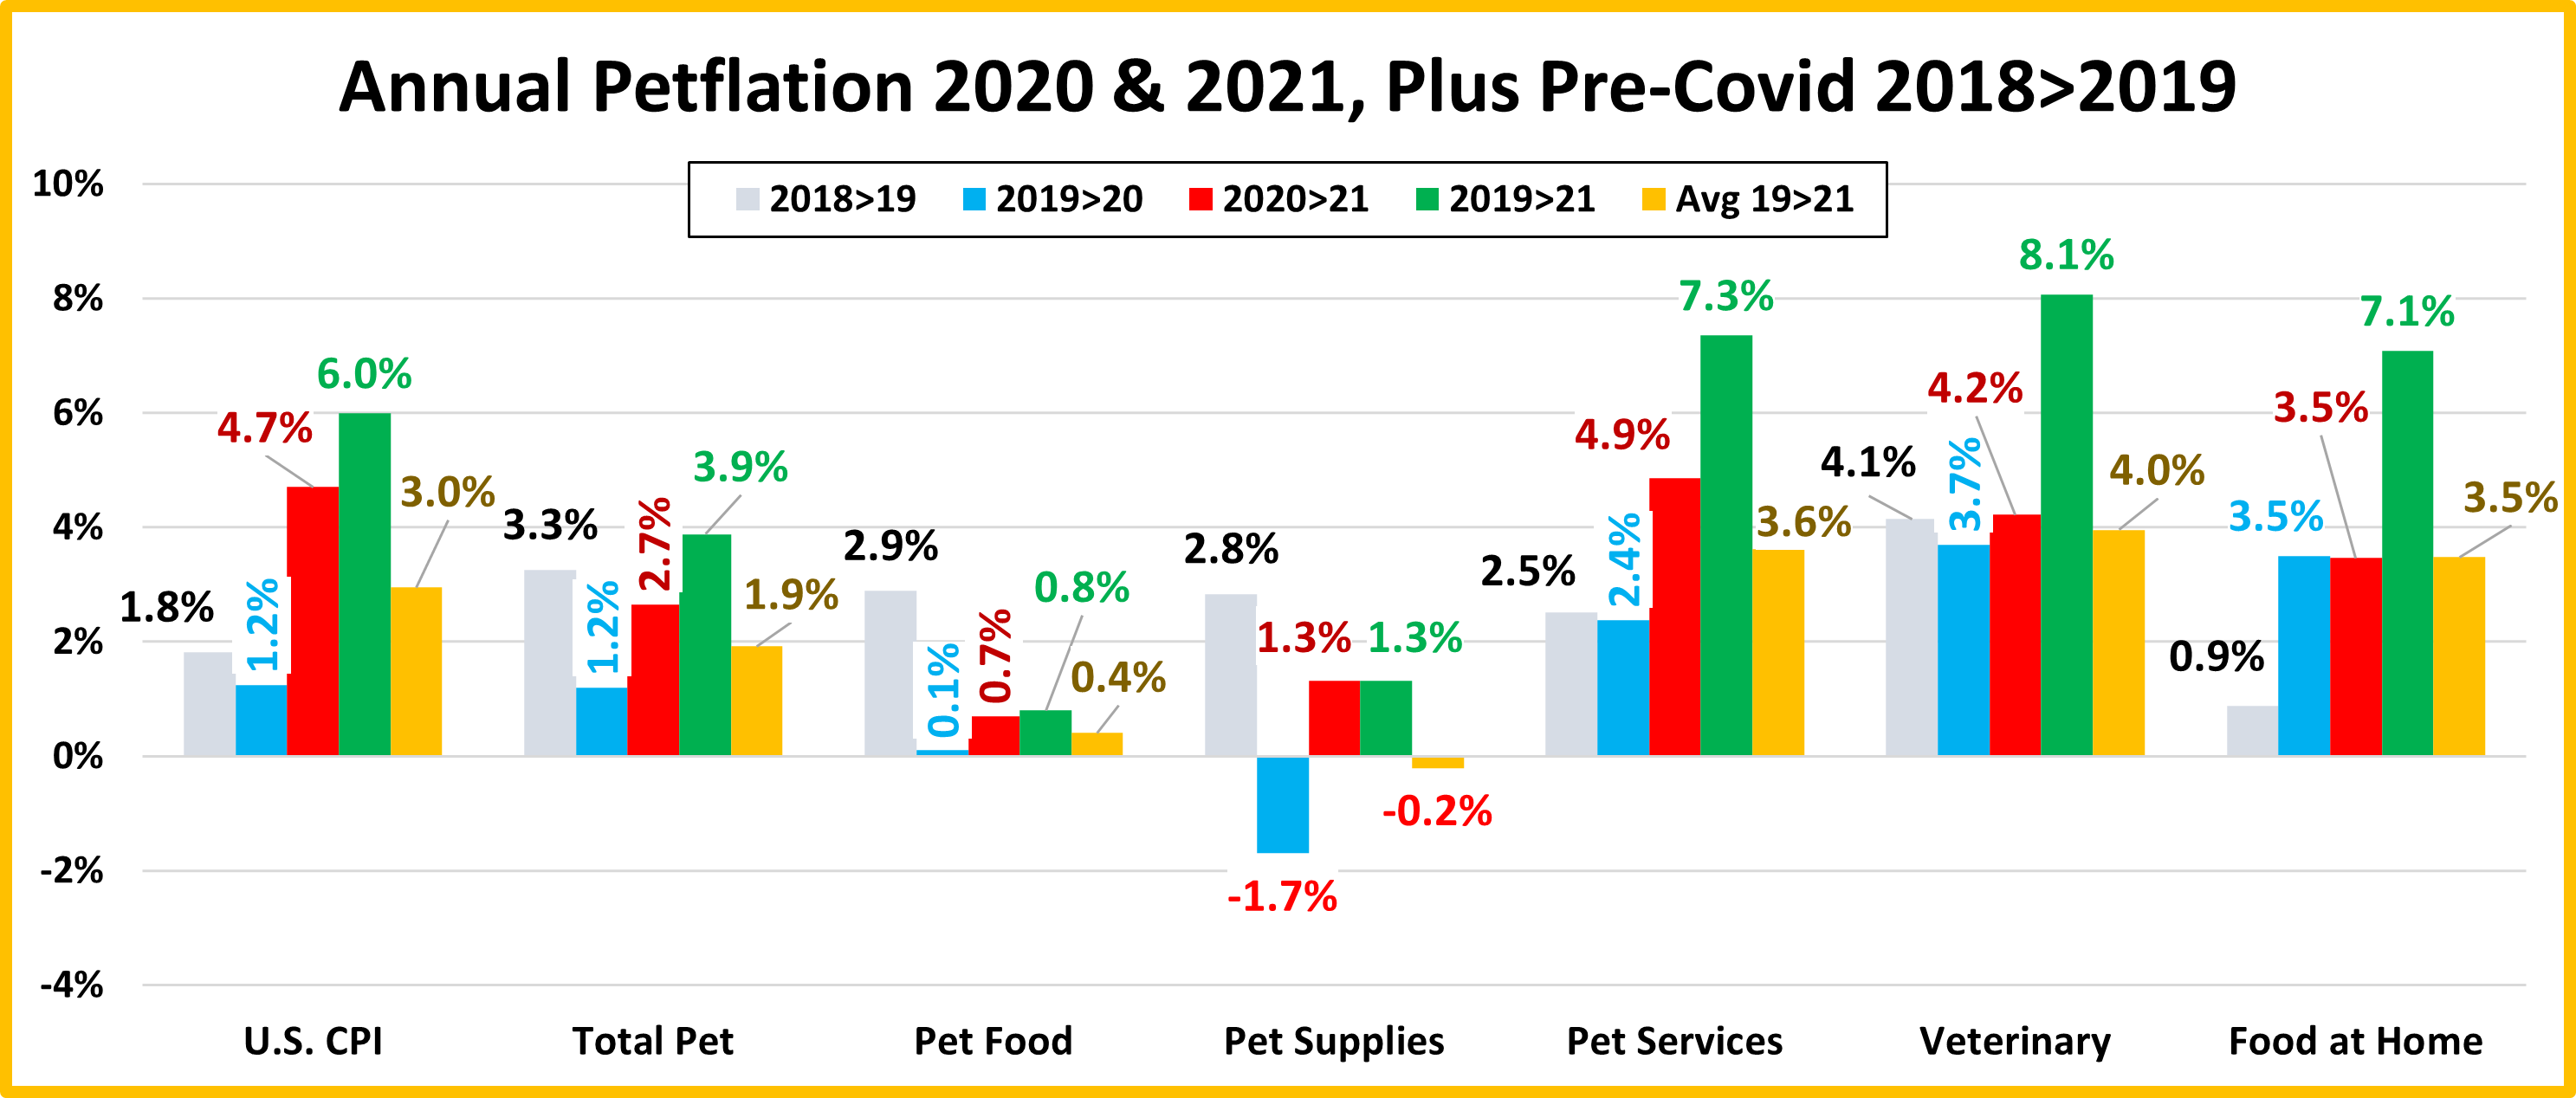
The 2 Pet Services segments are driving recent inflation in the Pet Industry. This is usually the norm. Prior to the pandemic Pet Food & Supplies were going through an unusual period of inflation. In Pet Food the FDA, warning was a factor and Supplies were suffering from Tariffs. The Services Segment is the closest match to the overall CPI pattern.
- U.S. CPI – Inflation slowed to 1.2% in 2020 due to the pandemic, then the rate nearly quadrupled to 4.7% in 2021. The average rate from 2019>2021 was 3.0%, about 50+% higher than a normal year.
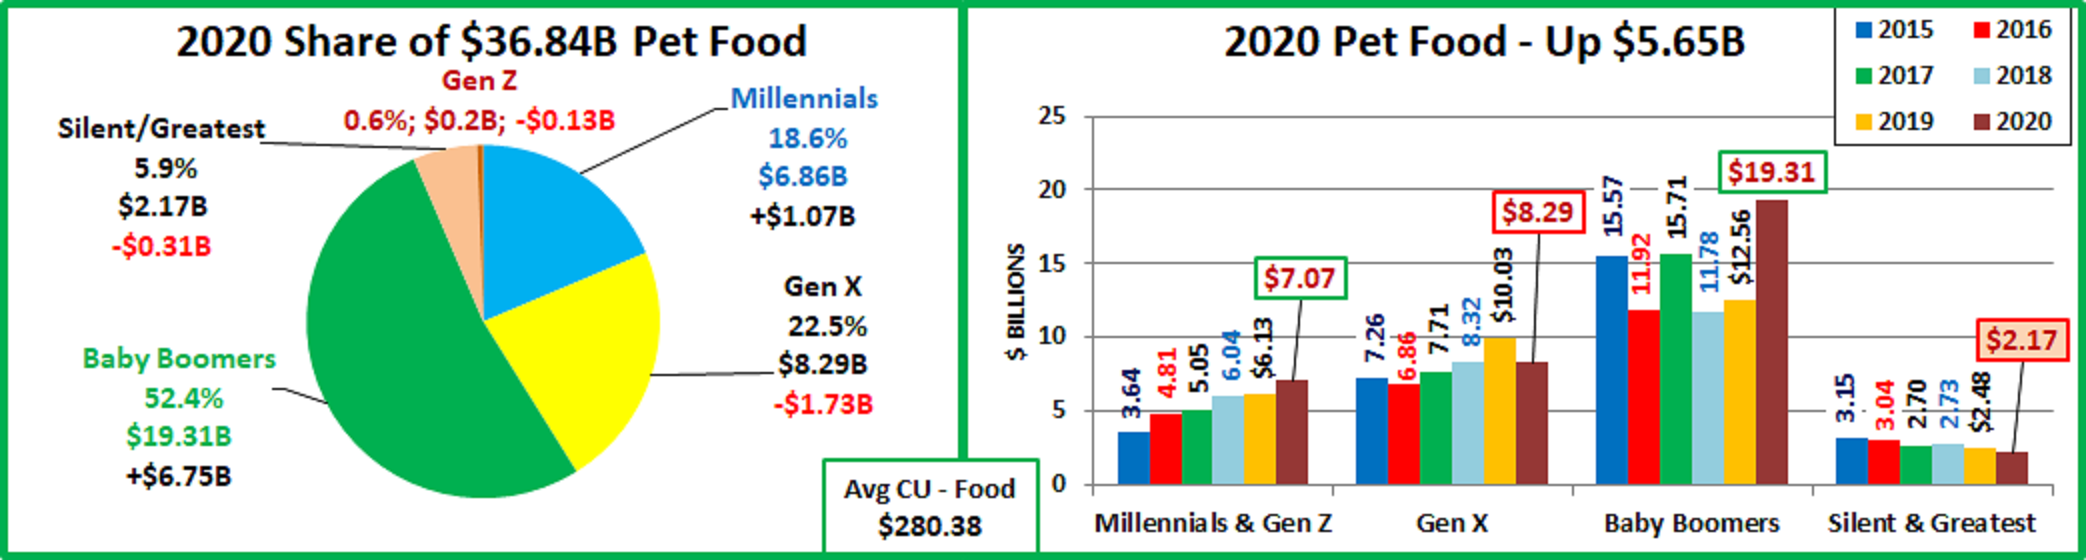
- Pet Food – In 2020, prices basically stayed at the elevated 2019 level. They turned up in 2021 but inflation stayed below 1%, which generally would have little to no impact on spending.
- Human Food at Home – You see the pandemic impact here. The 2020 inflation rate of 3.5% was 4 times that of pre-COVID levels, probably due to shortages. The rate stayed the same in 2021, showing that problems weren’t fixed.
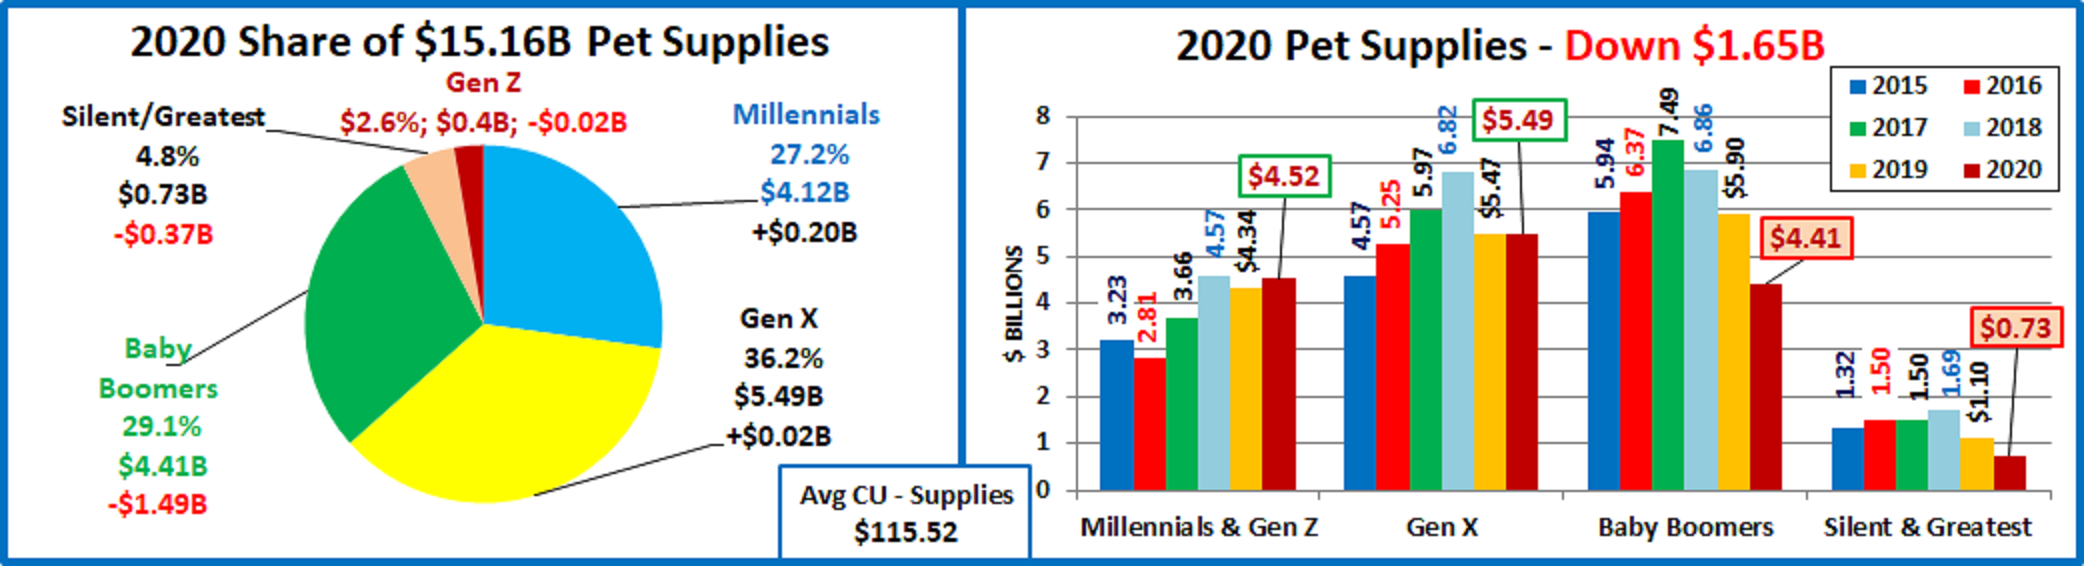
- Pet Supplies – As we said, prices were at an abnormally high level prior to the pandemic. This discretionary, largely commoditized segment is impacted by pricing. Despite the 2020 drop, sales fell as consumers focused on Pet needs. Inflation returned in 2021 and prices were near 2019. We’ll see if the wants/needs of Pet Parents will overcome this.
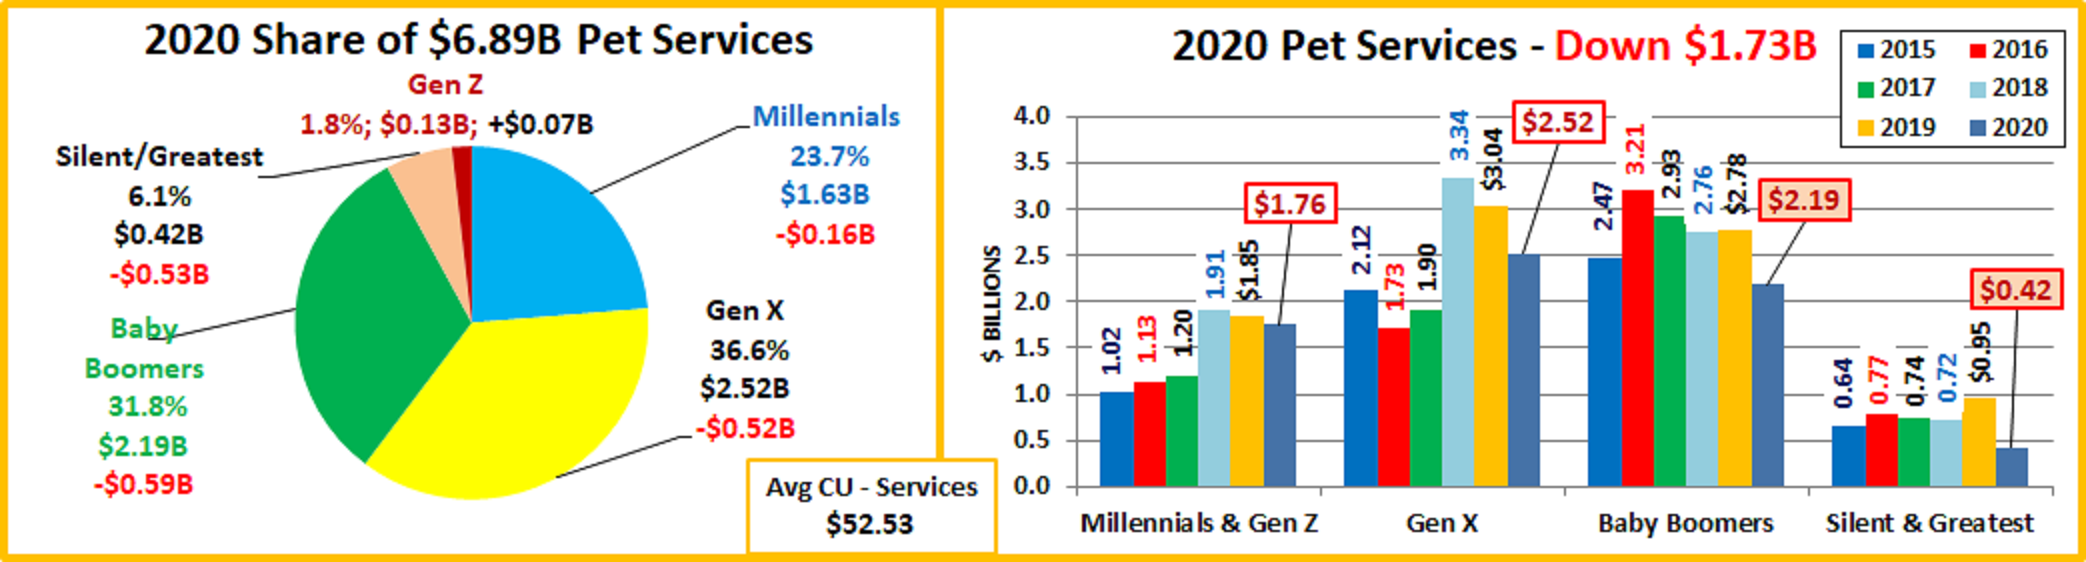
- Pet Services– 2020 inflation was near normal, but the segment was most affected by closures. By 2021, outlets were open but fewer options drove prices up at twice the normal rate. The $ will likely grow because there is still a need.
- Veterinary – This pet segment traditionally has the highest inflation rate. In recent years, it has caused Pet Parents to reduce the frequency of visits. Much of the growth has come from price increases. The pandemic had little impact on inflation. Inflation slowed in 2020 but then a grew slightly in 2021. The rate stayed about 4.0%. The segment did benefit from the pandemic. Pet Parents focused on needs. They spent more at the Vet and visited 1.8% more often.
- Total Pet – The deflation that happened in the Product segments offset the inflation in the Services segments, keeping inflation below pre-pandemic 2018>19 levels and in virtually all measurements vs the overall CPI.
Next, we’ll turn our attention to the headlines, which largely focus on the inflation rate from December 2020 to December 2021. We’re going to look a little deeper to see how the recent numbers compare to the past, including:
- 2018>2019
- 2019>2020
- 2020>2021
- 2019>2021
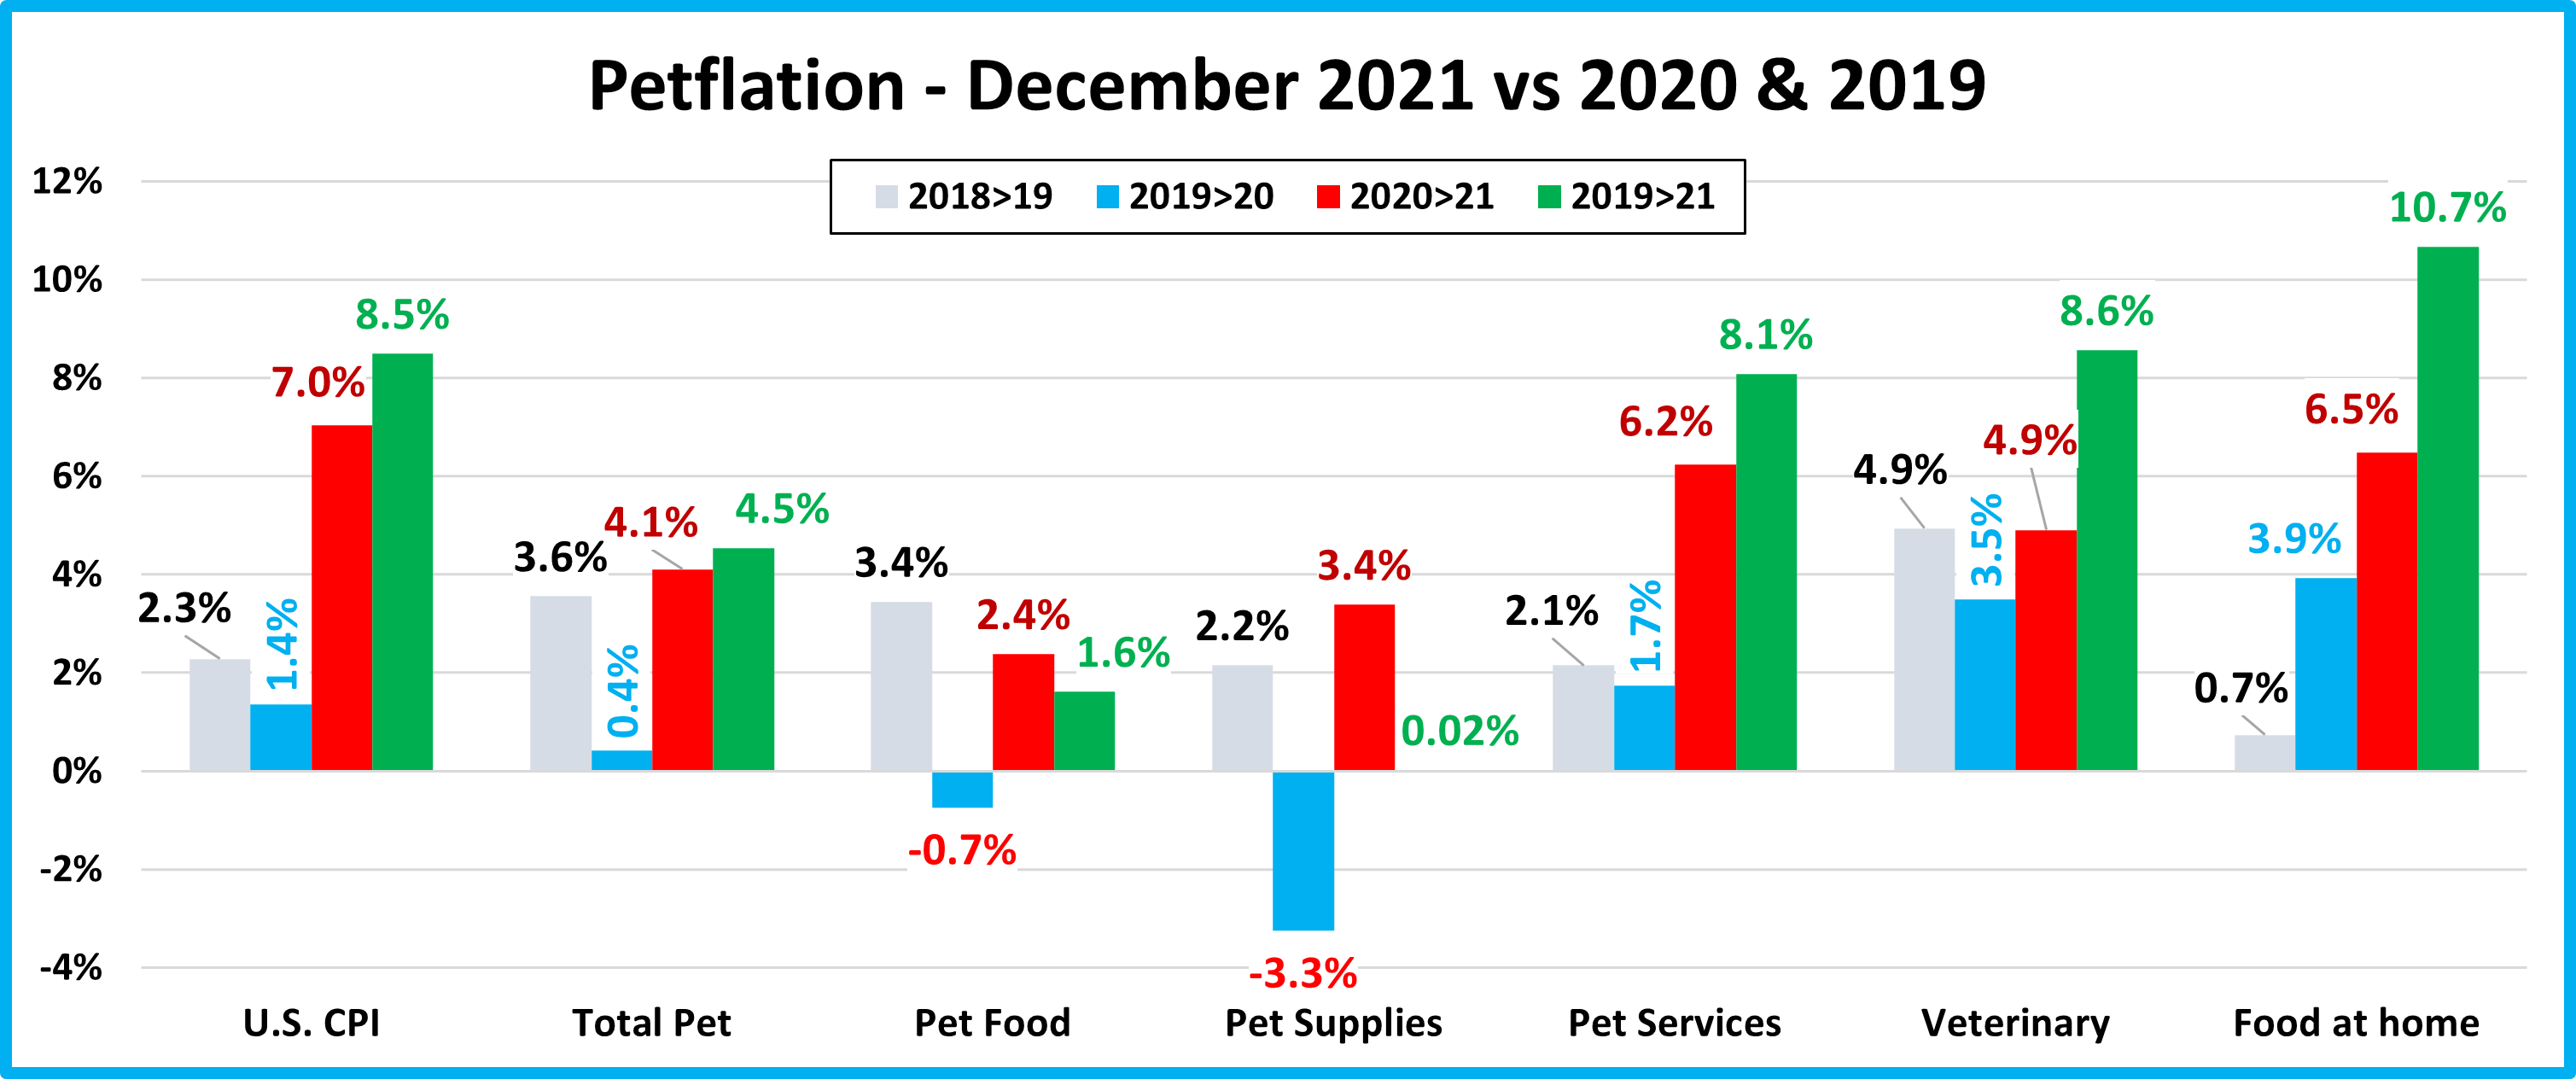
One thing is certain. The inflation rate from December 2020 was huge for every group in the chart, providing most, and in some cases, all of the price lift since pre-pandemic 2019.
- U.S. CPI– The price surge was huge – more than 3 times the lift from 2018>19 and 5 times the lift from 2019 to 2020.
- Pet Food – Although the 20>21 lift was less than pre-pandemic 2018>19, it was a complete reversal from the drop that occurred in 2020.
- Food at Home – Decembers in 2020 and 2021 have been bad news for grocery prices. The rate from 2019>2020 was spectacularly high at 3.9% but 2021 saw this grow to 6.5%, a 67% increase. In 2 years, prices are up 10.7%.
- Pet Supplies – Talk about a flip flop. The increase in 2021 essentially wiped out the drop in 2020 – Net: no gain/loss.
- Pet Services – Services prices increased from 2019>2020 but at a slower than normal rate. From 2020>2021 the inflation rate was 5 times higher than the previous year and fueled more than ¾ of the 8.1% increase since 2019.
- Veterinary – Once again the increase rate slowed a little in 2020, then returned to normal in 2021.
- Total Pet – The 2021 increase in all segments pushed Total Pet inflation above the 2018>19 rate and was responsible for 91% of the 4.5% lift from 2019.
That wraps it up for this Petflation Update. Price matters to everyone. Combined with quality, it defines Value, which is the top driver in consumer spending behavior. Inflation/deflation can discourage/encourage spending, especially in the more discretionary categories, like Pet Supplies. Overall, pricing in the Total Pet Industry appears to be faring reasonably well. 20/21 data for Total Pet is lower than the data for the total U.S. CPI in virtually all inflation measurements. However, as I have always said, look beneath the surface to see what is truly happening. When we do that, we see pricing trends that basically divide the segments into 2 groups – Services and Products. Prices in the Services group, Non-Vet and Veterinary have strongly inflated, especially in 2021. In the Products group – Food and Supplies, prices were high before the pandemic. The result was that prices stayed near or below the 2019 level until mid-year 2021. Then they turned up but not as much as in the Services Group. The Product group accounts for over 60% of Industry $ so their trend was very influential in keeping Total Pet inflation at a more reasonable level. The media was right about 1 thing. December was a terrible month for inflation. Prices in every Pet segment turned sharply up.
Of note, inflation continued in all segments in January 2022 with Supplies prices passing their previous record high set in September 2009. We’ll see what the rest of 2022 brings.