2021 Pet Food Spending was $34.41B – Where did it come from…?
As we continue to drill ever deeper into the demographic Pet spending data from the US BLS, we have now reached the level of individual Industry segments. We will start with Pet Food, the largest and arguably most influential of all. We have previously noted the trendy nature of Pet Food Spending. In 2018 we broke a pattern which began in 1997 – 2 years up then spending goes flat or turns downward for a year. We expected a small increase in 2018 but what we got was a $2.27B decrease (-7.3%). This was due to the reaction to the unexpected FDA warning on grain free dog food. A pattern of 20+ years was broken by 1 statement. The grain free warning lost credibility and spending rebounded in 2019, +$2.35B (+7.1%). In 2020 the market was hit by an even bigger outside influence – the pandemic. The impact varied by segment. In Pet Food, it created a wave of panic buying out of fear of shortages, resulting in a $5.65B (18.1%) lift. The panic buying wasn’t repeated in 2021 resulting in a $2.44B (-6.6%) drop in spending.
First, we’ll see which groups were most responsible for the bulk of Pet Food spending and the $2.44B decrease. The first chart details the biggest pet food spenders for each of 10 demographic categories. It shows their share of CU’s, share of pet Food spending and their spending performance (Share of spending/share of CU’s). 1 group is different from Total Pet – 45>74, as food spending skews slightly older. The categories are presented in the order that reflects their share of Total Pet Spending. There are other differences from Total Pet. First, being Married is more important in Food spending than in Total Pet. Income is the most important factor in both, but the # of earners in a CU matters very little in Pet Food spending. Food spending is also a little more balanced than Total Pet Spending. This is evident in the fact that the Performance of all groups but Homeowners, Married Couples and White, Not Hispanic is significantly lower for Food. Also, Age & # Earners do not reach the 60% targeted market share for Food. In 2020, Pet Food accounted for 70.8% of Pet Products $ and 44.0% of Total Pet. In 2021 the Food share fell to 59.1% in Products and 34.4% of Total Pet. After the Food binge in 2020, Pet Parents caught up on their children’s needs in other industry segments.
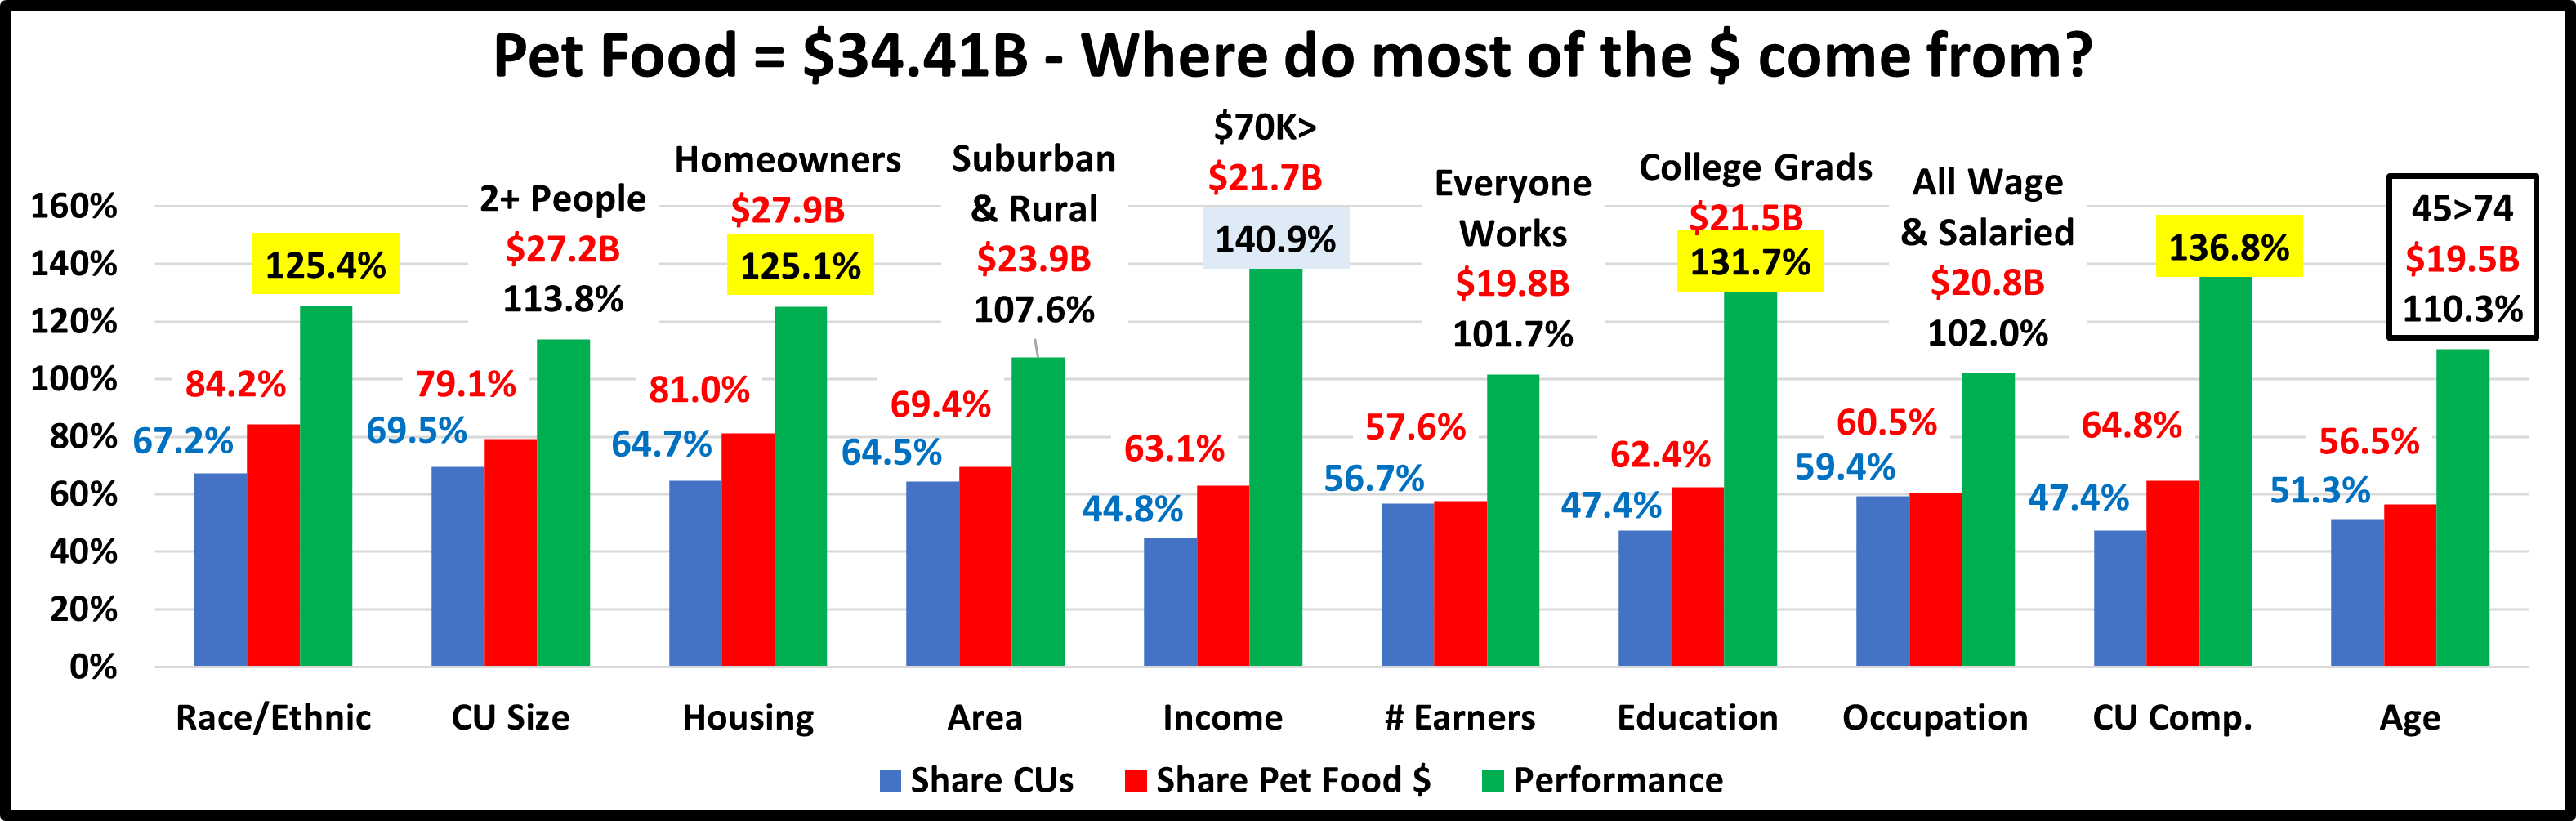
- Race/Ethnic – White, not Hispanic (84.2%) – down from 88.8%. This large group accounts for the vast majority of spending in every segment. They lost share and their performance decreased to 125.4% from 129.9%, but this category moved up from #6 to #4 in terms of importance in Pet Food Spending demographic characteristics. While Hispanics, African Americans and Asian Americans account for 32.8% of U.S. CU’s, they spend only 15.8% of Pet Food $. However, this is up from 11.2% in 2020. African Americans were the only minority to spend less on Pet Food in 2021. Hispanics and Asians spent $1.9B more.
- # in CU – 2+ people (79.1%) – down from 82.5%. The share of market for 2+ CU’s is no longer over 80% for Pet Food but is at that high level for Supplies, Services and Total Pet. Their performance fell from 117.5% to 113.8% but their rank increased from 9th to 6th. In a reversal from 2020, 4 & 5+ CUs drove the decrease (-$8B). However, both still performed above 100%. 2 person CUs had a $3.8B lift and 3 Person CUs spent $1B more. Singles also had a $0.8B (+11.7%) increase which was a big factor in the drop in share and performance by 2+ CUs.
- Housing – Homeowners (81.0%) – down from 86.7%. Homeownership is a huge factor in pet ownership and pet spending. In 2021, homeowners lost the share gained in 2020 and their performance fell from 131.7% to 125.1%. However, homeownership stayed in 5th place in terms of importance for pet Food spending. Those w/mtge spent $4B more but it was not enough to overcome the $8B drop from those w/o mtge. Renters also had a $1.6B increase.
- Area – Suburban + Rural (69.4%) down from 77.8%. Their performance fell from 123.4% to 107.6%. (8th) While the big (2500>) suburbs and center city spent $3.9B more, areas <2500 spent $6.3 less – another big reversal.
- Income – Over $70K (63.1%) – down from 65.3%. Their performance rating also fell from 150.2% to 140.9% but they moved from 2nd to 1st in importance. High income is very important in Pet Food Spending but the bar was lowered slightly in 2021. The biggest factor was the $8.9B spending drop by the $100>149K group. They led the way in 2020 binge buying. The $150K> group spent $4.1B more and the $70>99K group had a good year, +$2.5B. In fact, the only other income group besides $100>149K to spend less on Pet Food was $30>49K, -$1B. Pet ownership is common across all income levels but in 2021 higher income is still critically important in Pet Food Spending.
- # Earners – “Everyone Works” (57.6%) – down from 70.7%. This was a huge decrease from last year and their performance also fell sharply from 123.3% to 101.7%. They are no longer in the 120+% club and now rank last. No Earner CUs of all sizes spent $3.3B more while 2+ Earner CUs spent $6.5B less. It was a strong year for Retirees.
- Education – College Grads (62.4%) – up from 42.1%. Higher Education skyrocketed in importance in Pet Food Spending as college grads had a 50% increase in share and their performance grew from 90.1% to 131.7%. Higher education, specifically a college degree, jumped from last to 3rd in importance in increased Pet Food Spending.
- Occupation – All Wage & Salaried Workers (60.5%) – up from 48.1% – Spending by all white collar workers took off while it dropped sharply for self-employed. Their performance grew from 78.2% to 102.0% and they replaced the “Bosses” in the list of big groups. However, the new group caused occupation to fall from #1 to #9 in importance.
- CU Composition – Married Couples (64.8%) – down from 71.1%. They lost share and their performance fell from 146.6% to 136.8%, but they moved up from 3rd to 2nd. In Married segments, only Couples Only and those with an oldest child 6>17 years old spent more. Singles and all adult, unmarried CUs also increased spending by $1.6B.
- Age – 45>74 (56.5%) – down from 68.6%. This older group replaced 35>64 yr-olds in 2020. Their performance fell from 132.2% to 110.3% and they fell from 4 to 7 in importance. 45>64 is in both groups. The change stayed in place because the 65>74 share is 17.8% while 35>44 is 16.3%. 55>64 was the big driver in the 2020 lift and the 2021 fall.
Only 1 of the big spenders for Pet Food is different from Total Pet. Last year there were 3 special groups. 2021 brought a return to a more normal spending pattern and spending became slightly more balanced. This is best illustrated by the fact that in 2021 the performance for only 5 groups exceeds 120%. Last year there were 8 groups at $120+%, 5 of which had a performance level above 130+%.
Now, we’ll look at 2021’s best and worst performing Pet Food spending segments in each category.
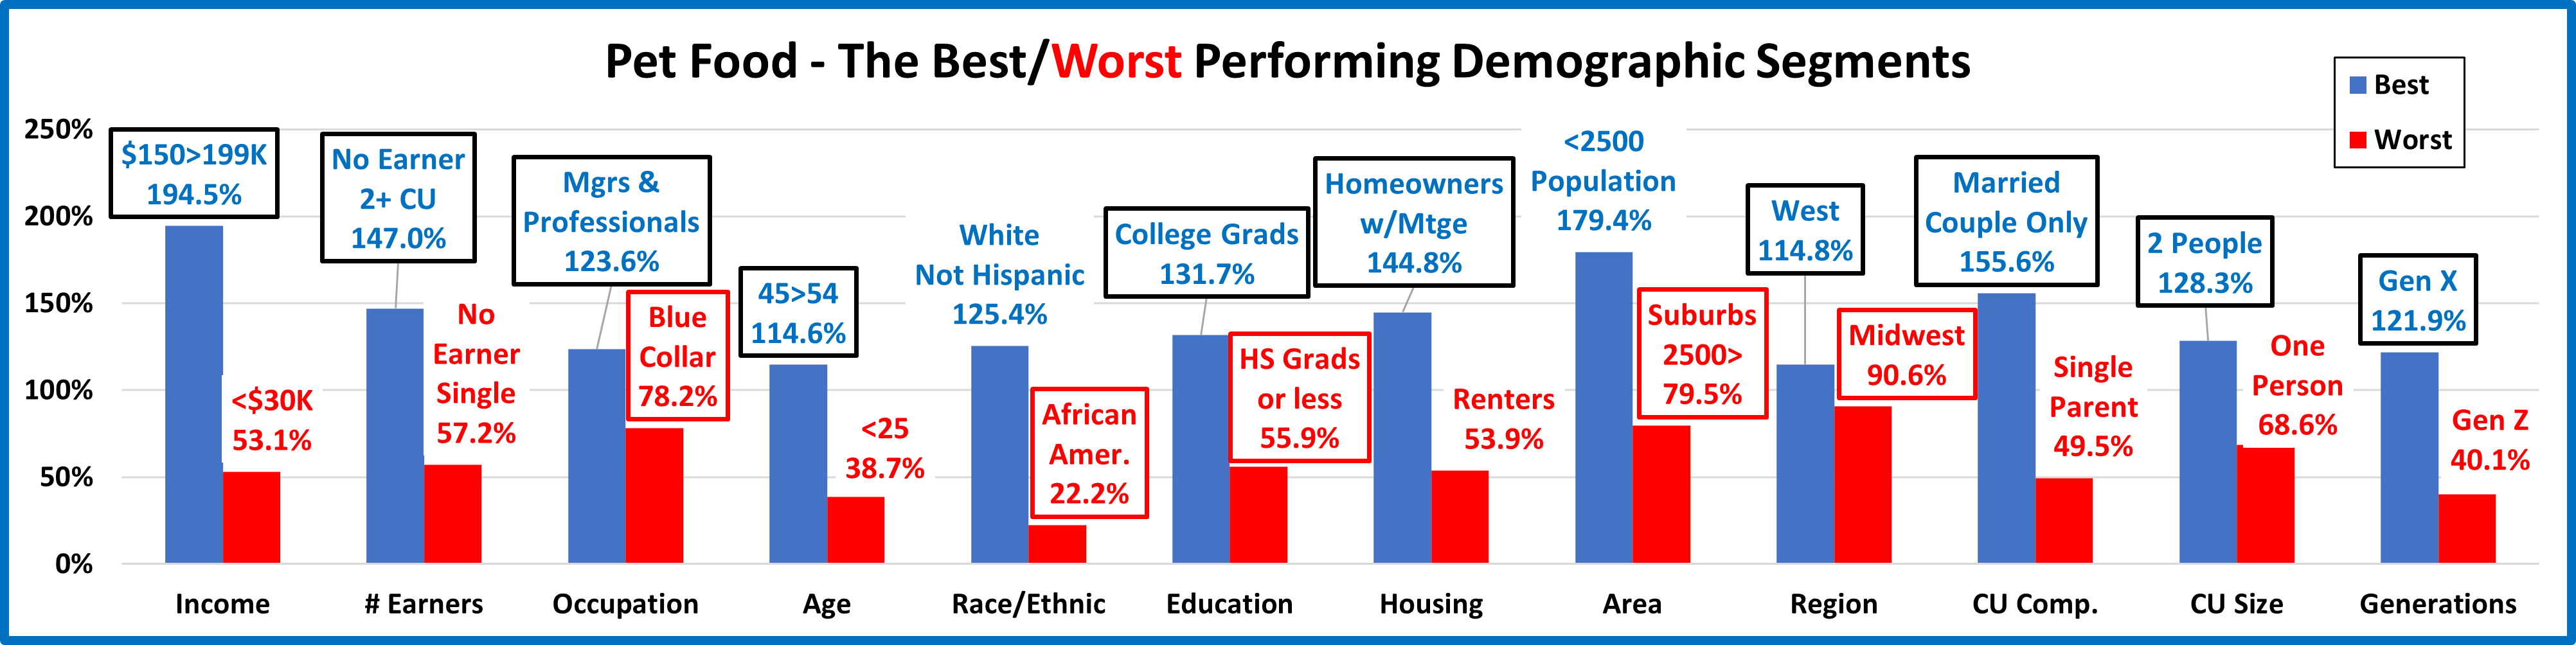
Most of the best and worst performers are the ones that we would expect but 2021 produced one surprise winner – No Earner 2+ CUs, and 1 surprise loser – Suburbs with a population over 2500. There are 10 different winners from 2020 and 5 different losers. This is even more than the total of 10 last year and the 9 new winners this year in Total Pet. This reflects the return to normal after the binge buying in 2020. Changes from 2020 are “boxed”. We should note:
- Income The Food winner makes slightly less than the winner in other segments and Total Pet but is still over $150K.
- # Earners – The No Earner, 2+ CUs win reflects a strong year by Retirees, especially the 65>74 yr-old Boomers.
- Occupation – Mgrs/Professionals & Blue Collar returned to their normal spots, again reflecting income’s importance.
- Age, Generation- The high income, 45>54 Gen Xers moved to the top. Gen X was the big winner in 2021.
- Race – The usual winner, but African Americans replaced the traditionally low pet owning Asian CUs at the bottom.
- Education – Once again having a College Degree and the resulting higher income mattered in Pet Food Spending.
- Housing – Owning a home is always important. Those with a mortgage returned to their usual place at the top.
- CU Composition, CU Size – Married, Couples Only and 2 people CUs returned to their “normal” top spots.
- Region – The West returned to the top and was the only region with 100+% performance.
- Area – The big suburbs were a surprise loser. Usually, that spot belongs to Center City.
It’s time to “Show you the money”. Here are segments with the biggest $ changes in Pet Food Spending.

There are no repeats from 2020 so all are new. All 12 losers won last year which shows the impact of the 2020 binge. 5 of the winners were 2020 losers. That means that 71% flipped from 1st to last or vice versa. Half of the winners are expected while most losers are not. The Surprise winners are Retirees, No Earner, 2+CUs, Center City, 75+ and Hispanics. The losers that came as no surprise were HS Grads or less, Homeowners w/o Mtge and the Midwest. The biggest surprise was that spending fell -$2.44B while 65% of all demographic segments spent more. Here are the specifics:
- Housing – The 2020 winner and loser both flipped
- Winner – Homeowners w/Mtge – Food: $18.77B; Up $4.02B (+27.3%) 2020: Homeowners w/o Mtge
- Loser – Homeowners w/o Mtge – Food: $9.10B; Down $8.09B (-47.1%) 2020: Homeowners w/Mtge
- Comment – Renters also spent more so the Food decrease came solely from Homeowners without a mortgage.
- Region – Another dual flip.
- Winner – South – Pet Food Spending: $13.07B; Up $3.88B (+42.2%) 2020: Midwest
- Loser – Midwest – Pet Food Spending: $6.58B; Down $9.14B (-58.1%) 2020: South
- Comment – Last year only the West and Midwest spent more. This year only the Midwest spent less.
- # in CU – The 3rd dual flip as 2 person CUs return to the top for the 1st time since 2017.
- Winner – 2 People – Pet Food Spending: $14.57B; Up $3.80B (+35.2%) 2020: 4 People
- Loser – 4 People – Pet Food Spending: $4.35B; Down $7.21B (-62.4%) 2020: 2 People
- Comment: Although Singles again had an increase, there was a turnaround from 2020. This year 2 & 3 person CUs spent more while all CUs over 4 spent less – the exact opposite of 2020.
- Education – Higher education returned to the forefront in importance in Pet Food spending.
- Winner – BA/BS Degree – Food Spending: $11.07B; Up $3.32B (+42.8%) 2020: < HS Grads
- Loser – HS Grads or less – Food Spending: $4.74B; Down $10.02B (-67.9%) 2020: HS Grad w/some College
- Comment – The biggest lift came from those with a BA/BS degree but all segments with any college experience spent more on Pet Food in 2021. Those without a HS diploma binge bought Food in 2020. In 2021 the situation flipped, but in fact all groups with a HS diploma or less spent a lot less on Pet Food, -$10B.
- Occupation – After 3 years at the top, Self-Employed flipped to the bottom.
- Winner – Retired – Pet Food Spending: $8.44B; Up $3.16B (+59.8%) 2020: Self-Employed
- Loser – Self-Employed – Pet Food Spending: $2.09B; Down $9.19B (-81.5%) 2020: Tech, Sales, Clerical
- Comment – Retirees led the way. However, in wage & salary earners, only Construction Workers/Mechanics spent less. Tech/Sls/Clerical was +$1.8B and Service Workers were +$1.1B.
- CU Composition – CU’s with children became markedly less important.
- Winner – Married, Couple Only – Food: $11.60B; Up $2.95B (+34.0%) 2020: Married, Oldest Child 18>
- Loser– Married, Oldest Child 18> – Food: $2.58B; Down $9.16B (-78.0%) 2020: 2+ Adults, No Kids
- Comment – Married, oldest child 18> flipped from 1st to last. CUs with an oldest child 6>17 spent more. All other CUs with children, including Single Parents spent less. Adults only was a different story. All adult CUs – Singles & 2+ CUs, married or unmarried – just no kids, spent more on Pet Food.
- # Earners – The winner and loser flipped leaving a truly surprising segment at the top, No Earner, 2+ People CUs.
- Winner –– No Earner, 2+ CU – Pet Food Spending: $5.36B; Up $2.88B (+116.1%) 2020: 2 Earners
- Loser – 2 Earners – Pet Food Spending: $12.09B; Down $6.19B (-33.8%) 2020: No Earner, 2+ CU
- Comment – All No Earner and 1 Earner CUs of any size spent more on Pet Food in 2021, but all CUs with 2+ earners spent less. Income is important but the number of people earning the money didn’t matter as much.
- Generation – Boomers and Gen X flipped positions.
- Winner – Gen X – Pet Food Spending: $11.12B; Up $2.82B (+34.0%) 2020: Baby Boomers
- Loser – Baby Boomers – Pet Food Spending: $11.82B; Down $7.49B (-38.8%) 2020: Gen X
- Comment – Much of the 2020 Pet Food spending lift was the Boomers’ emotional reaction to the pandemic. In 2021 we returned to reality with Gen X leading the way. Actually, all generations but Boomers spent more with the Silent Generation (born <1946) having the 2nd biggest increase, +$1.4B.
- Income – Last year’s binge leader, $100>149K flipped to the bottom while the $150>199K group took the top spot.
- Winner – $150 to $199K – Pet Food Spending: $4.81B; Up $2.73B (+130.7%) 2020: $100 to $149K
- Loser – $100 to $149K – Pet Food Spending: $5.46B; Down $8.92B (-62.1%) 2020: $70 to $99K
- Comment – The $30>49K group was the only other segment to spend less. Spending increases were widespread but $150K> was up $4.1B. <$30K: +$0.1B; $50>69K: +$0.9B; $70>99K: +$2.5K; $200K>: +$1.4B.
- Area Type – Areas <2500 population flipped from 1st to last, with another surprise winner, Center City.
- Winner – Center City – Pet Food Spending: $10.54B; Up $2.36B (+28.8%) 2020: Areas <2500
- Loser – All Areas <2500 – Pet Food Spending: $11.19B; Down $6.35B (-36.2%) 2020: Suburbs 2500>
- Comment – The Big Suburbs (2500>) also spent more, and the Center City lift was widespread across America. In fact, only Cities with a population above 5 million spent a little less, -$0.1B.
- Age – The 55>64 year olds flipped from 1st to last and we had a truly surprising winner, 75+ years old.
- Winner – 75+ yrs – Pet Food Spending: $3.76B; Up $1.76B (+88.3%) 2020: 55>64 yrs
- Loser – 55>64 yrs – Pet Food Spending: $6.75B; Down $7.89B (-53.9%) 2020: 45>54 yrs
- Comment: In 2020 the 55>64 yr olds drove almost all of the increase. In 2021 they were responsible for all of the decrease as every other age group spent more. The 75+ group won but 35>44 was +$1.2B and 45>54 was +$1.1B.
- Race/Ethnic – White, Not Hispanics flipped to the bottom and Hispanics had a huge, +62% lift to take the top spot.
- Winner – Hispanic – Pet Food Spending: $3.43B; Up $1.31B (+62.0%) 2020: White, Not Hispanic
- Loser – White, Not Hispanic – Pet Food Spending: $28.98B; Down $3.74B (-11.4%) 2020: Asians
- Comment – The U.S. is becoming more racially/ethnically diverse but White, Not Hispanic is still by far the biggest spender in every Pet Industry Segment. In 2021 Pet Food spending became a little more balanced. African Americans spent less on Pet Food but Asians spent a truly amazing 131% more, +$0.6B.
We’ve now seen the “winners” and “losers” in terms of increase/decrease in Pet Food Spending $ for 12 Demographic Categories. In 2020, the big spending lift due to the pandemic occurred in very specific segments. In 2021 those same segments generally had the biggest drops in $. This created an unusual situation. Pet Food spending decreased by -$2.44B while 65% of all demographic segments actually spent more. Most of America remains firmly committed to high quality Pet Food. However, super premium Food comes with high prices, so income is very important in Pet Food spending. The pandemic has accelerated value shopping, especially on the internet. We have identified the winning segments in performance and $ increase but they were not alone. Not every good performer can be a winner. Some “hidden” segments should also be recognized for performance. They don’t win an award, but they get…
Honorable Mention
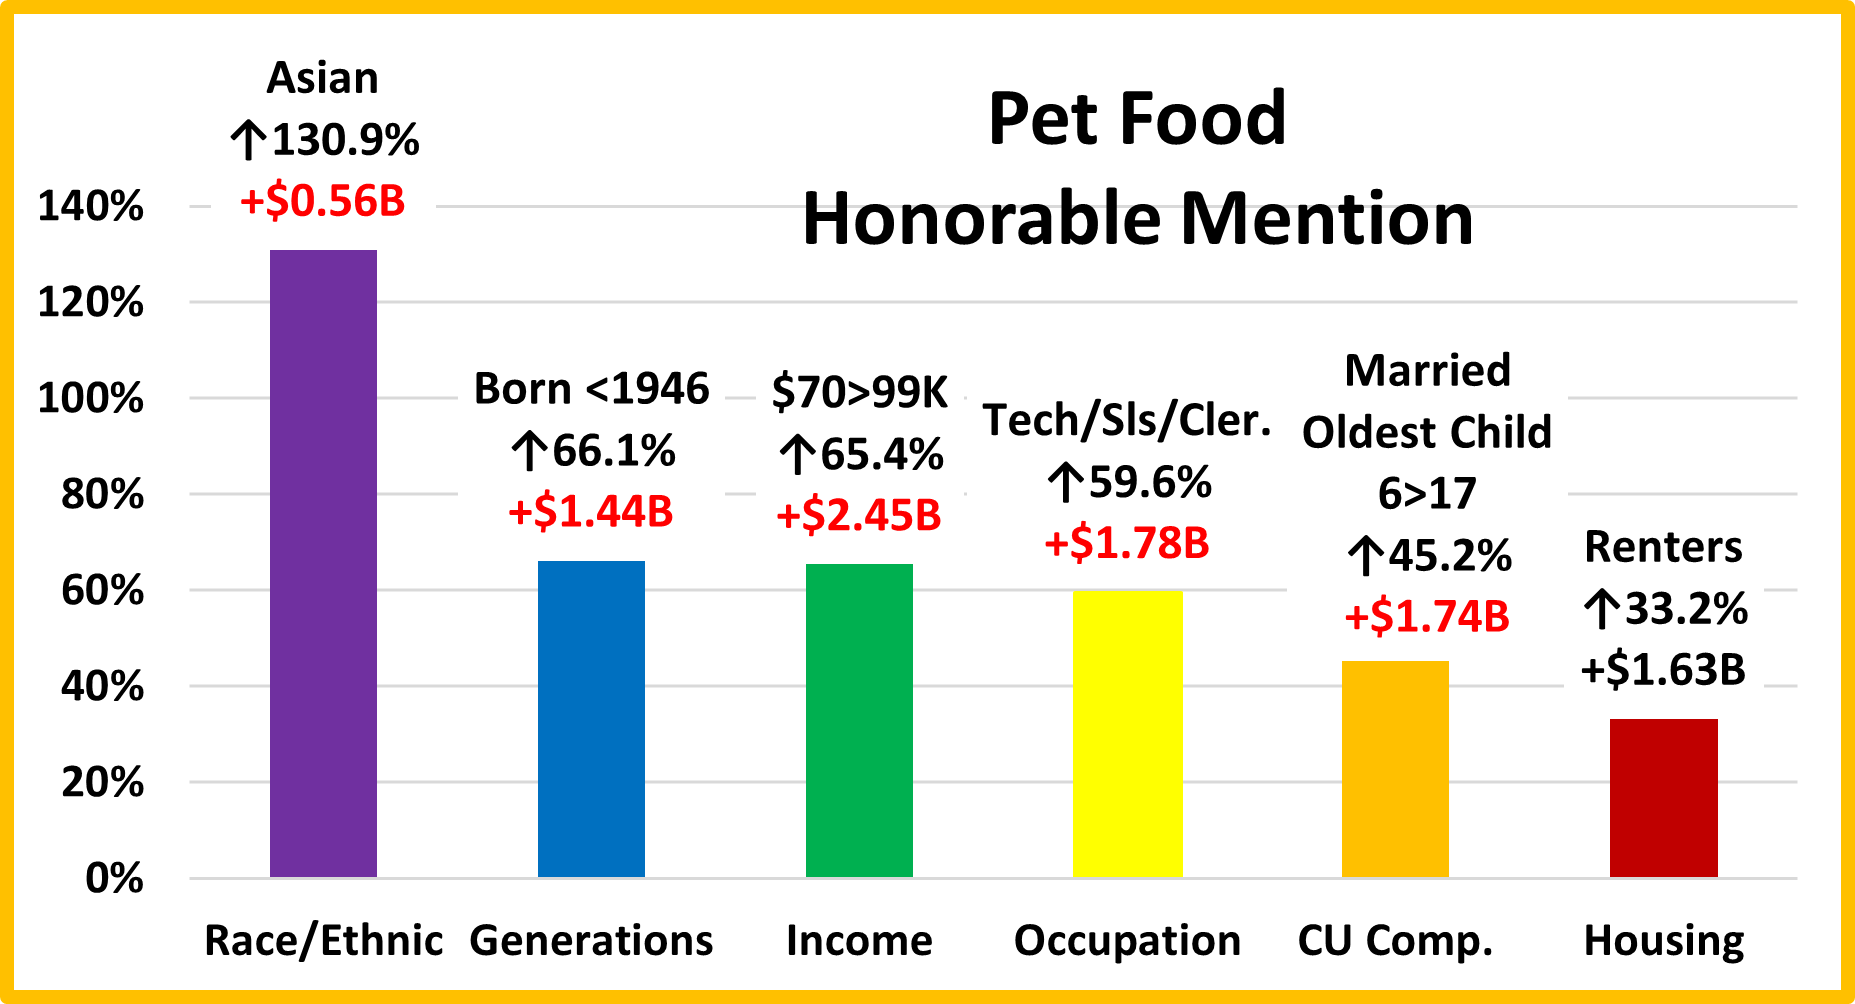
Asians have a low % of pet ownership, but it is undoubtedly growing as their Pet Food $ more than doubled in 2021. The oldest Americans are generally short on $ but they are committed to their Pets. In 2021, many of them likely committed to Super Premium Pet Foods as their spending increased by 66%. The highest income groups had the biggest increase in spending, but “middle America” also opted in. This is evident by the big lifts from $70>99K and lower-level White Collar workers. Gen Xers had a great year and they are the most likely group to have an oldest child between 6 and 17 years old. Homeownership has always been a key factor in Pet Parenting and Pet Spending, but it is not a necessity. This is made very clear by the 33% increase in Pet Food Spending from Renters.
Summary
Pet Food has been ruled by trends over the years. The drop in 2018 due to the FDA grain free warning broke a pattern of 2 years up followed by 1 year of flat or declining sales which had been going on since 1997. This trendy nature increased with the first significant move to premium foods in 2004. The Melamine crisis in 2007 intensified the pattern and resulted in a series of “waves” which became a tsunami with the introduction of Super Premium Foods.
The 25 to 34 yr old Millennials were the first to “get on board” with Super Premium in the 2nd half of 2014. In 2015 a substantial portion of consumers began to upgrade. The result was a $5.4B spending increase. These consumers were generally more educated and had higher incomes. One negative was that they often paid for the upgrade by spending less in other segments. In 2016 the anticipated drop in spending happened. The upgraded group value shopped for their new food and found great deals, especially online. They spent some of the $3B “saved” Food $ in other segments but not enough to make up for the drop in Food. Total Pet Spending was down $0.46B. In 2017 we were ready for a new “wave”. Thanks to a very price competitive market, what we got was a deeper penetration of Super Premium foods. This group of upgraders was mostly middle-income, not college educated and often Blue-collars workers. Most also were in the 55>64 yr-old age group. The result was a $4.6B increase but this time there was no trading $ with other segments.
In 2018 we were “due” a small annual increase in Pet Food. Spending in the 1st half was +$0.25B but then the bottom dropped out as spending fell $2.51B in the 2nd half in reaction to the FDA warning on grain free dog food. The big decrease in spending came directly from the groups who had fueled the 2017 increase. In fact, 71% of the demographic groups with the biggest change in Pet Food $ switched from first to last or vice versa from their position in 2017.
That brought us to 2019. The impact of the FDA warning faded as there was little evidence to back it up. Pet Parents returned to Super Premium or chose even higher priced options. Supplement $ also grew as the health and wellbeing of their Pet Children remained the #1 priority. Pet Food $ grew $2.35B with 75% of demographic segments spending more. Income and related categories mattered more and Pet Food Spending became a less demographically balanced. In 2020 the Pandemic accelerated this trend. Fear of shortages led to binge buying and a $5.65B increase. This behavior was driven by very specific groups. This spending disparity was manifested in the fact that the performance of 8 of 10 big spending groups exceeded 120% while 49% of all segments spent less.
In 2021, the retail market strongly recovered but the turmoil in Pet Food continued. The 2020 binge buying was unnecessary and didn’t increase usage, so Pet Food spending fell by $2.44B. The 2021 Turmoil exceeded that of 2018 as every segment with the biggest increase in 2020 had the biggest decrease in 2021. The resulting drop in $ hid the fact that 65% of all demographic segments spent more on Pet Food. 2021 was actually a pretty good year for Pet Food.
Finally – 2021’s “Ultimate” Pet Food Spending CU is 2 people – a married couple. They are 45>54 years old and White, but not of Hispanic origin. They both work and at least one has an Advanced College Degree and is a Manager or Professional. They earn $150>$199K but are still paying the mortgage on their house in a small suburb in the West.


Trackbacks & Pingbacks
[…] changes in pet food spending that year, helpfully extracted from all the BLS data and analyzed by John Gibbons, may provide indicators for what’s to come in 2023 and […]
[…] changes in pet food spending that year, helpfully extracted from all the BLS data and analyzed by John Gibbons, may provide indicators for what’s to come in 2023 and […]
Comments are closed.