
2021 Total Pet Spending was $99.98B – Where did it come from…?
Total Pet Spending in the U.S. was $99.98B in 2021, a $16.23B (19.4%) increase from 2020. These figures and others in this report are calculated from data in the annual Consumer Expenditure Survey conducted by the US BLS. 2020 was a year of pandemic turmoil for the industry. Consumers focused on “needs” which caused a spending lift in Veterinary and binge buying of Food. However, the discretionary segments – Supplies and Services, had big decreases in $. The net was a 6.8% in Pet Spending. 2021 was also tumultuous but it was almost all positive. The Food binge couldn’t be repeated so Food $ fell slightly but all other segments had record increases which produced the biggest Pet spending lift in history. 2021 Pet Spending certainly deserves a closer look.
The first question is, “Who is spending most of the $100 billion dollars?” There are of course multiple answers. We will look at Total Pet Spending in terms of 10 demographic categories. In each category we will identify the group that is responsible for most of the overall spending. Our goal was to find demographic segments in each category that account for 60% or more of the total. To get the finalists, we started with the biggest spending segment then bundled related groups until we reached at or near 60%.
Knowing the specific group within each demographic category that was responsible for generating the bulk of Total Pet $ is the first step in our analysis. Next, we will drill even deeper to show the best and worst performing demographic segments/groups and finally, the segments that generated the biggest dollar gains or losses in 2021.
In the chart that follows, the demographic categories are ranked by Total Pet market share from highest to lowest. We also included their share of total CU’s (Financially Independent Consumer Units) and their performance rating. Performance is their share of market vs their share of CU’s. This is an important number, not just for measuring the impact of a particular demographic group, but also in measuring the importance of the whole demographic category in Spending. All are large groups with a high market share. A performance score of 120+% means that this demographic is extremely important in generating increased Pet Spending. I have highlighted the 5 groups with 120+% performance.

The only group change from 2020 is that College Grads gained 12% in share, reached the 60% threshold and replaced Associates Degree>. There were changes in the numbers and rankings and again only 5 made the 120%+ club. Higher Education (College Grads) moved in while Everyone Works dropped out. All Wage Earners gained 4 points in share and 10 points in performance. While it matters less how many people work, higher income remains the single biggest factor and continues to grow in importance in Total Pet Spending.
- Race/Ethnic – White, not Hispanic (84.2%) down from 87.3%. This is the 2nd largest group and has the largest share of Pet Spending. Their performance was down from 127.6% to 125.3% and they fell from #3 to #4 in terms of importance as spending became a little more balanced. Although this demographic, along with age, are 2 areas in which the consumers have no control, spending disparities within the group are enhanced by differences in other areas like Income, CU Composition and homeownership. There are also apparently cultural differences which impact Pet Spending. Asian Americans are first in income, education and CU spending. They spent 75% more on pets in 2021 but they’re next to last in Pet Spending as a percentage of total spending – 0.51% vs a national average of 1.12%.
- # in CU – 2+ people (80.6%) up from 80.3%. Singles remain the only group with under 100% performance. In 2021, 2 person CUs had the biggest increase and only 4 person CUs spent less. However, this big decrease reduced the share gain and slowed the performance increase of 2+ CUs from 114.4% to 115.9%.
- Housing – Homeowners (80.0%) down from 83.3%. Controlling your “own space” is a key to larger pet families and more pet spending. 2021 was a bad year for Homeowners w/o Mtges (-$3.7B) as they did not replicate the binge buying of Food. Overall, Homeowners spent $10.2B more but the group’s performance fell from 126.6% to 123.6% because of a spectacular year by Renters, +43.2%. They stayed in 5th place in importance. The homeownership rate fell from 66% to 65% due to a drop from the older groups. It’s still growing in the younger CUs.
- Area – Suburban & Rural (71.8%) up from 71.6% Homeownership is high and they have the “space” for pets. The larger suburbs had a great year but the $ for areas <2500 fell by $1B. This pushed their performance down from 113.6% to 111.4%. Center City had an increase of $4.4B but their performance is the worst at 79.3%
- Income – Over $70K (68.2%) up from 64.3%. They gained significant share and their performance grew to 152.3% from 147.9%. CU income is still by far the most important factor in increased Pet Spending. Spending was again on a roller coaster: <$30K: +$1.1B; $30>50K: -$1.9B; $50>100K: +$7.8B; $100>150K: -$4.9B; $150K>: +$14.1B. Higher income is growing more important. The $150K> group has 15.8% of CUs but accounts for 34.0% of Total Pet $.
- # Earners – “Everyone Works” (66.4%) down from 70.7%. These are CUs of any size where all adults are employed. They lost share and their performance fell from 123.0% to 117.0%. They dropped out of the 120+% club and are now the 6th most important category. Income is growing in importance but 2021 was also a great year for No Earner CUs. Total Pet spending by Retirees was up 51%.
- Education – College Grads (65.6%) up from 52.6%. Higher Education level is usually tied to higher income and Pet spending. It can also be a key factor in recognizing the value in product improvements. 2020 largely threw this history out the window as those with less than a college degree led the way in spending in the necessary segments – Food and Veterinary. 2021 saw a total reversal as higher education again became critical in Pet Spending. In fact, the share for College Grads reached 60% and their performance grew from 112.6% to 138.6%, putting them in the 120%+ club as the 2nd most important factor in Total Pet Spending.
- Occupation – All Wage & Salary Earners (63.2%) up from 59.2%. Their performance also grew from 96.3% to 106.5% so they are again “earning their share”. All but Construction Workers spent more on their pets in 2021. Managers and Professionals had the biggest $ increase, +$6B but Service workers led the way in percentage, +88%. Their gains were slowed a bit by the $6B spending increase by Retirees but were helped by an -$8B drop in spending by the Self-Employed.
- CU Composition – Married Couples (62.7%) down from 64.7%. With or without children, 2 people, committed to each other, is an ideal situation for Pet Parenting. In 2021, they lost share and their performance fell from 133.4% to 132.4%, dropping them from 2nd to 3rd place in importance. This was entirely due to an -$8B spending drop from Married Couples with a child over 18. This was not unexpected as they binge bought Pet Food in 2020.
- Age – 35>64 (60.9%) down from 63.2%. They lost share and their performance fell from 118.4% to 116.2%. This was entirely due to a -$3.2B decrease from 55>64 yr-olds, who also binge bought Food in 2020. All other age groups spent at least 19.6% more so Pet Spending is slightly more balanced and age is 7th in importance.
Total Pet Spending is a sum of the spending in all four industry segments. The “big demographic spenders” listed above are determined by the total pet numbers. The share of spending and performance of these groups varies between segments and in a few cases falls below 60%. We also altered the groups in some segments to better reflect where most of the business is coming from. The pandemic and this year’s recovery caused some turmoil in Pet Spending,
The group performance is a very important measurement. Any group that exceeds 120% indicates an increased concentration of the business which makes it easier for marketing to target the big spenders. Income over $70K is again the clear winner, but there are other strong performers. High performance also indicates the presence of segments within these categories that are seriously underperforming. These can be identified and targeted for improvement. However, 2021 is a little more complicated. Many of the big drops in spending came from segments that binge bought Pet Food in 2020. These big emotional moves, up or down can affect the total group performance. Normal may return in 2022.
Now, let’s drill deeper and look at 2021’s best and worst performing segments in each demographic category
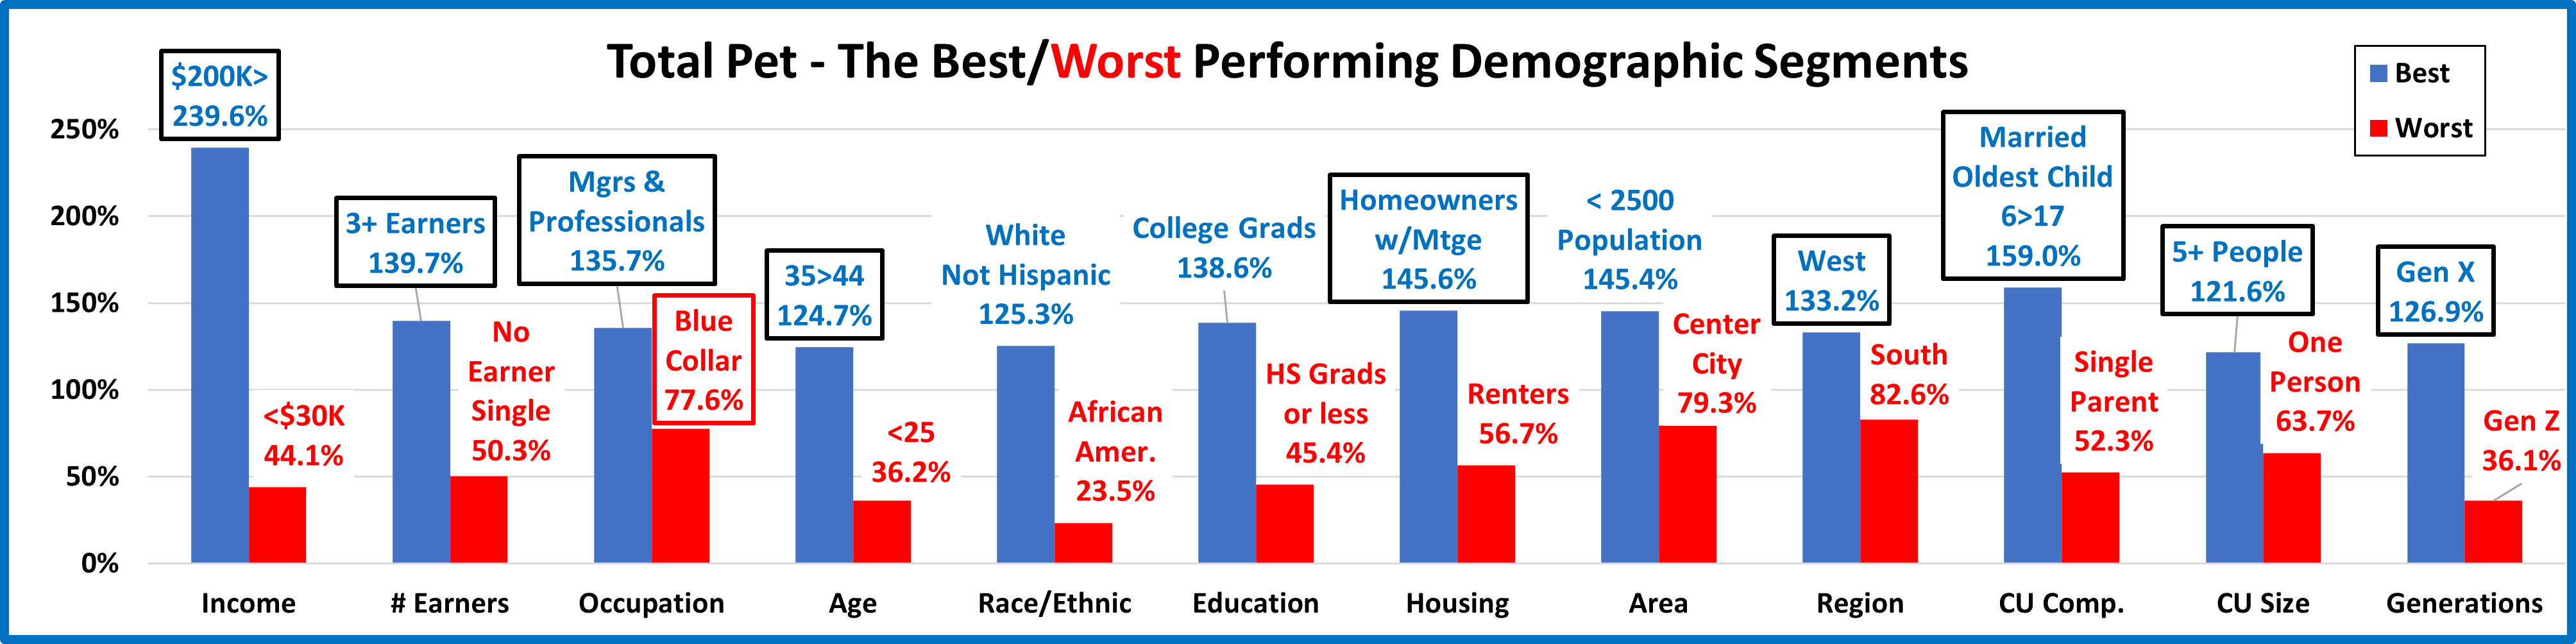
Most of the best and worst performers are just who we would expect but there are 9 winners that are different from 2020. This also indicates a move back towards “normalcy”. Changes from 2020 are “boxed”. We should note:
- Income is important in Pet Spending, which is shown by the 239.6% performance by the $200K> group and a win by 3 Earners. However, $70>99K also had a strong year. In 2021, all groups over $70K performed at 100+%.
- Occupation – Mgrs/Professionals & Self-Employed are the only occupations with 100+% performance.
- Age/Generation – After the 2020 Boomer Food Binge, spending moved towards Gen X with the 35>44/Gen X wins.
- Region – After 2 years at #2 but still with 100+% performance, the West returned to its normal place at the top.
- CU Size/Composition – The importance of children was maintained with a win by 5+ People and another win by a group with an Oldest Child over 6. The “magic” CU number moved up again to 5 from 2020: 4, 2019: 3; 2018: 2.
- Homeowners w/Mtges moved back to their expected spot at the top. In 2020 those w/o mtge beat them by 0.8%.
The “new” and old winners reflect both the move back towards more normal spending patterns and slightly younger CUs. In the next section we’ll look at the segments who literally made the biggest difference in spending in 2021.
We’ll “Show you the money”! This chart details the biggest $ changes in spending from 2020.
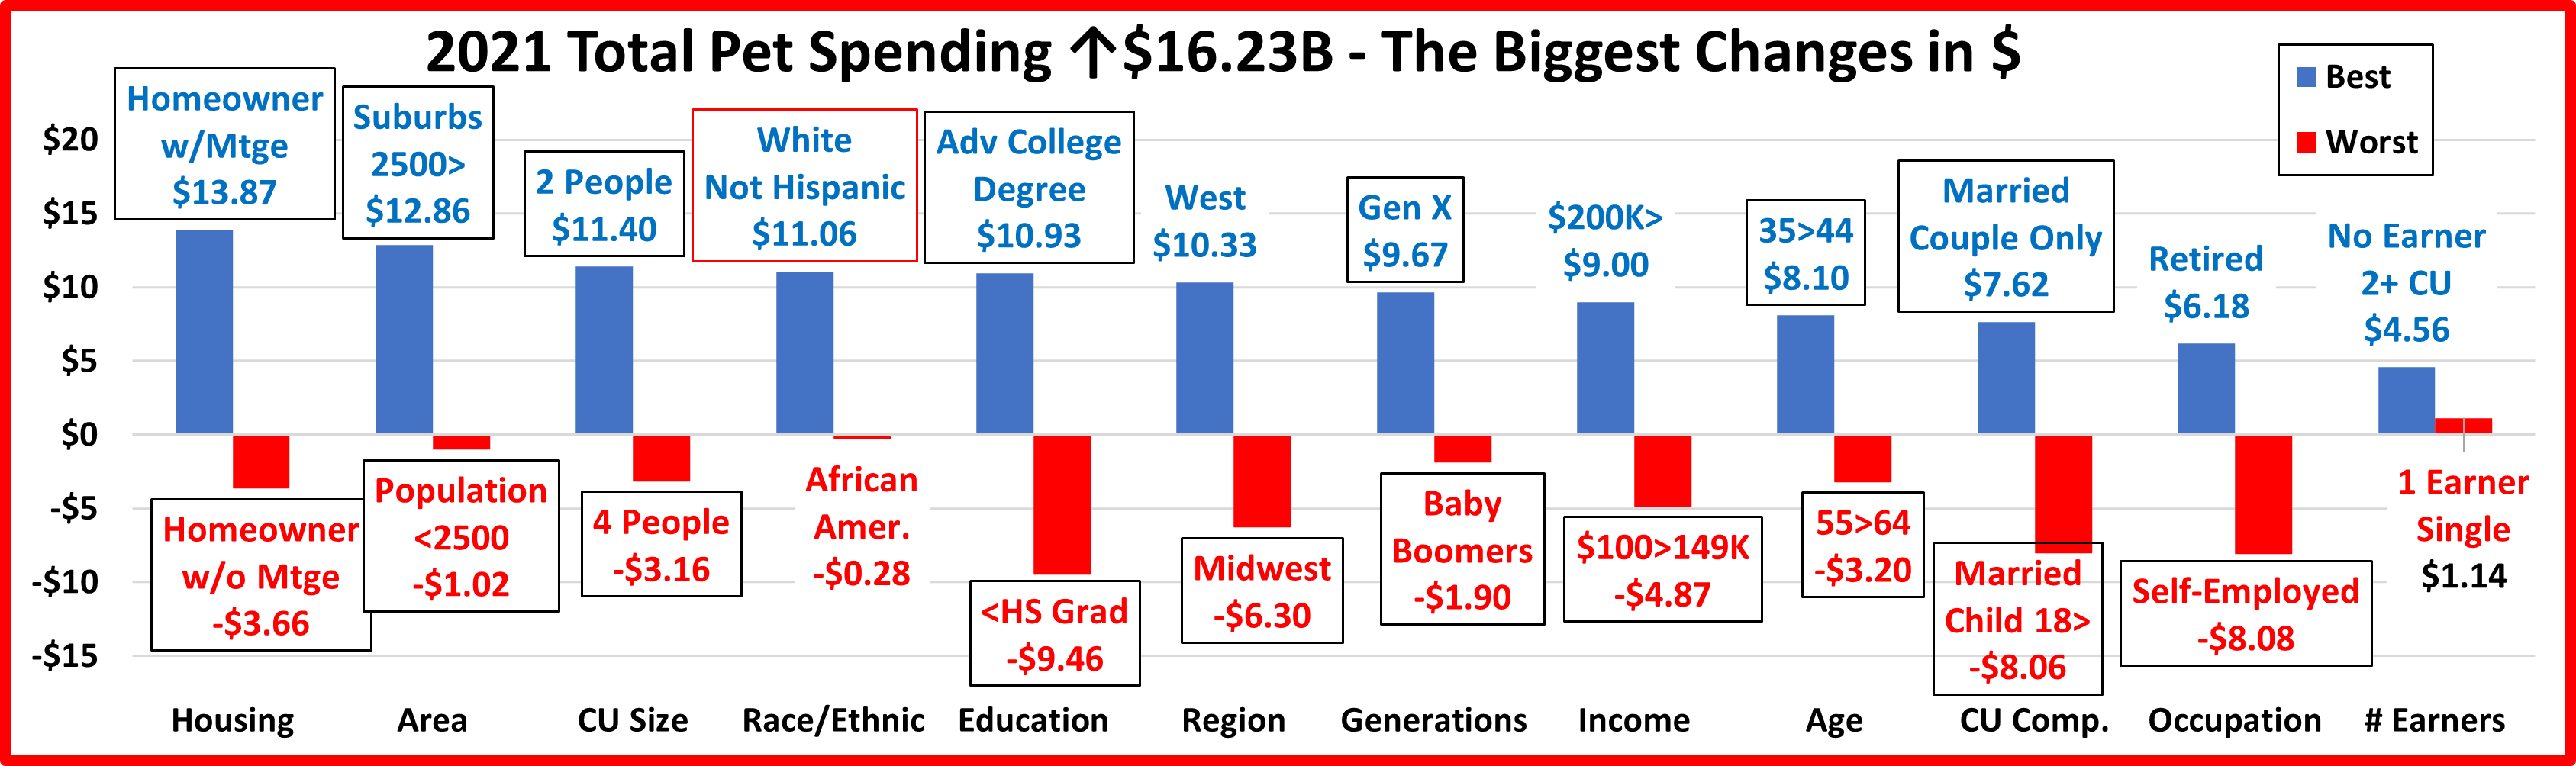
An unbelievable amount of turmoil. There are 24 Winners and Losers. Only 1 segment held its spot from 2020 while 17 switched from winner to loser or vice versa. In 7 categories both flipped. Overall, 96% were different from 2020.
- Housing – The winner and loser flipped positions.
- Winner – Homeowner w/Mtge – Pet Spending: $54.84B; Up $13.87B (+33.9%) 2020: Homeowner w/o Mtge
- Loser – Homeowner w/o Mtge – Pet Spending: $25.15B; Down -$3.66B (-12.7%) 2020: Homeowner w/Mtge
- Comment – Homeowners w/Mtge had the biggest gain, but Renters also spent $6B more. The “losing” Homeowners w/o Mtge binge bought Food in 2020.
- Area Type – Another dual flip.
- Winner – Suburbs 2500> – Pet Spending: $45.47B; Up $12.86B (+39.4%) 2020: Areas <2500
- Loser – Areas <2500 – Pet Spending: $26.36B; Down -$1.02B (-3.7%) 2020: Suburbs 2500>
- Comment – The Big Suburbs returned to their usual spot at the top. Center City also had a big increase in spending, +$4.4B. The Spending in the Areas with a population under 2500 fell by -$1B. Groups in this area also binge bought Pet Food in 2020. However, the behavior was less widespread in this segment.
- # in CU – Our 3rd dual flip.
- Winner – 2 People – Pet Spending: $39.83B; Up $11.40B (+40.1%) 2020: 4 People
- Loser – 4 People – Pet Spending: $14.72B; Down -$3.16B (-17.7%) 2020: 2 People
- Comment: 2 people CUs spend the most, 39.8% of all Pet $, and their increase was 4 times larger than any other segment. However, 5+ CUs also had a big, 33% increase. In fact, only 4 People CUs spent less.
- Race/Ethnic – Our only bit of stability as White, Not Hispanics (84.2% of all Pet $) won again.
- Winner – White, Not Hispanic – Pet Spending: $84.15B; Up $11.06B (+15.1%) 2020: White, Not Hispanic
- Loser – African American – Pet Spending: $3.05B; Down -$0.28B (-8.3%) 2020: Asian American
- Comment – A usual winner, but Hispanics and Asians spent 74+% more. Only African Americans spent less.
- Education – Another flip – This one definitely produced the expected results. <HS was the only group with a $ drop.
- Winner – Adv. College Degree – Pet Spending: $32.43B; Up $10.93B (+50.9%) 2020: < HS Grads
- Loser – Less than HS Grads – Pet Spending: $1.70B; Down -$9.46B (-84.8%) 2020: BA/BS Degree
- Comment – Education’s importance came back to the forefront in 2021. BA/BS finished a close 2nd, +$10.6B.
- Region – After strong Food binge buying in 2020, the Midwest flipped to last.
- Winner – West – Pet Spending: $30.32B; Up $10.33B (+51.7%) 2020: Midwest
- Loser – Midwest – Pet Spending: $18.97B; Down -$6.30B (-24.9%) 2020: Northeast
- Comment – In 2020 the Midwest and West had the only increases in Total Pet $. In 2021 the Midwest had the only decrease. Both the South and Northeast increased Pet Spending by over $6B.
- Generation – Gen X & Boomers flipped. The Boomers landed at the bottom because of 2020 Food binge buying.
- Winner – Gen X – Pet Spending: $33.62B; Up $9.67B (+40.3%) 2020: Baby Boomers
- Loser – Baby Boomers – Pet Spending: $32.94B; Down -$1.90B (-5.5%) 2020: Gen X
- Comment – Only Boomers spent less $ as all other groups spent 25% to 77% more on Pets.
- Income – No surprises here. The $100>149K group was a leader in Food binge buying in 2020.
- Winner – $200K> – Pet Spending: $20.56B; Up $9.00B (+77.9%) 2020: $100 to $149K
- Loser – $100 to $149K – Pet Spending: $18.50B; Down -$4.87B (-20.8%) 2020: $70 to $99K
- Comment – $150K> provided the biggest lift, +$14.1B, but the low to middle income $50>99K also spent $7.8B more. The only other decrease came from $30>49K, -$1.9B.
- Age – The 6th Winner and Loser flip. Once again the loser was largely due to 2020 Food spending.
- Winner – 35>44 yrs – Pet Spending: $21.39B; Up $8.10B (+60.9%) 2020: 55>64 yrs
- Loser – 55>64 yrs – Pet Spending: $20.95B; Down $3.20B (-13.3%) 2020: 35>44 yrs
- Comment: Only 55>64 yr-olds spent less. The increase by the 35>44 yr-olds was more than double the 2nd best but the spending increase was strong and widespread. 25>34, 45>54, 65>74 & 75+ all had increases over $2.5B.
- CU Composition – Married, Couple Only flipped to the top and yet another 2020 Food Binger flipped to the bottom.
- Winner – Married, Couple Only – Pet Spending: $28.828; Up $7.62B (+36.0%) 2020: Married, Oldest Child 18>
- Loser – Married, Oldest Child 18> – Pet Spending: $8.80B; Down -$8.06B (-47.8%) 2020: Married, Couple Only
- Comment – The loser was the only type to spend less. Couples Only edged out those with Children 6>17, +$6.9B.
- Occupation – Self-Employed, one of the top 2020 Food Bingers flipped from 1st to last.
- Winner –– Retired – Pet Spending: $18.29B; Up $6.18B (+51.1%) 2020: Self-Employed
- Loser – Self-Employed – Pet Spending: $7.78B; Down -$8.08B (-50.9%) 2020: Tech, Sales, Clerical
- Comment– Construction workers also spent less. Retirees narrowly beat Mgrs/Professionals, +$6.02B for the win.
- # Earners – No flips but a surprise winner, which reflects a strong year by Retirees.
- Winner – No Earner, 2+CU – Pet Spending: $10.21B; Up $4.56B (+80.9%) 2020: 2 Earners
- Loser – 1 Earner, Single – Pet Spending: $12.85B; Up $1.14B (+9.8%) 2020: No Earner, Single
- Comment – 2 Earner CUs finished a strong 2nd, +$3.6B, but all working & nonworking groups spent more in 2021.
We’ve seen the best overall performers and the “winners” and “losers” in terms of increase/decrease in Total Pet Spending $ for 12 Demographic Categories. Now, here are some segments that didn’t win an award, but they deserve….
HONORABLE MENTION

Let’s start with Hispanics. They have 14.7% of CUs but generated 26.5% of the increase. That is significant. Most of the attention also went to higher incomes. Pet Spending appears to be moving that way. The $70>99K income group is absolutely middle income. They had a great year with a 48% (+$5.1B) increase. They are also now performing above 100%, 106.2%. The Northeast had a extra strong recovery, +$6.04B (+47.9%) after a -16% drop in 2020. Renters are often at the bottom of any chart as they have a lower % of Pet ownership. They stepped up in 2021 with a $6.03B (+43.2%) increase. Pet spending is usually about Marriage and Family but it is popular with all groups. You see this from the big lift, +$4.51B (+42.0%) from 2+ adult, unmarried, no kid CUs. Our last group normally gets a lot of publicity, Millennials. However, 2021 generally belonged to their older brethren, Gen X. Millennials also stood strong last year. They have 25.1% of CUs but generated 39.7% of the $ increase.
Summary
To properly review 2021, we must put it into context with recent history. Total Pet Spending reached $78.60B in 2018, a $14.28B, 22.2% increase from 2014. However, it was not a steady rise, Total spending actually fell in 2016 and each segment had at least one down year. There were a number of factors driving both the growth and tumult within the industry. Two big positives were the movement to super premium pet foods and the rapid expansion of the number of outlets offering pet services. On the downside were value shopping, trading $ between segments and outside influences like the FDA dog food warning and tariffs. Pricing, inflation/deflation was also a negative/positive factor in some cases.
In 2019, the industry had another small decrease, -$0.16B (-0.2%) which was largely driven by a huge drop in spending in Supplies caused by Tarifflation. This affected virtually every demographic segment and caused Supplies $ to fall below 2014. Services spending also fell slightly as consumers value shopped. The good news was Pet Food bounced back from the impact of the 2018 FDA warning to reach a new record high. Veterinary $ also increased 2.7%. Unfortunately, this was entirely due to a 4.1% increase in prices. The amount of Vet Services sold actually decreased.
That brings us to 2020 and the Pandemic turmoil. The effect was positive for Food and Veterinary, especially Food. Out of fear of shortages, many Pet Parents binge bought Pet Food. Spending also increased in Veterinary, as consumers focused on their Pets’ needs. The discretionary segments suffered. Supplies prices stayed high so spending continued to decline. Services saw the biggest negative pandemic impact as many outlets were subject to closures and restrictions.
2021 was a new year and brought a change in attitude as the marketplace returned to “normal”. The Food binge buying wasn’t repeated but Pet Parents caught up with all their “children’s” wants and needs. This produced a record increase in Total Pet and all segments but Food. In the best/worst performing segments, Gen X took back the top spot and spending skewed younger and back to more traditional winners, like Homeowners w/Mtges and Incomes over $200K.
The biggest $ changes saw even more turmoil than in 2020. Only 1 segment held its position, compared to 6 in 2020, while 17 switched from 1st to last or vice versa. 7 winners flipped from last to first, but most were the “usual suspects”. There were only 2 surprise winners – No Earner, 2+CUs & Retirees, which showed that the lift wasn’t just coming from the young. On the “losing” side, 10 segments flipped from 1st to last. This was largely due to the binge buying of Food in 2020, which couldn’t be repeated in 2021. This resulted in only 3 “usual” losers – <HS Grads, African Americans and 1 Earner, Singles. At least the winning side returned to more normal behavior, but we mustn’t forget that the spending surge was widespread. 83% of all 96 demographic segments increased Pet Spending. In 2020 it was only 48%. 1 change is likely to last. The Gen Xers replaced the Boomers at the top. Millennials are in hot pursuit but that change won’t come for a number of years. We will continue our analysis of 2021 Pet $ by drilling deeper down into the individual segments.
But before we go…The Ultimate Total Pet Spending CU in 2021 has 5 people, a married couple with an oldest child 6>17. They are 35>44 yrs-old. They are White, but not Hispanic. They both work. At least one has an advanced college degree and is a Mgr/Professional. They earn $200K+. They still have a mortgage on a house located in the semi-rural West.

