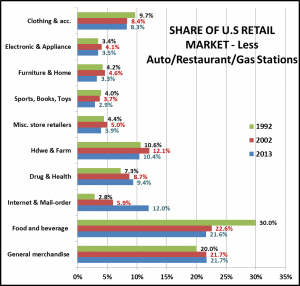
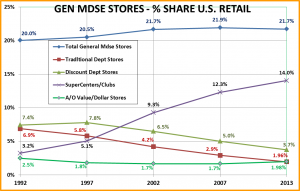
Spending, CPI, demographics of overall market

Pet Supplies – What is driving the consumer – now?

By late 2010, surveys indicated that 93% of consumers had changed their shopping habits because of the economic downturn. (Time 11/1/12)

  • After the recession, 64% of consumers now agree with the statement “Brand names are not better quality.” And it follows that if brand names do not represent better quality, why would it be worth paying more for them? (Time 11/1/12).
  • Only 25% of Americans say that brand loyalty impacts their buying behavior. (Forbes 3/26/12)
  • Price (89%) and quality (82%) are the highest factors in buying decisions. (Forbes 3/26/12)
  • 65% of shoppers note that a high level of variety is an important buying factor.(IRI 8/25/09)

The behavior of a customer/consumer has indeed changed beyond all recognition which means forget what you think you know, forget the past. That’s all gone for good. (Forbes 3/26/12)

In the “prolonged new normal”, “value – encompassing attributes such as convenience, price, health and quality – will win.” Products and brands that deliver a strong value proposition have a better chance for success. (A.C. Nielsen 8/6/14)

The Pet Industry has achieved spectacular growth by building on – not exploiting, America’s growing commitment to our companion animals. In 1989 when I came into the industry, dogs and cats were pets. That is no longer true. Now they are valued members of the family.

We achieved growth through the expanding consumer base, but also by producing ever better products and services – time after time, year after year – New products and improvements that helped enhance the lives of animals and their people “parents”. Healthier, safer, easier…and yes, more fun, these were the driving forces in the industry. It was all about recognizing and fulfilling the consumer’s needs through thought, timely innovation and a concerted effort.

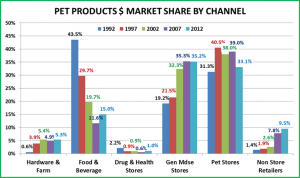
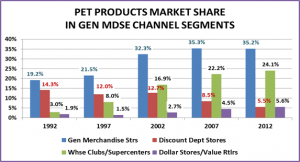
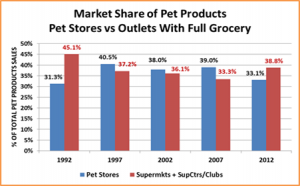
What is the current situation? Since an American household is now twice as likely to have a pet than a child under 18, Pet Supplies are found in virtually every retail channel – Food, Drug, Discount, Club, Sporting Goods, $ Stores, discount clothing outlets…you name it, they’ve got Pet. Not only that, but the major retailers have pet products with their own private label and/or a non-pet related licensed names.

What about private label? This concept first gained real traction in the late 70’s. It started as generic but soon morphed into “store brands” – private label. The appeal was higher margins for the retailers and lower prices for the consumers in products that are bought on a regular basis (commodities). At first, there were quality issues but the consumers taught the retailers quickly. Value = price + quality. The retailers improved the quality and started to expand their private label offerings to a multitude of categories. Remember, they make more money!

How did Pet Supplies get into this private label situation? Consider this:

In 2009, IRI noted that Private label growth is best in commodity-driven categories without a dominant national brand and with relatively low innovation. A specific target category noted in their report was – PET SUPPLIES (IRI 8/25/09)

A variety of research sources have found that consumer buying behavior has changed during and after the recession. I would say that a more accurate way to put it is, “After 40 years of lessons, consumers finally get what we have been teaching them.” Brand does not matter in commodity items.

How did sub-categories in the Pet Supplies segment become commodities? We did it. “Me too” companies marketing products pulled from the same showrooms in China flood the market. Don’t get me wrong. Most are quality products. That’s a major factor. To the average consumer, there is no difference in quality or function between products sold at a pet chain and products sold at a discount department store. If this is the case, then the best price is the best value…and the best choice.

At the same time, true functional innovation has slowed as noted by IRI. If manufacturers must focus on price in an attempt to maintain their current market share, then innovation must take a back seat. It’s also hard for small entrepreneurial creators to get noticed in a flood of products in every category. Policies such as “vendor consolidation” make it even more difficult for unique, new ideas to get to market.

Vendor consolidation is my favorite commoditizing policy. You absolutely can’t argue with it from an accounting viewpoint. It is cheaper to do business with fewer companies! However, you must also believe that all important innovation comes from larger companies. If you look at the history of American business, nothing could be further from the truth. Based upon that, Bill Gates and Steve Jobs should have stayed in their garages. After all, we had IBM for all our computing needs!

Vendor Consolidation is “short term”  thinking which can affect the whole industry. Companies would be better served, long term, with creating a “new vendor days” program which makes it easier for inventors to showcase new ideas.

Let’s sum it up:

American Consumers are looking for:

  1. Value (Value=Price + Quality)
  2. Convenience (Anything that makes the pet parenting experience easier)
  3. Selection (Americans need variety, choice)
What do we need to do?

Manufacturers must provide products that meet these requirements and focus on innovation in function and design, Got great products? Don’t rest on your laurels. Make them better – demonstrably. Identify a consumer need and find a way to fill it. Innovation is the only pathway that leads away from “commodity”….However, innovation is not the end of your journey. To reach the consumer, you still need to market your products properly, in today’s environment…

This is definitely easier said than done. I guess we’ll see what “we’re made of”.

What’s the “best” month to buy Pet Products?

What’s the best month or worst month to buy Pet Products and Services…in terms of price?

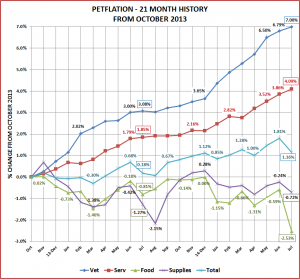
In consumer product categories, prices often go up and down from month to month. On a graph, it looks a lot like a roller coaster. The USBLS has been tracking the monthly CPI for the Pet Market and its segments since 1997. I decided to take a look and see if any patterns emerged…

There was a lot of detail…to say the least – 198 months of data for 4 segments, 2 combined groups and the total market. When you take a step back, the whole record seems to basically be divided into 3 eras:

  1. From 1998 to 2006 – This was a strong growth era of our industry and a gentle roller coaster of gradually rising prices. Prices went up a total of 29.5% in 9 years. An average year had 9 months with increases and 3 months with drops.
  2. From 2007 to 2009 – This was a time of steeply rising prices. There was an overall increase of 19.5 % in prices in just 35 months – without a single monthly drop. Coinciding with an economic recession, we saw the consumer impact of this. Our retail sales still went up – but consumers bought less and less in terms of the amount of goods and services.
  3. From 2010 to 2013 – In general, we have moved back to the gentle rollercoaster with overall prices moving up slowly again – 6.5% in 4 years – with an average year having 9 months with increases and 3 months with drops. However, there may be lingering effects in this recovery as supply prices continue to drop in a roller coaster ride which is generally headed downhill.

Based upon this overview, I decided to take a detailed look at the years from 2010 to 2013. This seems to provide the most relevant period to answer the current question, “Which is the best or worst month to buy Pet Products?”

As you might imagine, the “right” month to buy depends on what you are in the market for. Let’s take a look first at Services – Veterinary and Non-Veterinary. Here’s how the months ranked:

MonthRankGraph-Serv

Service Segments – The prices in both these segments have gone up unchecked at a high rate since they were first measured in 1997. Veterinary Services have actually had only 13 monthly CPI decreases in 198 months of measurement. With only dips in 2 months during the year, the flippant answer to “When is the best month to buy any Pet Services?.. is…last month.” The actual answer is… January has the lowest prices and December has the highest in an average calendar year.

Now let’s take a look at the product segments – Pet Food and Pet Supplies. Here’s how the months ranked:

MonthRank-Graph-Prod

Pet Food and Pets & Supplies – This is a bit more interesting.

Pet Food prices generally rise through the first half of the year, drop in July, start to rise again, peaking in November…then fall radically in December. Of course, Food is an absolute necessity so the consumer must buy according to need. However, prices are lowest in the winter months – December through February. Officially, the cheapest month in the calendar year is January and the priciest is November.

Pets and Supplies – Now you can see a “roller coaster. In general, prices are higher from February through May. They generally are lowest in the late Spring through the Summer months, hitting bottom in September. They start to build again as the Holiday season approaches, peaking in November. Then like food prices, they drop like a rock in December. So much for “black Friday”. Consumers should hang on. The odds are that the prices will drop as Christmas nears. The most expensive month is February and the cheapest is September…followed closely by December. The Holiday lift is of paramount importance in this segment. From the consumer’s view, they should buy early or buy late.

Here’s what the Total Pet Market looks like:

MonthRank-Graph-Totl

Total Pet Market – This looks pretty boring and there is no “roller coaster”! How come?

The 4 year average gets flattened out by several factors. Three of the 4 segments, all but supplies, are generally moving upward in price as the calendar year progresses. While the years all have an average of 3 months with price dips they are almost always in different months. The Total CPI increase in 4 years was only 6.5% so the monthly changes are usually small. In general, the Total Pet market is similar in pattern to the largest segment – Pet Food.

The overall best (cheapest) month to buy Pet Goods and Services in our analysis is the first month of the year – January. The worst is November – not December, thanks to annual price drops in both Food and Supplies. The Supply segment has the biggest monthly variation and the highest percentage of discretionary spending. It also traditionally has a large Fall/Holiday lift. The most important consumer “take away” from this analysis is probably – “Buy early (September) or buy late (December)”.

Will prices peak again in November? It seems likely as a December drop in Food & Supplies prices has occurred 5 years in a row. November has also been the priciest month 4 years in a row and finished no worse than second in this dubious contest for 14 out of 16 years. However, it is an unusual year as both Food and Supply Prices are down for the YTD for the first time since 2010 and…prices in the Total Pet Market actually dropped in January for the first time ever.

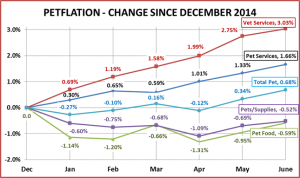
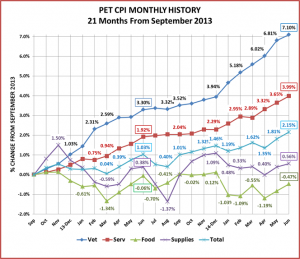
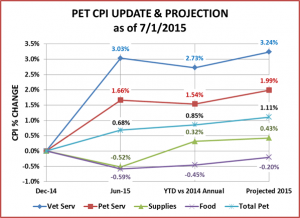
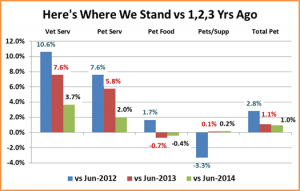
Pet CPI Update – Eh, What’s up Doc?…or down?

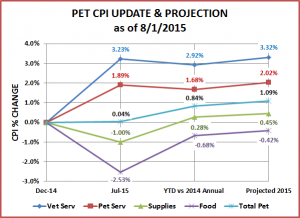
The U.S. Bureau of Labor and Statistics released their June CPI numbers while most of us were off at SuperZoo. In my recent posts we have seen that changes in the CPI can affect consumer behavior when they are outside “expectations”.

Let’s take a look at the 2014 first half CPI numbers by market segment and compare them with:

  • Year end 2013 (Dec) – What’s happened this year to date
  • vs 2013 Annual numbers (Note: The CPI is measured every month. The annual number is simply the average over the 12 month period)

Then I’ll look in my crystal ball (and at history) and take a shot at predicting the annual change for 2014.

Here is the math:

CPIUpdate-14-Chart

Here is the visual representation:

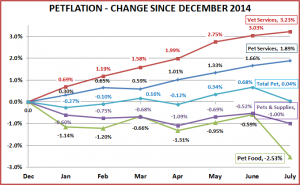
CPIUPDATE-14graph

OBSERVATIONS & RECAP BY MARKET SEGMENT

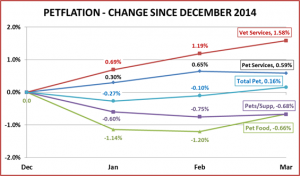
Veterinary Services – Prices UP 1.53% since December; UP 3.02% over the 2013 average number.

  • Veterinary prices go up every month like clockwork. The USBLS has measured the Vet Services for 198 consecutive months and prices have dropped in only 13 individual months over that whole period – almost all were less than 0.1%.
  • Based upon history, I project that prices in this segment will be up 3.73% in 2014 over the 2013 annual number. In my initial projection from my blog on the period from 2009-2014, I used a CPI increase of 2.6% which was equal to the previous year. This year’s increase is now projecting to be 43.5% GREATER than expected.
  • Even if this segment hits the projected retail number of $15.25B, over 60% will come as a result of price increases. Moreover, the adjusted growth (factoring out price increases) for the period from 2010 > 2014 will be a total of 2.0%…or 0.5% per year.
  • Rising prices have basically stagnated the Veterinary Segment in terms of growth in the amount of services sold. It appears that this trend is continuing.

Non-Veterinary Pet Services – Prices UP 0.72% since December; UP 2.42% over the 2013 average number.

  • Prices have also consistently gone up month after month in this segment, although not as fast as the Veterinary Segment.
  • Based upon recent history, I project that prices in this Service segment will be up 3.23% in 2014 over the 2013 annual number. The previous year’s increase was 2.1% which was used to estimate the 2014 adjusted growth numbers. This increase is 53.8% GREATER than last year’s.
  • Over 44% of this year’s growth will come from price increases…if they can hit the projected number.
  • Unlike the other segments, Pet Services has not yet hit a “price wall” triggering reduced use by consumers. We’ll see how long that this continues.

Pets and Pet Supplies – Prices DOWN -0.8% since December; DOWN -1.17% from the 2013 average number.

  • Totally opposite from Services but equally concerning. This “deflation” began in 2010 and continues.
  • Based upon recent history, I project that prices in this Supplies segment will FALL 1.55% in 2014 from the 2013 annual number. The previous year’s decrease was -2.1% so it is a little better than last year. However, I used a decrease of -0.8% in my previous estimates. I had hoped that the ongoing deflation would flatten out. It is slowing but not to the extent we would hope.
  • Prices on Pets and Supplies have now dropped 5.5% since reaching their historical peak in 2009. That is an average annual deflation rate of 1.1%.
  • As long as the consumer keeps increasing the amount of purchases the segment is fine. The concern is the increasing pressure on the manufacturers and the distribution channel due to deflating prices.

Pet Food – Prices DOWN -0.35% since December; DOWN -0.55% from the 2013 average number.

  • This is a bit of a surprise – to me, at least. After the unique price drop in 2010, this segment had been operating with a regular CPI increase of about 2.3%.
  • Based upon the YTD numbers and history, I project that Food prices will FALL -0.39% in 2014 from the 2013 annual number. If Food hits the retail number of $22.62B the adjusted growth rate will be 5.3% – over twice the 2.5% adjusted growth that was expected with increasing prices.
  • Pet Food prices have fallen in only 1 other year (2010) since the CPI was first measured in 1998.
  • The prices in all segments rose strongly up through the recession in 2008-2009. The consumer reacted by buying less (amounts). A Drop in both Food and Supply prices in 2010 spurred a rebound in consumer activity. There is really no parallel in the current situation. The economy is not great but we are not in a recession. Prices in food have been growing at a manageable rate and consumer purchases were increasing at a regular rate. We’ll see if this is a short term anomaly or if Food prices have reached a price ceiling of some kind.

TOTAL PET – Prices UP 0.17% since December; UP 0.42% over the 2013 average number.

  • All Services are up more than expected and both Food and Supplies are down, basically flattening the pricing in the total Pet Market.
  • Based upon the performance in the individual segments, I project that prices in the Total Pet Industry will be up 0.6% in 2014 over the 2013 annual number. This is equal to the smallest increase of all time which occurred in 2010 and is only 35% of the average annual increase in the years since then. If the increases in the services weren’t greater than expected, we would be projecting a CPI increase of only 0.4% for the total industry – the lowest in history.
  • How does the YTD Pet performance compare to other Categories? Two that we relate to are:
    • The Overall CPI – which is up 1.4% since December
    • Food & Beverages – which is up 1.2% since December
    • Our overall increase of 0.6% is less than half that of these key indicators.
  • The last time we had this low of an increase in the CPI the price drops in Food and Products helped boost us out of declining consumer activity in a recession. There is no recession now. Consumers were accepting moderate prices increases in Food and the segment was growing. The continued low prices for supplies was actually still generating consumer purchases in increased amounts. The pricing in both of the Service segments is still growing at a concerning rate – with seemingly no impact on the Pet Services segment but a stagnation in the quantity of Veterinary Services. Prices always go up for both of these segments in the second half so the increases will continue. The big concern now is the continuing deflation in the supplies segment and the sudden drop in food prices which is contrary to the activity in the overall CPI and the corresponding “human” food & beverage category.

Many of you responded very positively regarding the info from my earlier CPI blogs. So when I got the USBLS info for June, I wanted to do a quick update. I assumed that it would be a simple checkpoint -“we’re halfway through”. It ended up being a bit more complicated.

We are into the second half of the year with anticipated strong holiday and fall/winter lifts in many categories. The pricing situation in all Segments is not as positive as we expected. Everyone in the industry needs to focus on efficiently maximizing their efforts in this critical time of the year. Then, we will just have to wait and see how it plays out in terms of the impact on the consumer and whether we meet or beat our forecasted numbers.

In my next Post, we’ll try to answer the consumer question, “What is the best (cheapest) and worst (most expensive) month to buy…?”

The Pet Market Bounces Back !/? 2009 > 2014 – Part 3: The Total Pet Market – The Bottom Line

In the first 2 Posts we looked at the individual Market segments. Let’s see how they come together to produce the Total Market from 2009 to 2014.

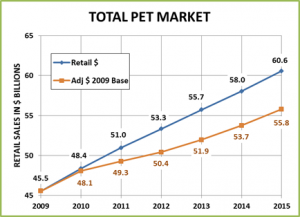
Here is the data for the TOTAL PET MARKET

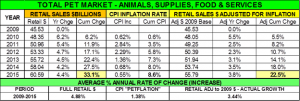
9-14-TotalPetData

Here’s a “Visual” comparing Retail $ to Sales adjusted to remove price increases:

9-14-TotalPetChart

TOTAL PET Market 2009-2014 Recap

Growth

  • Retail for the TOTAL PET Market  grew 28.5% (average annual growth rate 5.14%)
  • CPI (Prices) went up  8.7% (average annual increase 1.68%)
    • Only 1/3 of the Total Market growth came from price increases
  • Adjusted growth: 18.2% (average annual growth rate 3.4%)

Key Waypoints

  • 2010 – Overall “flat” prices drove sales sharply up – Adjusted Sales 90% of full retail $ Sales
  • 2011-2014 – Continued steady sales growth – moderate price increases

The Future

  • The Market seems to have reached an “equilibrium” for growth with price increases in the 1.5 to 2.3% range. The problem is this is made up of different segments. It’s critical for Food to stay in this range. Will supplies prices continue to drop, stay flat or turn upward again? Pricing in the Veterinary market is depressing sales. The same could happen in Services as this segment comes into more widespread usage with the consumer.

The Pet Market Bounces Back !/? 2009 > 2014 Summary

As we said, in 2008 and 2009 the Pet Market took a dip. Although Retail Sales increased, for the first time consumers bought less in terms of the amount of goods and services.  It rebounded in 2010 and appears to be growing again. Here is a summary of our findings:

Veterinary Services

  • Full Retail:  $12.04B > $15.25B;  +26.7%  (average growth  4.85%)
  • CPI Petflation :  +18% (annual average  price increase 3.37%)
  • Sales Adjusted to 2009 $ : $12.04B > $12.92B; +7.3% (average growth  1.42%)
  • Veterinary Sales Adjusted for price increases actually decline in 2011 and 2012 and growth stagnates. Overall, 70% of Veterinary growth comes from price increases.

Non-Vet Services

  • Full Retail: $3.36B > $$4.73B;  +40.8% (average growth 7.08%)
  • CPI Petflation:  +12.3% (annual average price increase 2.35%) –
  • Sales Adjusted to 2009 $: $3.36B > $4.21B (average  growth 4.63%)
  • Non-Veterinary Services have moderate price increases and strong overall growth during the entire period. – only  1/3 of Growth from price increases. However, it’s a small segment.

Pet Food

  • Full Retail $17.56B > $22.62B; +28.8% (average growth 5.19%)
  • CPI Petflation:  +9.6% (annual average price increase 1.85%)
  • Sales Adjusted to 2009 $17.56B > $20.64B (average growth 4.63%)
  • Pet Food prices drop in 2010, helping to spark overall market growth. Then moderate CPI increases of 2.5% account for approximately 50% of growth.

Pets & Supplies

  • Full Retail $12.57B > $15.91B; +26.6% (average growth  4.83%)
  • CPI Total Petflation:  -4.7% (annual average price DECREASE -0.96%)
  • Sales Adjusted to 2009 $: $12.57B > $16.69B (average growth 5.84%)
  • Pets & Supplies prices drop in 2010 and stay down – and even fall further. This spurs renewed and vigorous purchasing by consumers who buy even more, while paying less.

Total Pet

  • Full Retail $45.53B > $58.51B; +28.5% (average growth  5.14%)
  • CPI Petflation: +8.7% (annual average  price increase 1.68%)
  • Sales Adjusted To 2009 $: $45.53B > $53.83B (average growth 3.4%)
  • Price drops in Food & Supplies keep overall CPI flat in 2010 – resulting in the strongest overall market growth in 7 years. Current growth – only 1/3 comes from price increases.

The Future

Yes, the Pet Market has “bounced back” and is once again growing in the amount of products and services consumers buy – not just the Retail price we charge them. However, we have seen that every segment of the market has price sensitivity. It appears that a healthy Pet market requires an overall CPI increase in the range of 1.5 to 2.5%.

Pet Food is of course the largest segment and the ultimately the “driver” of the industry. Because of the usage rate this is a very price sensitive segment. The consumer has shown that they will accept reasonable increases in prices just as they have in the human food & beverage segment – 1 to 2.3%. Quality is also of ever growing importance as Americans become more “nutritionally aware”.

Pet Supplies is the other side of the coin. In the last 20 years this Segment has been systematically commoditized – one category at a time. Rawhide, tieouts, collars & leads, cat toys, dog toys…to name a few, are largely viewed by the consumer as commodities. And the list of “transformed” categories keeps growing. With a commodity, brands don’t matter. 64% of Americans now believe “Brand names are not better quality” (Time – 11/1/12). Only 25% of Americans consider Brand loyalty as a determining factor when making buying decisions. (Forbes 1/7/13) So the price becomes the only issue for the consumer. If the price deflation continues in this segment, manufacturers will need to run their businesses even more efficiently because of escalating price pressures. Of note: through May of 2014, the CPI for supplies continues its downward trend.

The Veterinary services segment is an area of legitimate concern. Although retail $ have increased, the amount of services has essentially been the same for 4 years. We could see major changes in this market, with consumers moving to OTC remedies, the development of improved Pet Health Insurance to mitigate everyday costs, the creation of more Veterinarian groups and even Pet HMOs. This is what ultimately happened when Human Health Care Costs began their radical and continued upward rise in the late 60’s.

So far the small, but rapidly growing Pet Services market has not experienced “hitting a consumer price wall” which has happened in every other segment. As this segment develops a broader consumer base, it becomes more likely that “price” will become an issue.

The Pet Market is complicated with the interaction and inter-dependency of the various segments. Pet Businesses must ultimately focus on the 3 “drivers” of the American consumer”:

  1. Value (Not just price but a combination of quality + price)
  2. Convenience – It’s a complicated life. Anything that makes it easier in regard to our companion animals.
  3. Selection – Americans always want a “choice”.

Each Pet business needs to take a hard look internally at how they do business. They need to maximize their efficiency in every aspect of the business in order to succeed in a Pet Marketplace which has become more consumer demanding and competitive.

This link will connect you to a mid year update,

The Pet Market Bounces Back !/? 2009 > 2014 – Part 2: Pet Food and Pets & Supplies

In our last post we discussed the performance of the the Services segments during 2009-2014. We’ll now turn the spotlight onto Products – Food and Supplies.

We’ll start with the largest segment – Pet Food

9-14-FoodData

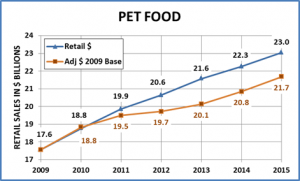
 Here’s a “Visual” comparing Retail $ to Sales adjusted to remove price increases:

9-14-FoodChart

Pet Food Market 2009-2014 Recap

Growth

  • Retail for Pet Food grew 28.8% (average annual growth rate 5.19%)
  • CPI (Prices) went up 9.6% (average annual increase 1.85%
    • Only 35% of this segment’s growth was from price increases
  • Adjusted growth (factoring out prices) – 20.64% (average annual growth rate 3.3%)

Key Waypoints

  • 2010 – Spurred by price drop – sales “took off” – 7.2% adjusted sales growth…actually exceeded full retail growth.
  • 2012 – Price “bump” slowed growth
  • 2011-2014 Generally steady growth

The Future

  • This is the largest segment and has a great impact on the market. Although it is a necessity there is price sensitivity. It appears that the best growth appears when the annual increase in CPI is kept to 2.3% or less

Now let’s look at Pets & Supplies

9-14-SuppliesData

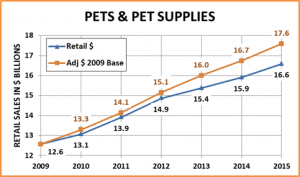
 Here’s a “Visual” comparing Retail $ to Sales adjusted to remove price increases:

9-14-SuppliesChart

Pets & Supplies Market 2009-2014 Recap

Growth

  • Retail for Pets & Supplies  grew 26.6% (average annual growth rate 4.83%)
  • CPI (Prices) went DOWN 4.7% (average annual DECREASE 0.96%)
    • Adjusted Sales growth (the amount) ACTUALLY EXCEEDED Full Retail Sales $
  • Adjusted growth:  32.8% (average annual growth rate 5.84%)

Key Waypoints

  • 2010 – Spurred by price drop – sales “took off” – Adjusted Sales Exceeding full retail $ Sales
  • 2011-2012 – Continued strong sales – Peak adjusted growth 7.1% in 2012
  • 2013-2014 Sales Growth – Both Full and Adjusted slowing but still strong

The Future

  • The consumer is buying more and paying less. This demonstrates the price sensitivity in the market. However, a prolonged period of deflation will increase pressure on all manufacturers. In the estimate above, it was assumed that the CPI would only fall 0.8% in 2014. So far through May, the indications are that prices could drop a full point or more again!

In the final Post in this series we will take a look at how these segments blend to produce the overall Total Pet Market!.

The Pet Market Bounces Back !/? 2009 > 2014 – Part 1: Pet Services

In 2008 and 2009 the Pet Industry took a dip. Retail Sales still went up but in terms of the amount of Pet goods and services, the consumer actually bought less – just paid more – in each of these successive years.

In 2010 this turned around as both Retail $ AND the amount purchased rebounded strongly. We’ll take a closer look at the period from 2009 to 2014 – by industry segment as this recent market performance has a direct bearing on the future.

There are 4 segments in the Pet Market as recognized by the USBLS:

  • Veterinary Services
  • Non-veterinary Services
  • Pet Food
  • Pets, Supplies and Accessories

We’ll divide this into 3 Posts: Services, Food & Supplies and Total Market.

For this 2009-14 period analysis of this and other segments, we’ll establish our “Base” year as 2009. All changes will be relative to this year’s numbers.

We’ll start with Veterinary Services:

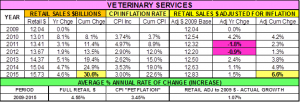
9-14-VetData

Here’s a “Visual” comparing Retail $ to Sales adjusted to 2009 to remove price increases:

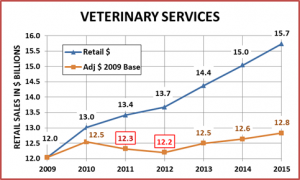
9-14-VetChart

 Veterinary Services Market 2009-2014 Recap

Growth

  • Retail for services grew 26.7% (average annual growth rate 4.85%)
  • CPI (Prices) went up 18% (average annual increase 3.37%)
    •  70% of this segment’s growth was from price increases
  • Adjusted growth (factoring out prices):  7.3% (average annual growth rate 1.42%)

Key Waypoints

  • 2011 & 2012 – Years of ever increasing prices cause consumer reaction. They bought less in terms of the amount of services – just paid more in two successive years.
  • 2013 – Market still has not yet got back to 2010 levels in terms of the amount of purchases.

The Future

  • The estimated increase in retail purchases of 6.1% for 2014 seems ambitious. Moreover, the supply segment is seeing a rapid growth in OTC meds and supplements as the consumers look for home remedies.

Now we’ll consider Non-Vet Services like grooming and boarding.

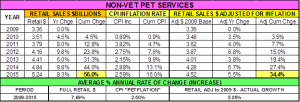
9-14-ServData

 Here’s a “Visual” comparing Retail $ to Sales adjusted to remove price increases:

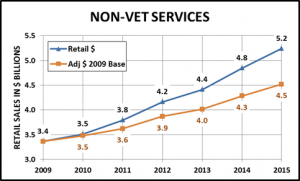
9-14-ServChart

 Non-Veterinary Services Market 2009-2014 Recap

Growth

  • Retail for Non-Vet services grew 40.8% (average annual growth rate 7.08%)
  • CPI (Prices) went up 12.3% (average annual increase 2.35%)
    • Only 1/3 of this segment’s growth was from price increases!
  • Adjusted growth (factoring out prices) – 25.4% (average annual growth rate 4.63%)

Key Waypoints

  • Every year minimum adjusted growth rate of 3.5%
  • 2012 – Market enjoys spectacular growth – 9.8% retail and even 6.8% after price adjustments

The Future

  • This is a small but fast growing segment. No indication of hitting a pricing wall…yet. As this segment becomes larger with more participating consumers, pricing pressure may become an issue.

In our next Post, we’ll look at the Pets & Supplies and Pet Food Segments.


Pet Market Growth – How much is “real”? – Part 3 – The bottom line.

The Retail Pet Market has grown from $22B in 1997 to $58.5B in 2014 – a 165.9% increase. At the same time prices in the industry have gone up 66.8%. How do you factor out the price increases to show the growth in terms of the actual amount of goods and services sold?

One way is to use the CPI published by the USBLS to adjust each year’s retail sales back to 1997 ($) Dollars (the base year).

When you do that you get a spreadsheet that looks like this:

PetAdjRetl-Data

A lot of details! We can refer back to this chart to reference specifics. Let’s look at the Bottom Line in a more visually friendly way.

Here you go: The Pet Market from 1997 to 2014 – Full Retail and Adjusted to 1997 $ (removing price increases)

PetAdjRetl-Chart

Let’s pull this all together with a brief summary of the 1997 – 2014 history

Overall growth

  • Full Retail Sales – 165.9% (Average annual retail growth 5.92%)
  • Petflation – 66.8% (Average annual price increase 3.06%)   
    • More than half of the industry’s average annual growth came from price increases
  • Adjusted Growth Taking out price increases – 59.4% (Average “actual” growth 2.78%)

Petflation

  • Driven by huge increases in Veterinary Services (125%) and Other Services (75%)
  • Pet Food Price increases are close to those for Human Food & Beverage
  • Pets and Supplies have only increased by 14% in 17 years.

Key Waypoints

  • 2002 – The first year that the Petflation rate exceeded the National CPI
    • The result – actual increase in the amount of Pet Goods and Services only 0.3%
  • 2008 & 2009 – The 2 largest price increases in the 17 year history
    • Retail Sales went up in 2008 but Consumers BOUGHT LESS – they just paid more.
    • Retail Sales also increased in 2009 but Consumers BOUGHT EVEN LESS – paid even more.
  • 2010 – Prices continue upward in Services but drop in Food and Supplies. Net increase: 0.6%
    • The consumers respond with renewed purchasing vigor. Adjusted growth rate is the largest in 7 years and the third largest in the 17 year period.
  • 2011 > 2014 – Service prices continue to go up rapidly but Food price increases come back to a more reasonable rate. Supply prices stabilize and even fall further.
    • Price increases now represent less than half of the average annual growth %.

So… “How much of the growth is real?” Obviously, in terms of full retail dollars, the growth is all real. You can take it to the bank. However, more than 50% of the average annual growth has come from price increases, not from increased sales of goods and services. The resulting price adjusted annual growth rate of 2.8% still indicates a moderately strong Pet Market.

It should also be noted that like other markets, Pet does have price sensitivity. While Retail Sales have increased every year, large price increases in the Recession years resulted in consumers buying less – usually not a good plan for long term growth. The good news is that they have responded positively to subsequent price drops and a continuing moderate rate of increase in the CPI.

Of concern is the continued high rate of price increases in the Veterinary Segment. When will the consumer react? On the other end of the spectrum, will deflation continue in the Supplies Segment. This will put added pressure on manufacturers.

In our next post we will begin a detailed look at the period from 2009 to 2014. This recent history has the most relevance to the continued growth of the market .

Pet Market Growth – How much is “real”? – Part 2 – What segments are driving price increases?

In the period from 1997 to 2014 prices in the Total Pet Market increased 66.8%. Was this an “across the board increase” or are there specific areas “driving” Petflation? In 1997 the USBLS officially divided the Pet Market into segments and established it as the base year for future calculations. The segments are:

  • Veterinary Services
  • Pet Services – Non–Vet: grooming, boarding, etc.
  • Pet Food
  • Pets, Pet Supplies & Accessories

Let’s take a look at the price increase history by segment

PetSegmentsCPI

Perhaps the most obvious trend in the chart is the huge increase in Veterinary prices – 125.6%. This is 48% greater than the increase in Human Medical services (86%). A service that cost $100 in 1997 now costs $225.

Pet Service Prices have increased 75.6% – 60% faster than the overall National CPI (47.2%). A $22 service in 1997 now costs $50.

The Prices in the huge Pet Food segment have increased 57.7%. This is only slightly greater than the 53% increase in the comparable Human Food & Beverage market. There have also been variations. After big increases in 2008 & 2009, prices actually dropped in 2010 and the increases since then have been more moderate.

The Pets and Pet Supplies segment tells a totally different story. Driven by Supplies, this segment had regular small increases for years. In 2005 these increases began to accelerate with huge increases in 2008 and 2009. Then in 2010 prices suddenly dropped and have stayed down in all the succeeding years. In fact we have actually even seen further declines. The total Petflation for Pet Supplies from 1997 to 2014 is only 14%.

Now it is easier to see how the segments are interacting to produce the overall Petflation rate of 66.8%.

Pet Food is the largest segment so changes here have the greatest impact on the Total. The inflation rate of 57% in Pet Food is less than 9% greater than Food & Beverages so this has a stabilizing influence.

The big drivers of Petflation are Services – both Veterinary (125%) and NonVet (75%). The NonVet Services is a small segment but Veterinary has become large and is “fueling” much of the increase.

The CPI increase in the Pet Supplies segment has invariably been low and has even become negative. These consistently low prices have helped mitigate overall Petflation.

Now what does this all mean? What is the Industry bottom line?

In the next post we will blend the CPI increase with the Retail sales, factor out price increases and show the performance of the market in terms of the amount of Pet Supplies and Services sold.


Pet Market Growth – How much is “real”? – Part 1- CPI “Petflation”

The Pet Industry has shown outstanding and continuous retail growth in the last 17 years. From 1997 to 2014 (projected) it has grown 165.9%. This is an average annual growth rate of 5.92%.

Here’s what it looks like:

PetMkt-FullRetl

Why pick 1997 as a “starting” year? Why not 1996 or 1994? As it turns out 1997 was a very significant year for the industry. In 1997 the United States Bureau of Labor and Statistics (USBLS) recognized the growing significance of the market by dividing the Pet market into distinct segments and establishing 1997 as the base year for future measurements.

The USBLS produces a variety of important economic statistics but perhaps the most famous and arguably most impactful is the CPI – Consumer Price Index – the inflation rate. Changes in the CPI directly affect the income of over 80 million Americans. It is also used by the President, Congress and the Federal Reserve Board in formulating fiscal and monetary policies.

We all know that price increases in Pet Products are a part of the business. When the costs of energy, labor and raw materials rise, price increases become a business necessity. However, since price increases can directly affect consumer purchasing decisions, they can’t be taken lightly.

Let’s take a look at “Petflation” since 1997 and see how it compares to the overall CPI and to some other industries:

CPI-1

The first thing that you notice is the strong and unchecked increase in prices for human medical services. Regardless of overall economic conditions, medical prices have consistently gone up. This has to be a factor in our current health care situation.

By the way, prices don’t always go up. Prices in the Apparel market are actually 3% less than they were 17 years ago. A big factor is probably the “offshore” movement of manufacturing in this segment.

But back to Pet. The CPI increase in overall Pet Products and Services is 66.8%. It is not as great as Medical but it is 26% higher than Food & Beverage (53.0%) and 41% higher than the overall CPI (47.2%).

Was it always this way? The answer is no. The first year that Petflation exceeded the national CPI was 2002. It also began to accelerate in 2006 with major increases in 2008 and 2009 – in the midst of the national economic recession.

In 2010 this abrupt upward spiral stopped. In the years since, Petflation has “mirrored” the overall CPI and the Food & Beverage Market.

What does all this mean? How has it affected the consumer? We will get to that “bottom line” but first we’ll look at what is “driving” the Pet price increases. Remember the USBLS divided the market into segments.

In our next post we’ll look at the CPI since 1997 for each of the segments in the Pet Market. Have prices gone up equally across the board or….

[box] Note on Data in this and related Posts: The Pet Retail Sales data is taken from numbers published by the APPA which they obtained from various sources. The APPA published sales of $21B for 1996 and $23B for 1998. The $22B sales for 1997 were estimated by assuming an equal growth rate of 4.65% for 1996>97 and 1997>98. The CPI data is the annual rate from reports downloaded from the USBLS website. For 2014 estimates, the change in CPI was assumed to be the same as for 2013.[/box]

Welcome to PetBusinessProfessor.com

Welcome to PetBusinessProfessor.com. My name is John Gibbons. I have been in consumer products sales and marketing for 35 years – the last 25 years have been spent in the Pet Industry.

My responsibility during that time has been National Sales and/or Marketing for such companies as TFH/Nylabone, Aspen Pet (acquired by PetMate), Coastal Pet and Paragon Pet Products.

Strategies, tactics and execution have been my focus in driving the profitable growth of these businesses.
I have learned a few things along the way – often the “hard way” ….and even developed some tools, templates and techniques to make the journey for others a little easier.

I established this website to encourage the exchange of these ideas among Pet Businesses and continue learning new ones. The industry only remains strong if the business elements remain strong.

My experience is primarily from the viewpoint of the manufacturer. However, the topics that we will discuss should be relevant to any Pet Business.

The Pet Market starts with the Manufacturer and ends with the consumer. Take a look at the chart below:

PatternsOfDistribution

Unless the Manufacturer is selling directly to the consumer out of their own warehouse, there will be other businesses involved. As you can see there are a number of different options. “Partnerships” between businesses are generally required to reach the ultimate customer – the consumer.

I have found one universal rule in business –
“For a partnership to work, everyone must make money!”

Some of the topics we cover will be of immediate interest to everyone. Others will be more directed to a specific group. However, all are directly relevant to maintaining a strong Pet Industry so they are relevant to us all.

I look forward to “talking” with all of you!