Spending, CPI, demographics of overall market

2016 U.S. PET SUPPLIES SPENDING $15.84B…UP ↑$0.94B

Driven by consumers value shopping for Pet Food, Total Pet Spending dropped by -$0.46B in 2016. Most of the $3B that consumers saved on food was applied to other segments, like Supplies, which recorded a $0.94B (+6.3%) increase to $15.84B. (Note: All numbers in this report come from or are calculated by using data from the US BLS Consumer Expenditure Surveys)

Although the increase only gets back about half of the $2.1B drop in Supplies Spending in 2015, it is certainly a turn in the right direction. We’ll “drill down” into the data to try to determine what and who are “behind” the beginning of this comeback for Supplies.

First, Supplies’ Spending per H/H in 2016 was $122.25, up 5.4% from $115.97 in 2015. (Note: A 2016 Pet H/H (65%) Spent $188.08) Slightly Increased H/H Spending is the main story in 2016. Other factors remain relatively unchanged. The $0.94B increase in spending came as a result of:

  • 0.9% more H/H’s
  • Spending 4.9% more $
  • 0.5% more often

Let’s start with a visual overview. The chart below shows recent Supplies spending history.

You can’t discuss spending trends in the Supplies segment without talking about price – the CPI. Although many supplies are needed by Pet Parents, when they are bought and how much you spend is often discretionary. Many of the product categories in this segment have become commoditized so price is the main driver behind consumer purchasing behavior. When prices fall, consumers are more likely to buy more. When they go up, consumers spend less and/or buy less frequently. The big $2B drop in Supplies Spending in 2015 was driven by money. Many consumers upgraded their food, spending +$5.4B more. This gave them less to spend on other aspects of Pet Parenting. The Supply Segment suffered as consumers spent 4.1% less, but more importantly, they bought 10% less often. That seemingly small drop in purchase frequency (ex: Buy every 33 days instead of buying every 30 days) was the biggest reason behind the $2.1B drop in spending.

2014 was a deflationary year. As prices dropped, consumers bought more, +$2B more by year’s end. Then prices stabilized and began to move up in 2015. The consumers reacted immediately by spending less. Prices dropped like a rock in October to levels last seen in the spring of 2007. It undoubtedly helped, but was not enough to stave off the impact of the first 9 months of the year so spending fell -$2.1B in 2015.

In 2016 Prices initially stayed below 2015 levels. Spending stabilized and began to increase in the second half. Then prices jumped up in October and November. Although there was a big price drop in December, this autumn increase may have slightly reduced the overall gain for the year. By the way, prices in 2017 were down vs the same period in 2016, but they turned up sharply in July. We’ll see what happens.

That gives us an overview of the situation. Now let’s look at the “who” behind the spending increase. First, by income level. The 2016 numbers in this chart and the one on Age Groups are highlighted to give you a better visual “read”.

  • If outlined in green, sales were up in 2016
  • If outlined in red, sales were down in 2016
  • If highlighted in green, sales were up from 2014
  • If highlighted in pink, sales were down from 2014

Observations: Although Spending is down from 2014 across the board, it did increase in 2016 for all but one group.

  • $30K>$70K (45.9% of H/H’s)- $7.13B Up  $0.8B (+12.6%). This lower middle income, value conscious group accounted for most of the drop in 2015. In 2016 they produced 80% of the spending increase.
  • $100K>$150K (12.5% of H/H’s) – $2.79B Down -$0.3B (-9.7%). This group had the best performance in 2015 as their spending was “flat”. In 2016, they were the only group that spent less. This goes beyond Pet Supplies. They actually spent less on their total H/H expenditures. Yet another indication that value shopping is widespread.
  • Higher Incomes – These groups are growing in H/H’s so in 2015 the US BLS began to define more groups – $150>199K and $200K>. This could be interesting. For example, in 2016 the combined $100>199K income group spent -$0.61B less on supplies while every income group above and below that level spent $1.55B more.

Now, we’ll look at spending by Age Group.

Observations: There is much more variation by Age Group. Spending for some groups is actually above the 2014 level.

  • 45>54 (18.6% of H/H’s) $152.93 per H/H – $3.68BUp $0.2B (+5.6%) This group has the highest income and overall expenditures and…spends the most on Pet Supplies. They spent less on food and their supplies’ spending rebounded, but not to 2014 levels.  Fewer H/H’s (-0.8%) spent 3.7% more on supplies, 2.6% more often.
  • 55>64 (19.0% of H/H’s) $135.96 per H/H – $3.35B – Down -$0.01B (-0.3%) This “Boomer” group spent $2.6B less on Food in 2016 but they didn’t use the savings to spend more on Supplies. Actually, 2.3% more H/H’s spent -2.7% less on Supplies, 0.3% more often. Without the increase in H/H’s, the drop would have been larger.
  • 35>44 (16.6% of H/H’s) $146.01 per H/H – $3.13B – Up $0.68B (+28.1%) This group is second in income and overall expenditures. In 2016 these Gen Xers took over 2nd place in H/H spending on Pets & Supplies which bodes well for the future and makes them a prime marketing target. Their 2016 spending increase even put them 3% ahead of 2014. They got there by spending 26.4% more, 1.6% more often.
  • 65> (24.1% of H/H’s) $97.42 per H/H – $1.89B – Up $0.59B (+24.3%) This group is growing rapidly. In 2016 they saved money on food and spent more on supplies. 4.2% more H/H’s spent 20.4% more, -0.9% less often.
  • 25<34 (16.1% of H/H’s) $101.22per H/H – $2.68BDown -$0.57B (-21.0%) In 2016, these older Millennials upgraded their Pet Food. They have strong price pressure – starting families and careers. They spent 18.0% less on Supplies and bought -3.0% less often.
  • <25 (5.6% of H/H’s) $71.48 per H/H – $0.52B – Up $0.03B (+7.3%) This small group is getting smaller, down -3.9%. They spent 1.1% more on supplies, but importantly, 10.5% more often.  They continue to acquire pets.

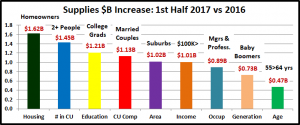
Finally, let’s take a look some other key demographic “movers” behind the 2016 Pet Supplies Spending increase.

Summary

The big drop in spending in 2015 was primarily driven by a 10% reduction in the frequency of purchase. In 2016, the frequency remained essentially unchanged. This puts a greater emphasis on the retail price at the time the buying decision is being made. The CPI remained down for much of 2016, turned up slightly in the fall, then fell sharply in the prime buying month of December. The CPI inflated ever so slightly, 0.1% for the year but the consumer still spent more. This could be a future model for increased spending on Supplies without the need for deflating prices, which puts strong margin pressure on manufacturers and retailers.

The increase in Supplies’ spending was not universal across all demographics. However, in some categories spending differences were less noticeable. Homeowners and Renters, as well as consumers with or without a college degree, showed positive numbers. There was also no decrease in spending by any racial or ethnic group.

The 35>44 year old Gen Xers showed a big increase and they were joined by the over 65 group, which also spent significantly more. We see these numbers reinforced by strong performances by married couples whose oldest child is between 6 and 17 and by retired and no earner households. Although it should be noted, that as a whole, all wage and salary earners spent more on Supplies. The only occupation with a decrease was the self-employed.

There were a couple of surprises. The Central City dwelling Consumers drove 98% of the increase while the Suburbs and Rural H/H’s were basically flat. Also, the $100>$199K income group had reduced supplies spending. In fact, their spending was down in all industry segments. This demonstrates that price matters to virtually everyone in the U.S.

The $0.94B increase in Supplies spending was obviously great news. How it happened is also very important. It occurred without pressure from overall deflated prices. It also came as a result of increased spending from a wide range of demographic groups. Both of these factors make the increased spending more likely to “stick” and the performance more “repeatable”. The CPI price pattern for 2017 so far looks very similar to 2016. We’ll see what happens.

2016 U.S. PET FOOD SPENDING $26.5B…Down↓ $2.99B (-10.1%)

The U.S. Pet Industry had basically a “flat” year in 2016. Spending fell slightly to $67.29B, down $0.46B (-0.7%). However, as we have learned, the industry truly is a “sum” of its integral segments. Each segment has very specific and often very different buying behavior from the many consumer demographic segments. For this reason, we’re going to analyze each of the segments first. This will put the final analysis of Total Pet Spending into better perspective. Note: The numbers in this report come from or are calculated by using data from the current and past US BLS Consumer Expenditure Surveys. In 2016, this was gathered by the U.S. Census Bureau from over 40,000 interviews and spending diaries. The final data was then compiled and published by the US BLS.

We will start with the largest Segment, Pet Food (and Treats). In 2016 Pet Food Spending totaled $26.5B in the U.S. This is a $2.99B (-10.1%) decrease from 2015. For most of us, this is quite a shock coming after the spectacular $5B increase in 2015 which was attributed to consumers upgrading to Super Premium Foods. Doesn’t Pet Food Spending just increase every year? Isn’t that a sure bet? Well, as it turns out, the story is a little more complex than that. The following chart documents annual Pet Food Spending since 1997 in full Retail Dollars and adjusted for inflation.

An interesting pattern is immediately apparent. Retail Pet Food Spending increases for 2 consecutive years then reaches a plateau year or even drops. The pattern is repeated with one notable exception – the time from 2006 to 2010. As you recall, this was a tumultuous period for the entire retail marketplace. In 2009 the Great Recession caused the first drop in U.S. Retail Spending since 1956. The situation in Pet Food was even more complex with the Melamine recall in 2007. Pet Food Prices skyrocketed in 2008 and 2009 as consumers insisted on made in USA products …with USA ingredients. The CPI adjusted sales show that the first Recession related impact on Pet Food purchases occurred in 2009 but the full retail impact wasn’t felt until 2010.

Pet Food seems to be driven by short term trends. A new food trend “catches the consumers’ attention” and grows…for 2 years. Then sales plateau or even drop…and we’re on to the next “must have”. It is obviously more complicated than this simplistic explanation. However, it does appear that the big drop in Pet Food Spending in 2016 shouldn’t have been totally unexpected considering the spending history of this huge Industry segment

I’m not an expert on the Pet Food segment but I included my view of the more recognizable trends. Sales seem to have really taken off after 2003. That was the year that Iams went into the Mass Market and may have signaled the first phase of the premiumization of Pet Food. Then came “Made in USA” because of the melamine recall which was followed by “Natural”. Then in 2014, we got “Super Premium”. What is next? The indication is ever-increasing “humanization”.

Now, let’s look at some specifics. In 2016, the average U.S. Household (pet & non-pet) spent a total of $204.71 on Pet Food. This was an 11.0% decrease from the $230.06 spent in 2015. This doesn’t “add up” to a 10.1% decrease in total Food Spending. With additional data provided from the US BLS, here is what happened.

  • 1.0% More U.S. households
  • Spent 12.6% less $
  • 1.8% more often

By the way, if 65% of U.S. H/H’s are pet parents then their annual Pet Food Spending is $314.94. Let’s look at a rolling history of Pet Food Spending over the course of the “Super Premium Cycle”.

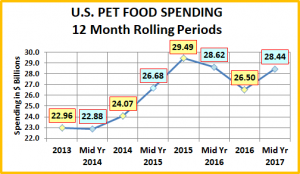
Pet Food Spending dipped in the first half of 2014. This corresponds to the beginning of a 2 year deflationary period in this segment. During deflation, in a “need” category like Food, you don’t buy more, you just spend less. The spectacular lift in Pet Food Spending beginning in the second half of 2014 came from a fundamental change in spending behavior. Consumers began to buy more Super Premium Food and Med/Supplements in Treat form, all of which cost more.

Then spending began to fall in the first half of 2016 and the decline intensified in the second half. Does that mean that Pet Parents were giving up on Super Premium and going back to their “old ways”? In some cases…maybe. However, consider this fact about current U.S. Consumers…price is the biggest driver (75%) of their behavior.

Once a consumer has decided on a specific type of product or brand, there is only 1 priority. Where and how can I buy it cheaper? Consumers spent 12.6% less on their Pet Food purchases in 2016. Were discounts available?

  1. Competition between manufacturers invariably generates lower prices. Let’s look at the number of exhibitors offering either Dog and/or Cat Food or treats at recent SuperZoos:
    • In 2014 there were 105 Companies offering Dog/Cat Food and 230 selling Dog/Cat Treats
    • In 2015 there were 107 with Food and 239 with treats – Not much change
    • In 2015 we had the huge lift in Food/Treat spending. By the time we reached SZ 2016 there were 134 companies offering Food – (up 27.6% from 2014) and 304 with Treats – (up 32.2%)
    • By 2017 there were 147 Food companies offering Pet Food (+40.0%) and 313 with Treats (+36.1%)

These new companies created and felt intense competitive pressure for the “upgrading” consumers. However, there was also intense pressure from “regular” food companies as they were actually losing consumers to the “upgrade”.

  1. Competition between retailers and retail channels also is a price battleground.
    • There has always been a price war between Independent Pet Shops, Pet Chains and Mass Market Retailers. With the consumer price falling as a brand moves to Chain Pet, then Mass, the only way to protect the indies and pet chains is through strict channel product segregation. This lasts for a while but as brands grow they want to “reach” even more consumers, so….
    • The Internet is a new player in this Pet Food Game. With no brick ‘n mortar overhead, they can offer discounts of 10>15% or more and deliver it to the consumers doorstep.
      1. In fact Non-refrigerated, Premium Pet Food may be an ideal internet product
        • While consumers have a lot of choices for their own dinner – cook, sit down at a restaurant, grab fast food or have it delivered, their pet needs the same thing every day at the same time – without fail.
        • Pet Products (primarily food) ranks #3 on the consumers’ list of reasons they “need” to go shopping. Only milk and bread drive more trips to the store.
        • If you need the same amount of pet food every day, without fail, you can make a very strong case for auto delivery to your door. You save 15% or more. You save a lot of trips to the store and…your pet is always “covered” with the pet food quality/brand of your choice. This begins to look a lot like a “no brainer”, especially as people opt for higher quality food.
        • The big question for the future is, “Can you effectively introduce a new pet food product/trend solely through the internet?” Consumers can certainly read about the benefits on the internet but they can’t see it, touch it, try it out or have a personal conversation about it unless they are in a store. This personal “contact” has always been a key factor for consumers in their decisions about Pet Products.

I think that it is pretty safe to say that there were discounts available. In fact 2016 may have been one of the most price competitive Pet Food markets in history – across all of its segments. U.S. consumers were seeking and finding “deals”.

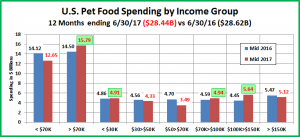
Now let’s look at some specific Pet Food Spending Demographics. First, we’ll look at income. We will do it a little differently as we will show the annual spending from 2013 through 2016 so you can see the trend for the whole cycle.

The 2016 numbers in this chart and the one on Age Groups are highlighted to give you a better visual “read”.

  • If outlined in green, sales were up in 2016
  • If outlined in red, sales were down in 2016
  • If highlighted in green, sales were up since 2013
  • If highlighted in pink, sales were down since 2013

The National Numbers were: 2015>16 – Down – $2.99B (-10.1%); 2013>2016 – Up $3.54B (+15.6%)

  • Under $30K: In 2016 (31.1% of H/H’s) – $116.18 per H/H – $4.48B – down $0.45B (-9.2%). Obviously this group is very price sensitive. The group also continues to shrink in size, down -2.0% in 2016. Since 2013, it is the only income group spending less on Pet Food but it is only down $0.01B. (-0.2%). However, there were 6.5% fewer H/H’s (3M) in 2016 than in 2013 so H/H spending actually increased. This group still has an ongoing commitment to their pets.
  • $30K>$70K: In 2016 (31.9% of H/H’s) – $182.68 per H/H – $7.99B – Down $1.59B (-20.0%). Income triples. Home ownership doubles. It is a more diverse group but the average H/H still spends more than their after tax income. The break-even point doesn’t happen until Gross Income reaches $57K. This group value shops but their decrease is so large that some members may have backed down from the upgrade. Since 2013, spending is up $0.38B (+9.2%)
  • $70K>$99K: In 2016 (14.1% of H/H’s) – $258.40 per H/H – $4.98B – Up $0.35B (+7.7%). This group is near the top of the “middle income” but still value conscious. Perhaps the price “war” finally reached a retail where the higher quality food became appealing. Since 2013 spending is up $0.38B (+8.3%)
  • $100K>$149K: In 2016 (12.5% of H/H’s) – $283.64 per H/H – $4.39B – Down $1.08B (-19.7%) This group has a high income but also has large families with the resulting responsibilities. They look for deals too. Also, since 81% have college degrees, it makes sense that they would excel at buying smart. Since 2013 spending is up $0.61B (+16.1%)
  • $150K> (10.5% of H/H’s) – $375.45 per H/H – $4.66B – Down $0.22B (-4.5%). 92% of this group have college degrees so they certainly know how to save. However, they have reached an income level where price is not as important. Since 2013 spending is up $1.85B (+65.8%) – half of the national increase. Money certainly makes choices easier.

In 2015, every income group except $70K>$99K increased its spending. With the spending drop in 2016, the positions were exactly reversed. This strongly suggests that there was a universal factor at work. It appears to be a competitive price war between manufacturers and retailers over the consumer’s Pet Food $. Since 2013, all segments but the <$30K group have increased total Pet Food Spending, although 52% of the national increase came from the over $150K group.

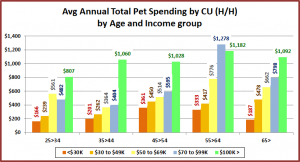
Now let’s take a look at another Key Demographic Category – Age

Again, the National Numbers were: 2015>16 – Down – $2.99B (-10.1%); 2013>2016 – Up $3.54B (+15.6%)

In 2016 Pet Food Spending, it was both ends against the middle. Under 34 and over 75 were up while 35>74 was down.

  • 55>64 (19.0% of H/H’s) – $310.48 per H/H – $7.41B – Down $2.61B (-26.0%). This group was the key to the huge 2015 increase in Food Spending and also to last year’s drop. They have the 3rd highest income and they are all Baby Boomers so naturally, 1.1% of their total spending is on their pets. Although some probably “rolled back” the upgrade, many more found deals on the product they wanted and spent less. They doubled their pet food spending in 2015 and 75% of that increase “stayed put.” Since 2013 spending is up $2.64B (+55.3%)
  • 65>74 (14.0% of H/H’s) – $217.86 per H/H – $3.79B – Down $0.8B (-17.5%). Much of this group is retired, with lower income, so searching for “discounts” is the norm. Some “upgraders” probably fell by the wayside but there are a growing number of Baby Boomers in the group and 1.0% of their total expenditures was on their Pets, just slightly behind the 55>64, all Boomer Group. Since 2013 spending is up +0.78B (+25.9%)
  • 75> (10.0% of H/H’s) – $114.62 per H/H – $1.48B – Up $0.33B (+29.3%). Both the effort and the expense of Pet Parenting become issues as we reach 75+. However, it appears that the discounted prices got this group “back on track”. Since 2013 spending is up +0.02B (+1.4%) – essentially flat.
  • 45>54 (18.6% of H/H’s) – $228.78 per H/H – $5.47B – Down $0.4B (-6.9%) This group has the highest income and the most in Total H/H expenditures. Up until 2015 they were #1 in Pet Food spending. They buy premium food but didn’t fully participate in the 2015 upgrade. They did take advantage of the 2016 discounts and spend less. The number of Boomers in this group is declining, replaced by Gen X. Since 2013 spending is down -$0.51B (-8.5%)
  • 35<44 (16.6% of H/H’s) – $181.15 per H/H – $3.84B – Down -$0.21B (-5.3%) They are 2nd in income and expenditures but have the biggest families. Searching for Value is a way of life. Since 2013 spending is down -$0.45B (-10.5%). These Gen Xers just haven’t kept pace with the trends in Pet Food
  • 25>34 (16.1% of H/H’s) – $171.16 per H/H – $3.70B –Up $0.71B (+23.8%) Their income is growing but so is spending. With 90% of their after tax income committed, they have strong financial pressures. In late 2014 they opted to upgrade their food. However, they backed down in 2015. The competitive pricing in 2016 must have “struck the right chord” as these older Millennials came racing back. Since 2013 spending is up +$0.89B (+31.7%).
  • <25 (5.6% of H/H’s) – $95.34 per H/H – $0.82B – Flat $0.0B (+0.0%) These youngest Millennials continue getting started as Pet Parents, maintaining 2015 spending levels. Since 2013 spending is up +$0.18B (+28.1%).

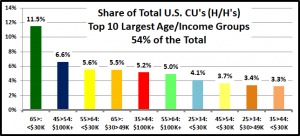
The chart below has some other key demographic “movers” behind the 2016 Pet Food Spending decrease. Take a look.

Summary

In the current “deflated”, highly price competitive market, it is difficult to get to the bottom of the decrease in spending. There certainly was no drop in pet ownership. So, did the decrease in $ come because consumers backed down from their 2015 upgrade to Super Premium foods or are they just taking advantage of the price competition to buy the products that they want for a cheaper price?  The answer is some of both. A certain percentage of lower income and price sensitive groups, like Retirees may very well have switched back to regular food. However, it appears that the bulk of the decrease comes from value shopping across a wide range of households.

Make no mistake. Price matters to U.S. consumers, especially on products that they buy on a regular basis. Consider that 50% of U.S. households spend more than their after tax income – a total deficit of -$550B. In fact, if you start from the lowest income group and work your way up, the total after tax income of the “bottom” 90% of U.S. households is only $2.2B more than their total expenditures (0.04%). Virtually every U.S. household compares products and prices before they buy. This process and for that matter, the actual buying, has gotten significantly easier in our internet world.

The biggest spending drops came from College Educated, Suburban, Homeowners. These are the smart pet parents that first saw the benefit of the upgraded food. It’s a good bet that they figured out how to buy what they want… cheaper.

On the flip side, the demographic groups showing spending increases in today’s market are definitely upgrading their food and/or adding pets to their families. The 25>34 year old Millennials are a prime example. Their $0.7B increase is reflected in and supported by increases for 4 person households, married couples with their oldest child under 6 and Technical workers. There also were increases by renters and Center City residents, which is more good news.

Probably the most concerning data is from the 35>54 age group, which is largely Gen Xers. Overall, they make and spend the most money of any age group. Their Pet Food spending in 2016 was down but they were also the only age group to show decreased spending in this segment from 2013. We’ll take a better look at this situation when we see the generation reports.

One of the key things that we learned in this analysis is that Pet Food spending doesn’t just go up every year. It appears to flow in 3 year cycles, corresponding with market trends. Two years of increases is followed by a plateau year or even a spending drop. Then consumers move on to the next “must buy”. Looking at this history, the 2016 drop fits the pattern. If history continues to repeat itself, we should have a flat first half of 2017. Then spending should turn sharply upward as the consumers respond to the continued “humanization” of our Pet Food. However, we’ll just have to wait and see.


U.S. Retail Trade – 2016 $ales Update by Channel – Going for the Gold!

The Total U.S. Retail Market in 2016 reached $5.5 Trillion dollars – up $172B (+3.2%). This is significantly better than last year’s (+2.3%). In 2016, the decline in Gas prices slowed but still caused a $25B drop in Gas Station revenue. At the same time, the increase in Auto and Restaurant sales also slowed. For this report, we will focus on the “Relevant Retail” Total – removing Restaurants, Auto and Gas Stations from the data. This still leaves us with $3.3 Trillion to “divvy up”.

In a recent report we reviewed the 2016 sales performance of the Top 100 U.S. Retailers. That covered the “Headliners” but everyone can’t be a headliner. How are specific Retail Channels performing? We’ll start with a market overview and then work our way down.    (Base Data is from the U.S. Census Bureau Retail Trade Report)

Also, Please Take Note: As you are reviewing this detailed data and wondering exactly how does all this relate to Pet Products sales, consider these 2 facts from the 2012 U.S. Economic Census:

  1. Retailers other than Pet Stores generated 66.5% of all the Pet Products revenue in the U.S.
  2. Pet Products, on average, generated 1.94% of the total revenue of all non-pet stores that chose to stock them.

  • Restaurants (Food Service) – 12% of Total Retail – up 5.9%, which was about 25% less than last year’s (+8.1%).
  • Automobile Sales – almost 21% of the Total – Revenue also grew +4.1%, but 33% slower than 2015’s (+6.3%)
  • Gas Stations – 7.6% of the Total (In 2014 they were 10.3%) – ↓Down 5.7% from 2015. Gas prices hit bottom in February ‘16 and turned up, passing 2015 prices in November, but still down 11% for the year. (CPI from USBLS)
  • Retail, Less Food, Auto and Gas – Up 3.6% to $3.3 Trillion, about the same as last year’s +3.5%. It is 59.8% of the total U.S. Retail market and is growing 12% faster than the Total but still slower than Restaurants and Auto.

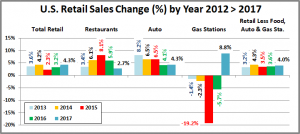
To put this year into perspective, let’s look at the overall performance in recent years.

The U.S. retail market has grown each year since 2012. It is just a matter of how much. In 2015 the precipitous drop in Gas prices had a huge impact on the overall market. Restaurants have shown accelerating growth but dialed it back in 2016. Auto sales are still strong but the growth is slowing. Our “Relevant Retail” Segment has been the most consistent. As expected, its 3.6% growth is below the 4.2% increase of the Top 100 Retailers. However, it will serve as a benchmark as we review the individual channels. Above 3.6%, a channel is gaining market share; Below 3.6%, they are losing share.

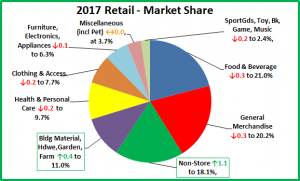
Now, we’ll slice up the U.S. “Relevant Retail” Channel “Pie”.

These are large slices of the U.S. Relevant Retail pie. Three divisions – General Merchandise Stores, Food and Beverage and Non-Store account for 58.8% of the total. This is up slightly from 58.6% in 2015. The increase is all from Non-Store Retailers. The other two major segments are losing share. All are very important to the Pet Industry. In our analysis of Pet Products Sales based upon the 2012 U.S. Economic Census, these three major divisions produced 59.7% of total Pet Products sales. Consumers spend a lot of money in Pet Specialty Stores but Pet Products are also “on their shopping list” in the outlets where they spend most of their money.

Because they are so huge, major Divisions of the market generally don’t show much movement in market share in just one year so the changes in General Merchandise, Non-Store and Food & Beverage are very significant. Each of the major divisions includes a number of sub segments. For example, General Merchandise includes Traditional Department Stores, Discount Department Stores, Supercenters and Clubs as well as $ and Value Stores. These specific retail channels can have even greater movement in share because this is the level that the consumer “views” when making their initial shopping choice. Change at this level is where any ongoing consumer shopping migration first becomes apparent.

Here is the Market Share change “Rule” for 2016: To gain 0.1% in Market Share your $ increase must exceed the amount generated by a 3.6% sales increase PLUS an additional $3.3B. Example: If a channel did $100B in 2015, they need to do $100 +$3.6 + $3.3 = $106.9B to gain just 0.1% in 2016 share. You will see channels with revenue increases that still lose share because the increase was less than 3.6%. It shows that even small changes in share are significant.

With that overview, we’re ready to drill deeper into the data. Let’s look at the 2016 performance of some of the specifically “Pet Relevant” Channels to see which are doing the best…and worst in gaining consumer spending. Eleven of the twelve were chosen because they generated at least 1% of the Total Pet Products (food & supplies) spending in the last Economic Census – 2012. I have also included Traditional Department stores on the list even though they have never truly embraced Pet Products. They have long been a fixture in the U.S. Retail Marketplace. Their continued decline, as consumers migrate to outlets which better fit their needs, has profoundly affected U.S. retail shopping as generally they were the “anchor” stores for the Shopping Malls across America.

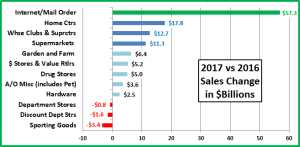
We will use 2 separate graphs to illustrate the situation in these Pet Relevant Channels. The first will show the % change in sales in 2016 vs 2015. The next will “show us the money” by translating the % into $ gained or lost. Then we will have observations on each segment

Remember, you must be up at least 3.6% or you’re losing market share!

The leader comes as no surprise. However, 9 of 12 these pet relevant channels, including some huge ones, are losing market share. In the next chart, we’ll “show you the money!” Remember, the Total increase for the “Relevant Retail” Market was $116B and you must be up 3.6% PLUS $3.3B just to gain just 0.1% in Market Share.

The relative growth in the Internet/Mail Order Channel is even more pronounced when you look at the change in $ spent!

OBSERVATIONS BY CHANNEL

Look for: (% of Total Business from Pet Products for stores that stock Pet – 2012 Economic Census)

  • Internet/Mail Order – $490.9B, Up $57.2B (+13.2%) – 49.4% of the total increase for the $3.3T Relevant Retail Market came from Internet/Mail Order. The Consumer Migration to this channel is accelerating – gaining 1.25% in Market Share in just a year and passing SuperCtrs/Clubs for the #2 spot behind Supermarkets. (1.2% Pet)
  • Super Markets – $600.3B, Up $12.4B (+2.1%) This largest sub-segment is no longer holding its ground as it lost 0.3% in Market Share in 2016 and 0.5% since 2014. The Internet/Mail order channel has recently put increased focus on grocery products and is pushing very hard to become the leading retail channel. (1.6% Pet)
  • Department Stores – $56.4B, Down $2.5B (-4.3%). As stated, this segment is not particularly relevant to Pet but they are part of the best “visual” example of the channel migration of the U.S. consumer. 50 years ago they “ruled” the GM category. Then they started to slide as they failed to adapt to the changing wants and needs of the consumer. One small example of this is their failure to address America’s growing relationship with our companion animals. (N/A Pet)
  • Discount Department Stores – $98.2B, Down $9.3B (-6.5%). The rise of this segment started the downhill slide of Department Stores but their tenure at the top of GM was relatively brief as the SuperCenters/Clubs offered true 1 stop shopping. Now, they have begun a precipitous slide as consumers shopping for general merchandise items are clearly opting for either the internet or the one stop shopping in the Clubs/SuperCenters. (2.3% Pet)
  • SuperCenter/Club Stores – $450.6B, Up $8.8B, (+2.0%). These outlets with their broad mixture of grocery and general merchandise…at great prices quickly became a dominant force in the retail market. They were second only to Supermarkets in Market Share for many years. However, in 2016 consumers increasingly chose the value and convenience of the internet. Despite a $8.8B increase in revenue they lost 0.2% in market share and fell to third place in the race for the consumers’ $.  (2.4% Pet)
  • $ & Value Stores – $70.6B, Up $1.4B, (+2.1%). – A Great Value and easy to shop – 2 of U.S. Consumers’ major “wants”. This segment has shown steady growth in recent years but it flattened out in 2016. (4.3% Pet)
  • Drug Stores – $272.4B, Up $9.0B, (+3.4%). 60+% of the revenue comes from Rx Drugs. The growth in this segment is driven primarily by a 4.6% increase in Rx Prices over 2015. (CPI – US BLS) (0.3% Pet)
  • Sporting Goods – $46.3B, Flat +$0.0B, (+0.0%). A Minor player in Pet. There was some turmoil in the category with the closing of Sports Authority. Net for the year was “no gain”.(N/A Pet)
  • Home Centers – $271.7B, Up $17.9B, (+7.0%). Considering their size, these “project driven” outlets have never done a significant Pet Business. Two Top 10 U.S. Retailers – Home Depot and Lowe’s are driving the growth. (0.6% Pet)
  • Hardware – $23.3B, Up $0.2B, (+0.9%). Sales were flat most of the year. An uncharacteristic December sales “lift” produced 70% of the total year’s increase. (2.6% Pet)
  • Farm and Garden Stores – $44.4B, Up 0.3B, (+0.7%). This segment has been growing in recent years in both overall sales and in Pet. However, 2016 looks like a repeat of 2015 in that 100+% of the segment’s small sales growth came from Tractor Supply who reported a $0.55B increase in our Top 100 Post. (8.9% Pet)
  • A/O Miscellaneous Stores $77.9B, Up $7.0B, (+9.9%). Florists, Pet Stores, Art Dealers…are typical of the segments bundled into this group. Based upon the 2012 Economic Census, Pet Stores probably account for over 20% of this segment. These stores, whether chain or independent, tend to be small to medium in size. Their strong increase is evidence of another consumer trend – a move to a more personalized shopping experience. (Pet Stores 91%)

The chart below puts the Market Share of each of these segments for 2016, 2015 & 2014 in a visual format so that it is easier to appreciate the relative sizes. Growth in share since 2014 is indicated by a green box, a decline is boxed in red.

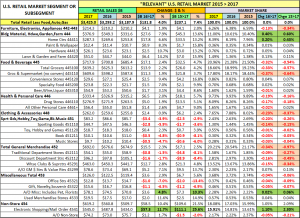
Now we’ll wrap it up with a brief summary and a detailed chart for future reference.

SUMMARY 

Pet Stores remain #1 for Pet Products. However, in the Overall Market, there are 3 Olympic Medalists. In 2016 the gold still belongs to Supermarkets. As you recall, in 2015 we saw the race for the Silver between SuperCenters & Club Stores and the Internet/Mail Order segment really “heat up”. In 2016 that race was all over. Internet/Mail order took over 2nd place in March and continued to pull away. They have now set their sights on the Gold, which has been held for many years by Supermarkets. Amazon, the largest retailer in the segment, has indicated that they will now actively pursue the fresh grocery business. In fact, they recently purchased the Whole Foods Supermarket Chain to facilitate that effort.

Supermarkets (18.2%) currently lead the Internet/Mail order segment (14.9%) by 3.3%. In 2014, the lead was 6.1%. Supermarket sales are increasing, but not fast enough. Unless something radical happens, Internet/Mail Order will become the #1 U.S. Retail Channel no later than 2019 and perhaps by 2018.

Overall, 2016 was similar to 2015 – with a 3.6% increase, up slightly from 3.5%. Once again the Internet/Mail Order Channel provided most of the excitement and 49.4% of the growth. The big increase by the A/O Miscellaneous Channel, which includes Pet Stores and other smaller format retailers, seemed to reinforce a less publicized consumer trend to more personalized shopping. After years of growth, the $/Value Stores segment may have plateaued but the big negative was the increasingly sharp decline in sales by Discount Department Stores – down -$6.9B in 2016 and  -$9.1B since 2014.

The U.S. Retail Market continues to grow and evolve as the consumer migrates to the channels which best fulfill their current wants and needs. This is not a new phenomenon. It has always been that way. Currently, the “Channel of Choice” is Internet/Mail Order and the movement is accelerating. Traditional Brick ‘n Mortar stores will not go away but they must adapt as “electronic” is on track to become the dominant force in U.S. Retail even sooner than we expected.

Finally, the Chart below contains Detailed 2014 > 2016 Sales Performance Data for over 30 U.S. Retail Channels.

Top 100 U.S. Retailers – Sales ↑3.5% 138,572 Stores with Pet Products……plus the Internet!

The U.S. Retail market reached $5.5 Trillion in 2016 from all sources – Auto Dealers, Supercenters, Restaurants, Online retailers, even Pet Stores. This year’s increase of $172B was more than 2015’s $118B as the decline in Gas Station revenue slowed. (Data courtesy of the Census Bureau’s Monthly Retail Trade report)

In this post we will try to narrow the focus to the top 100 Retailers in the U.S. Market – the headliners. These 100 companies account for 38% of the total retail market! How did they perform in 2016 vs 2015…and of course, which ones sell Pet Products? Remember, according to the 2012 Economic Census, over 2/3 of the Pet Products in the U.S. are sold outside of Pet Stores. The Top 100 group accounts for a huge share of these sales. This report is crammed with data, but we’ll try to break it into smaller pieces with regular observations. All of the base data on the Top 100 comes from Kantar Research and was published by the National Retail Federation (NRF).

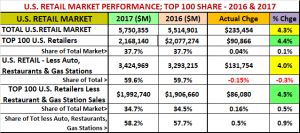
Let’s start with an overview:

Observations

  • The Total Retail Market grew $172.4B in 2016 – Up 3.2%, considerably better than the 2.3% growth in 2015.
    • The Top 100 grew $70.8B (+3.5%), better than the overall market but down from (+4.9%) in 2015.
    • The Top 100 accounts generate $2.1T in revenue, 37.6% of the total U.S. retail market.
  • Let’s pare it down a bit. If you take out Auto, Restaurant and Gas Station sales, the “target” retail market for our industry is $3.3 Trillion. – about 60% of the total market.
    • Removing the Restaurant & Gas Station sales from the Top 100 numbers – at $1.91T, they still account 34.7% of the Total U.S. Market and…
    • 58% of the $3.3 Trillion target retail market.

The Top 100 is obviously critically important, and it’s still outperforming the overall market…barely. We need to remember that the “Top 100 club” is in fact a contest. Every year companies drop out and new ones replace them. This can be the result of mergers, acquisitions or simply slumping sales. Changes of note in 2016:

  • 4 Supermarkets from the 2015 list were “combined” into 2 in 2016 – Kroger acquired Roundys and Ahold bought Delhaize (Food Lion). In these cases, I combined the historical sales to give a better picture of the actual growth.
  • We also lost 2 companies from the list due to declining sales – Barnes & Noble and Chipotle.
  • That left space for 4 new additions:
    • Ulta Salon – a cosmetics and fragrance retailer that is “taking business” from traditional department stores.
    • Petco – We now have 2 Pet Chains in the Top 100 U.S. Retailers!
    • Sprouts – A natural grocery store chain
    • CKE Restaurants ( Carl’s Jr, Hardees)

Now let’s start “drilling down” on the Top 100. Here’s a summary of Regular and Online Retailers versus the bundled total for Restaurants & Gas Stations.

  • Regular & Online Retailers have 58.6% of the stores but account for over 92% of the business.
  • All of the $ growth is coming from Regular & Online Retailers as restaurants are down -3.5% (a big turnaround from 2015 when restaurants led the way with a 6.4% increase)
    • Reg/Online Rtlrs had a +3.7% increase in $ales – $69B (Much lower than last year’s +4.8%; +84.7B)
    • +1.7% growth in stores – also a significant drop from +2.9% in 2015 and + 6.9% in 2014.

Now that we have an overview of the Top 100, let’s take a look at the “targeted” retailer segment. There are 82 total companies. How many are buying and selling Pet Products? This will reinforce how Pets have become an integral part of the American Household and how fierce that the competition for the Pet Parents’ $ has become.

  • Of 82 possible companies, 66 are selling some mixture of Pet Products in stores and/or online.
    • Their Total Retail Sales of all products is $1.8 Trillion which is…
      • 93% of the total business for Regular & Online Retailers in the Top 100
      • 32% of the Entire $5.5T U.S. Retail market – from 66 Companies who sell Pet Products.
    • 54 Cos., doing $1.6T in sales are selling pet products off the retail shelf in 138,000 stores – 3800 more than 2015.
    • Online only is another Story –
      • Amazon accounts for $15.4B (97.7%) of the entire online only increase.
      • Many Traditional Retailers who only sell Pet Products online are closing stores and losing ground in the total Retail “race”. Not carrying Pet Products could be another indication that they are “out of tune” with America

Sales for Retailers with pet products remain strong. Also note that the store count totals are only for the Top 100 and include only 2 Pet Chains and 1 Farm Store Chain, as they were the only companies to make the list. Pet Products are sold in thousands of other retail outlets – 20,000 more grocery stores, 10,000 more pet stores, 16,000 Vet Clinics plus…. A reasonable estimate would be that there are 200,000 outlets selling pet products in the U.S. plus… the internet.

Before we analyze the whole list in greater detail let’s take a quick look at the Top 10 retailers in the U.S.

  • They do $1 Trillion in Sales
    • 51.5% of the Top 100’s Revenue
    • 19.5% of the Total U.S. Retail Market
  • It’s the same list as 2015 although 6 changed rank
  • Target had the only negative performance
  • 8 Retailers produced 29.2% of the increase for Total U.S. Retail

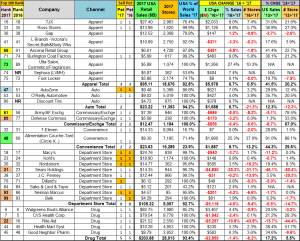
In the next part of the report we will look at the detailed list of the top 100. First, we’ll sort it by retail channel with subtotals in key columns. Then we’ll break it into smaller sections for comments. At the end of the post there will be a download link for an Excel file with the data. This will allow you to sort it as you choose…by rank, alpha, pet/nonpet…it’s your call.

I have not done a lot of highlighting however:

  • Pet Columns ’16 & ‘15 – a “1” with an orange highlight indicates that products are only sold online
  • Rank Columns – Change in rank from 2015: (Remember 4 from 2015’s list were consolidated into 2 in 2016. There were also other acquisitions of companies not in the Top 100 which can cause a big improvement in rank)
    • Up 4-5 spots = Lt Blue; Up 6 or more = Dk Green
    • Down 4-5 Spots = Yellow; Down 6 or more = Dk Pink

Let’s get started. Remember online sales are included in the sales of all companies.

Observations

  • Drug is still strong. However, acquisitions are a big factor. The Walgreens and Rite Aid merger fell apart but CVS acquired Omnicare and the pharmacies in Target Stores.
  • The Traditional Department store segment overall continues its decline. There are a couple of exceptions in some “high end” stores. However for most, the trend is down.
    • Sears (includes Kmart) and Macy’s remain the 2 big “red flags” and more store closings are planned.
    • Although many carry a few pet items, generally online, this channel has never fully embraced Pet Products.
  • Much of the growth in the Convenience Store Chains in the Top 100 in recent years has come through acquisitions. In 2016 there was a reduction in store count so overall sales were basically flat.
  • Military Commissaries have added locations in recent years. Sales are finally catching up with a 9.1% increase.
  • The Auto Parts Stores are a mixed bag, with all chains opening new stores. Only Advance is underperforming in sales. With the continued growth of the Pet Travel product category, it is somewhat surprising that everyone’s offering of Pet items continues to be so small. This could be an opportunity.
  • Among Apparel retailers, the value outlets continue to show strong growth. All three of these chains carry pet products. The big increase at Ascena came solely from the acquisition of Ann Taylor and Loft.

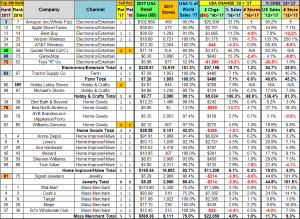
Observations

  • Want proof of the evolving face of U.S. Retail? – Amazon sales are up 91.3% in 3 years!
    • The Phone People – Verizon and Apple, continue to grow. However, not a good year for AT&T.
    • Barnes & Noble dropped off the list in 2016. Best Buy, Toys R Us and Gamestop continue to decline.
  • Signet Jewelry made the list in 2014 by acquiring Zales. After an initial drop in sales, they rebounded – up 10.7%.
  • Mass Merchants’ growth percentage is subpar and is being driven by Wal-Mart and Costco.
    • Wal-Mart is the “big dog” and their 2.7% increase in 2016 is slightly above recent years. Sales in SuperCenters continue to grow but “regular” Discount Department Stores are losing market share. This impacts the overall business in both Wal-Mart and Target.
    • Target sales are down almost $4B. Sales have been flat in the last 2 years, but in 2016 turned down – sharply.
    • Costco continues its spectacular growth. BJ’s revenue fell $2B. They are seeking help to improve online sales.
  • Home Improvement/Hardware is showing continued strong growth by all “players”. The big guys are doing especially well with a $9B combined increase from Home Depot and Lowe’s – both are Top 10 retailers.
  • Home Goods sales were flat except for Ikea, whose spectacular growth came as a result of corporate restructuring.
  • Tractor Supply continued their strong growth (+8.9%). Their average annual growth rate is 9.5% since 2013.

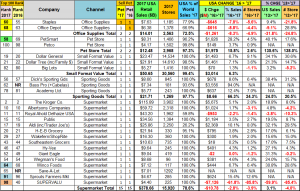
Observations

  • Supermarkets – $389B in Sales; 17 Companies; Over 16,500 stores; All Selling Pet Products. This is a very important group for the Pet Industry. With the highest frequency of consumer visits of any channel, the competition is fierce. The mergers and acquisitions continue as companies try to strengthen themselves for the daily battle. This year we saw 4 of 2015’s Top 100 Retailers become 2 as Kroger acquired Roundy’s and Ahold acquired Delhaize.
    • The % increase is below average. However, all but 2 cos. are showing sales growth. Kroger’s +$2B leads the pack.
    • With only Sprouts joining the Top 100, the number of Supermarket chains dropped to 17, but the store count still increased by 400 over the 2015 group.
  • Small Format Value Stores: Overall, this retail channel does more business than Traditional Department Stores.
    • Dollar General continues as the top performer, up 7.9%, matching their average annual growth rate since 2013.
    • Dollar Tree’s 2015 acquisition of Family Dollar Stores seems to still be producing.
    • Only Big Lots performance is subpar, but they have 2 consecutive years with increases after 2 years of declines.
    • This retail channel continues to grow in numbers and popularity. They are committed to Pet Products and their focus on value appeals to today’s ever more price conscious consumers. Plus, they are easy to shop.
  • Pet Stores – PetSmart’s growth is 3.4%, slightly better than last year’s 3.2%. However, the big news is Petco’s entry into the Top 100. This provides further evidence of the strength of the U.S. Pet Industry.
  • Office Supply Stores – This channel is under siege. As store closings continue, retailers are turning to online ordering.
  • Sporting Goods – Sports Authority closed in 2016 but the 2 remaining retailers, Dick’s and Academy, continue to show strong growth in both store count and sales.

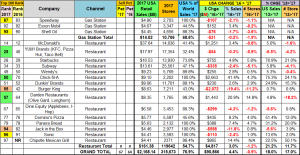
Restaurants & Gas Stations and the Grand Total

Restaurant & Gas Station Observations

Although restaurants & gas stations aren’t relevant in terms of Pet Products Sales, they are relevant in our daily lives.

  • Last year Restaurants had a 6.4% increase, driving the Top 100 $ up. This year’s -3.5% is a big turnaround. However, this is somewhat deceptive. Although sales at Yum are suffering, the big drop is due to a business re-structuring of their franchisees. Without Yum, Top 100 restaurant sales are up 3.4%, basically on par with regular retailers.

Wrapping it up!

The Top 100 got there by producing big numbers so it’s not surprising that their performance exceeds the overall market. Although in 2016, their increase (+3.5%) was only 10% better. In 2015 it was more than double – 4.9% to 2.3%

Pet Products are an important part of the success of the Top 100. Sixty-six companies on the list sell Pet Food and/or Supplies in 138,000 stores and/or online. If we drill down a bit, we get to 54 retailers who stock pet in their stores. This group generated $1.6T in sales. Now, let’s “Do the math”. If we take out the $10B done by PetSmart and Petco and the remaining companies generated only 1.5% of their sales from Pet, we’re looking at $23B in Pet Products sales from only 52 “non-pet store” sources! By the way, the 1.5% estimated share for Pet items is low based on data from the U.S. Economic Census.

Whether you are a manufacturer, a distributor or a competing retailer, monitoring the Top 100 group is important. What happens in this group reflects the evolution of the overall retail market. We see the continuing decline of Department Stores coinciding with the growing popularity of Value outlets. Nothing demonstrates the growing influence of the internet better than Amazon’s continued spectacular growth. The competition in the market is clearly shown in Supermarkets, where 8 Top 100 retailers became 4 in just 2 years through mergers/acquisitions. In business, like in biology, you must adapt to a changing environment or face extinction.

Don’t forget to download the 2016 Top 100 Retailer Excel file to do your own analysis

[button link=”https://pmud8a.a2cdn1.secureserver.net/wp-content/uploads/2017/08/Top100-US-Retlrs-2016-Ranked.xlsx” type=”icon” newwindow=”no”] Download 2016 Top 100 U.S. Retailers List(Excel)[/button]


Price Matters: Petflation Update – Current Trends…Plus a Look Back

Price has always mattered but it has truly come to the forefront in the consumers’ mind since the great recession. In this report we will review the latest “Petflation” trends for all industry segments but we will also take a look back in time 10 years to 2007, before the economic crisis struck. Let’s see what has changed and how we got to where we are today.

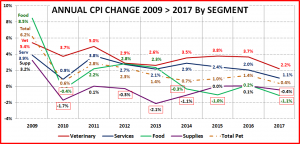
The following chart graphically shows the annual CPI change from 2007 to today – Ytd May of 2017.

  • The first thing that you notice is that since 2009 the Supply Segment has travelled to the beat of a different drummer. Prices are only 0.8% higher now than in 2007. In fact, prices now are almost exactly equal to August 2007.
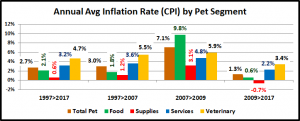
  • The period from 2007 to 2009 was a strong economic time. Prices in all segments just went up, like clockwork. With a 20.5% increase in 2 years, Pet Food was “leading the pack”. There is a story behind this. As a result of the melamine recall of 2007, U.S. consumers became concerned over Pet Food Safety. They moved strongly toward U.S. made Pet Foods, with all U.S. ingredients. These products cost more to produce and drove the overall price of Pet Food up – significantly. Although the 6% increase in 2 years for Supplies may seem tame in comparison, it was triple the segment’s annual rate of increase for the earlier years in the century.
    • The revenue growth in the industry for these years was primarily due to increased prices.
  • Then came the great recession. Most industries felt the impact on prices in 2009, with a drop in the national CPI for the first time since 1955. (The recession was a big deal!) However, prices in the Pet Industry weren’t affected until 2010. Prices fell in both Food and supplies and the increase in Non-Vet Services was slowed. Prices in the Veterinary segment were unaffected. They just kept going up at the same rate.
  • From 2010 to 2013, prices in all segments but supplies increased, but at a slower rate than the “pre-recession” time. Supplies was a completely different story. There are a variety of Supplies categories. Many are considered discretionary spending and have relatively low usage rates. With the consumers’ new shopping priorities – Price is #1, many supplies categories began to be looked upon as commodities and sales became very price sensitive. The initial price drop of 2010 was followed by an even bigger drop in 2013. Obviously, new rules applied to Supplies.
    • With lower inflation rates in this period, more of the industry’s growth was real.
  • From 2013 to 2016, prices in both of the Service segments continued to inflate – the Veterinary segment at 3.5% per year and Services at 2.4%. Revenue in the Service segment was unaffected, but the Veterinary Segment saw all growth coming from price increases. The amount of Vet Services provided in 2015 was actually about equal to 2010 – they just cost more.
  • From 2013 to 2016 – Pet Food prices began to fall. It had become a more competitive environment in this segment. Food sales usually tend to stagnate when prices fall. Consumers don’t buy more food. They just spend less. However, in this case, we were on the edge of a change in food buying behavior. During the second half of 2014, the older Millennials began to try the new classification of foods, dubbed Super Premium. In early 2015 they backed away from this experiment but another group caught the fever – The Boomers. They went for these new, nutritionally concentrated, pet foods in a big way, over a $5.8B increase in spending. However, overall Food prices continued down as the manufacturers of “regular” recipes tried to “buy back” their lost customers.
  • In 2013 and 2014 – Supply Prices dropped sharply. By 2014, this had caught the consumers’ attention and Supply sales moved up strongly. Then prices stabilized and began to move up. Apparently, the price sensitivity in Supplies had become very pronounced. In 2015 Consumers decreased their frequency of purchases by 10% and sales fell about $2B. Prices stabilized in 2016 but still moved up slightly.

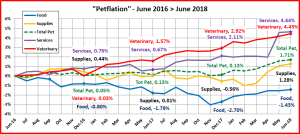
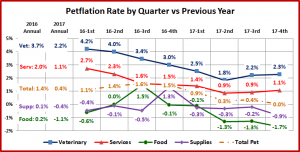
As you can see, in the Post-Recession world, price can make a huge difference in consumer spending behavior. Now let’s take a closer look at the recent history of “Petflation”. The following chart documents the monthly change in CPI by Industry segment over the last 24 months, from May of 2015 through May of 2017.

  • Total Pet – Prices in Total Pet increased 1.71% in 2 years, an annual rate of inflation under 1%, which is low. It was produced by a very reasonable 1.49% increase in the first half followed by a dramatically low increase of only 0.22% in the second 12 months. The 0.22% increase is the lowest 12 month inflation rate for Total Pet since they began keeping records back in 1997. This CPI history also clearly demonstrates that you should always look beneath the surface of any summary numbers. The individual parts can tell a very different story from the total.
  • Veterinary – The first half was “business as usual” or even stronger, with a 3.97% increase in prices. However, there was a distinct change in the second 12 months. Prices only went up 1.8% and included a rare one month price drop of almost 1%. Perhaps, this segment is starting to react to a decrease in frequency of consumer visits.
  • Service – The Service segment has a pattern somewhat similar to Veterinary. Prices were up a “normal” 2.25% in the first 12 months. In the second half prices only increased 0.6% and there were 3 monthly price drops, including a 0.7% drop in May ‘17. It’s possible that this discretionary segment is starting to experience competitive pressure.
  • Pet Products – There is one situation of note that applies to both Food and Supplies. The annual CPI numbers can give the impression of a smooth increase or decrease. In the last few years, the norm for these two segments has been wild short term swings in prices. You can see examples of this for both categories in the first 8 months of the graphs. There have still been ups and downs but since January of 2016 the changes have been less radical.
  • Pet Food – As we said, in 2015 the Boomers moved to upgrade their food to Super Premium. This chart shows how strongly the regular brands reacted – with over a 2% overall drop in prices in just 2 months – July and August 2015. The prices gradually worked their way back up to more normal levels by year end. However, another drop began in late summer of 2016. So far the prices have not recovered. One possibility is that even the high end products are now experiencing competitive pressure. Consider this fact. In 2015 there were 108 exhibitors selling Dog and/or Cat Food at SuperZoo. In 2017, just 2 years later, there were 147 – a 36% increase. If you have a good idea, others will try to get a piece of the action.
  • Pet Supplies – Prices were up for most of 2015 and sales were down over a billion dollars. As we approached the prime holiday season, retailers reacted and prices fell almost 2%. It was not enough. The CPI only showed a slight overall increase for the year but sales fell by $2B. Prices moved back up to at or near previous levels and stayed there until the fall of 2016. They have generally moved down since then. The Supplies CPI actually has been relatively stable for 20 months now. We will have to wait and see how this affects consumer spending in this segment. The USBLS’ spending numbers for 2016 will be available in September.

In the past 24 months we have 2 trends that may have long term significance.

  • The high inflation rate in both Service Segments has slowed in the past 12 months.
  • Although both the CPI for Food and Supplies are trending down slightly, they have become more stable. They still have monthly variations but the pricing swings are less severe.

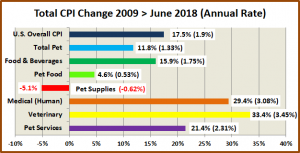
Thus far, we have focused solely on the CPIs for the Pet Industry. Let’s see how they compare over time to the National CPI and other relative industries. The final chart compares the CPI change from 2009, a pivotal year, to May of 2017.

  • The annual inflation rate of Total Pet is only 1.42% – 23% lower than the overall national CPI. However, we know that the story behind the Total Pet number is not quite as rosy as it seems to be.
  • The inflation rate for Pet Food is less than half that of Food & Beverages. There have been big pricing swings in Pet Food and the segment has been in deflation since 2013.
  • The deflation in Supplies is both unusual and concerning because it puts strong profit pressure on manufacturers and retailers.
  • Even with the recent slowing of inflation in the Veterinary segment, prices have increased 13.1% faster than Human Medical care. The consumer impact is magnified because Pet Insurance is not as effective as Human healthcare policies in lowering out of pocket expenses. Plus, the participation percentage is far lower.
  • The inflation rate for the Service Segment has remained relatively constant over this time frame with little to no impact on revenue – so far.

That wraps it up for this Petflation update. We’ll check again when the Spending numbers for 2016 are released.


Pet Products Spending by Generation: Mid-Year 2016 Update

Pet Products spending totaled $43.46B for the 12 month period ending 6/30/16. This was an increase of $0.93B (+2.2%). Total U.S. spending for the period totaled $7.26 Trillion, up $230B (+3.3%). For this 12 month period, Pet Products are not quite keeping up the pace. However, they still account for almost 2/3rds of all Pet Spending and 0.6% of Total U.S. consumer spending – not insignificant numbers.

In this report we will update Pet Products Spending for perhaps today’s most popular demographic measurement – by Generation. Are the Baby Boomers still spending like they used to? What about Gen X? They are next in line. And the Millennials, the hope for the future, are they making progress to eventually lead the way? The numbers come from or are calculated from Data in the US BLS Consumer Expenditure Survey.

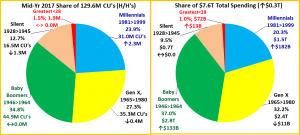
First let’s define each generation and look at their share of U.S. Financially Independent Consumer Units (H/H’s)

Generations Defined                                      

Millennials: Born 1981 and after: In 2016, age 18 to 35

Gen X: Born 1965 to 1980: In 2016, age 36 to 51

Baby Boomers: Born 1946 to 1964: In 2016, age 52 to 70

Silent Generation: Born 1929 to 1945: In 2016, age 71 to 87

Greatest Generation: Born before 1929: In 2016, age 88 and over

  • In terms of Financially Independent Consumer Units, Boomers are still the largest group with 44M (34.4%)
  • The two oldest generations are significantly losing numbers, primarily due to death and movement to assisted living facilities. The Greatest Generation will soon be too small to be a viable, measureable separate spending group.
  • Gen X, while it gets little publicity, is currently the second largest CU group, balanced between the Boomers and Millennials, who both have more total members.
  • Millennials now are the largest generation in sheer numbers, but are developing financial independence more slowly than past generations. Ultimately, they will “grow up”, which will move them into the #1 spot in CU’s. They will also get the biggest lift from immigration. As their marriage rate increases, the CU count will fall slightly.

There is the obvious difference in age to be considered and differences in behavior. However, we have also learned that there are key Consumer Unit characteristics, like income, family situation and home ownership that make a difference in Pet Spending. Let’s look at some of these key differences.

  • It just takes 2. Households with 2 or more people account for 81.5% of all Pet Products Spending
  • The size of the CU and number of children is all about Family responsibility and all the financial pressures that this generates. As you can see, it is beginning to slowly ramp up with the Millennials but is at its peak with the 36 to 51 year old Gen Xers.
    • Married couples with children (especially over 6 yrs old) have always been an important segment in Pet Products spending, especially for Supplies.
    • However, the recent move to upgrade to Super Premium Food by the Boomers has changed the dynamics of this somewhat and brought Food even more strongly to the forefront of Products Spending.
  • Boomers still average 2+ people in the CU. However, they are much less likely to have children <18 at home. As their human children leave home, they turn their attention and spending to their Pet Children who are still with them.
  • Pet Products spending is also tied to the number of earners in a CU. 2 Earner CUs annually spend 38% more on Pet Products than 1 Earner CUs. As you can see the “earning” is being done in America by Gen Xers, Millennials and Boomers with Gen Xers at the top, as to be expected.
  • Homeownership – Owning and controlling your own space has always been a key to increased Pet Ownership and spending. Homeowners currently account for 79.3% of all Pet Products Spending. In fact, the Pet Products Spending by Homeowners with mortgages is up $1.2B through 6/30/16.
    • The Gen Xers have reached the national average and homeownership continues to increase until we reach the oldest Americans – 88+ years old.
    • The Millennials are obviously lagging behind. The first big lift in Homeownership occurs from age 25>34. Right now 39% of these older Millennials own a home. When Gen Xers and Boomers were the same age 48% of them owned homes – over 20% more.

Next we’ll compare the Generations to the National Avg. :

In Income, Spending, Pet Products Spending and Pet Products Share of Total $pending

CU National Avg: Income – $72,990; Total Spending – $56,258; Pet Products Spending – $336.98; Pet Share – 0.60%

  • Income – The 35>51 year old Gen Xers lead the way. The Boomers earn about 15% less and their income will continue to fall as they age. The big drop occurs with the Silents as retirement becomes almost universal. The Millennials income is over 20% less than the Boomers and only about 2/3rds of the Gen Xers.
  • Total Spending – The Gen Xers make the most and spend the most but it’s not out of line with their income. Boomers also spend more than the average but once again their income can support it. Spending doesn’t fall as fast as income with the older generations. In fact, they are actually deficit spending in relation to their after tax The Millennials under 25 are also in an after tax income deficit spending situation. However, the rising income from the 25>35 group makes up the difference and brings overall generational spending in line with income.
  • Avg CU Pet Products Spending – The Gen Xers spend 33% more than the Millennials but still slightly less than the National Average (97%). The Boomers spend 42% more than Gen X and is the only group spending above the National Avg. on Pet Products. However, it hasn’t always been this way. In 2014 Gen X and Boomers spent exactly the same amount annually on Pet Products (within 1 cent) which was 113% of the National Average. The Boomers’ upgrade to Super Premium resulted in a huge increase in the national average and left the Boomers alone at the top.
  • Pet Products Share of Total Spending – One measure of the level of commitment to their Pets.
    • Only Boomers exceed the National Average but The Silent Generation comes in 2nd, demonstrating a lifetime commitment to their Pets. It also should be noted that these older generations have a much stronger commitment to higher quality, higher priced Foods.
    • Gen Xers overall make and spend the most money. They are also second in actual Pet Products Spending. Two things stand out – they are probably not opting for Super Premium Foods and Supplies are much more important to them than to the older generations.
    • Millennials are in third place but their percentage is a definite indication of commitment to their Pets. They are definitely value shopping for Foods but Supplies are extremely important to this group with Spending nearly matching Food.
    • The Greatest Generation at 87+ is still hanging on and you can see that the necessity of Food is of primary importance in their Pet Products Spending behavior.
  • It’s time to look at actual $ Spent by Generation on Total Pet Products as well as Food and Supplies in terms of share of sales as well as the Mid-Year 2016 performance compared to the previous year starting with Total Pet Products…

  • Regarding share, Boomers continue to dominate largely due to their Food upgrade in 2015. Not only do they have the biggest piece of the Pet Products “pie” (47.5%), it is 11% larger than #2, Gen X and #3, Millennials combined.
  • The Greatest Generation is a welcome part of the industry but at 0.4% share they are no longer a factor.
  • In terms of 2016 Mid-Yr Performance, it was all Boomers. They were up $2.02B in Pet Products spending. Every other generation spent less…a total of $1.1B less. Let’s get specific.
  • Boomers – Ave CU spent $464.15 (+$43.56); 2016 Mid-Yr Pet Products spending = $20.63B, Up $2.02B (+10.9%)
    • The increase came entirely from the 1st 6 months. Ave CU spent $327.34 (-$12.09); 2016 Mid-Yr Pet Products Spending = $11.59B, Down $0.26B (-2.2%)ths. – Jul>Dec 15, Up $2.9B; Jan>Jun 16, Down $0.88B.
  • Gen X – Ave CU spent $327.34 (-$12.09); 2016 Mid-Yr Pet Products Spending = $11.59B, Down $0.26B (-2.2%)
    • Almost all of the decrease came in 2016. – Jul>Dec 15, Down $0.02B; Jan>Jun 16, Down $0.24B
  • Millennials – Ave CU spent $247.02 (-$14.41); 2016 Mid-Yr Pet Products Spending = $7.04B, Down $0.34B (-4.6%)
    • Sales bounced back in 2016. – Jul>Dec 15, Down $0.52B; Jan>Jun 16, Up $0.18B.
  • Silent Gen. – Ave CU spent $228.12 (-$27.85); 2016 Mid-Yr Pet Products Spending = $4.02B, Down $0.44B (-9.9%)
    • All of the drop came in 1st 6 months. Jul>Dec 15, Down -$0.48B; Jan>Jun 16, Up $0.04B – a slight increase.
  • Greatest Gen.– Ave CU spent $90.86 (-$5.47); 2016 Mid-Yr Pet Products Spending= $0.17B, Down $0.06B (-26.1%)

The Total Spending increase was all due to Boomers. Now let’s look at individual segments. First, Pet Food..

  • Since their 2015 Upgrade, Boomers continue to spend more on Food/Treats than all other Generations combined.
  • Gen X has 24% more CU’s than the Millennials but spent 78% more on Pet Food.
  • Millennials spent $0.59B less on Food Mid-Yr 2016 versus the previous 12 months.
  • Boomers – Ave CU spent $332.75 (+$59.36); 2016 Mid-Yr Food spending= $14.73B, Up $2.66B (+22.0%)
    • July>Dec 15 (+$3.5B) – Reflects Food Upgrade; Jan>Jun 2016 (-$0.84B) – Looks like they pulled back a bit.
  • Gen X – Ave CU spent $199.66 (+3.65); 2016 Mid-Yr Food spending= $7.03B, Up $0.21B (+3.1%)
    • The lift came entirely in Jul>Dec 15 ( +0.44B); In Jan>Jun 16 they gave half of the Fall increase back (-0.23B)
  • Silent Generation – Ave CU spent $159.46 (-$19.94); 2016 Mid-Yr Food spending $2.8B, Down $0.32B (-10.3%)
    • Spending fell in both halves. Jul>Dec 15 (-0.21B); Jan>Jun 16 (-0.11B)
  • Millennials – Ave CU spent $138.90 (-$21.87); 2016 Mid-Yr Food Spending $3.94B, Down $0.59B (-13.0%)
    • Age 25>34 upgraded Food in late 2014, then pulled back in 2015. Dec 15 (-0.89B); However, they showed some resiliency as they bounced back in Jan>Jun 16 (+$0.3B)
  • Greatest Gen. – Ave CU spent $63.73 (+$4.63); 2016 Mid-Yr Food spending= $0.12B, ↓ $0.02B (-14.3%)(less CUs)

We are still seeing the residual effect of the Boomers 2015 Upgrade. 2016 is not starting off well as there is some pull back on the upgrade and only Millennials are showing plus numbers for the 1st half. Now on to the Supplies Segment.

  • Boomers still have the largest share but unlike Food, the Younger Groups – Gen X and Millennials control 51.6%.
  • Millennials – Ave CU spent $108.12 (+$7.46); 2016 Mid-Yr Supplies spending= $3.11B, Up $0.26B (+9.1%)
    • FINALLY, a bright spot for Supplies. Jul>Dec 15 (+$0.38B); Jan>Jun 16 (-$0.12B) But it faded a bit in 2016.
  • Baby Boomers – Ave CU spent $131.40 (-$15.80); 2016 Mid-Yr Supplies spending= $5.90B, Down $0.64B (-9.8%)
    • In 2016 the Spending decline basically stops. Spending Jul>Dec 15 (-$0.6B); Jan>Jun 16 (-$0.04B)
  • Gen X – Ave CU spent $127.68 (-$15.74); 2016 Mid-Yr Supplies spending= $4.56B, Down $0.47B (-9.3%)
    • The same story as the Boomers. Spending decline turns flat in 2016. Jul>Dec 2015 (-$0.43B); Jan>Jun 16 (-$0.01B)
  • Silent Generation – Ave CU spent $68.66 (-$7.90); 2016 Mid-Yr Supplies spending= $1.22B, Down $0.12B (-9.0%)
    • Spending in the 1st half of 2016 actually increased. (+$0.15B). However, not enough as Jul>Dec 15 was (-$0.27B)
  • Greatest Gen. – Ave CU spent $27.13 (-$10.11); 2016 Mid-Yr Supplies spending= $0.05B, Down $0.04B (-44.4%)

It appears that the steep drop in spending during 2015 could be coming to an end. Sales in the first 6 months of 2016 were down only $0.06B and essentially were flat versus the same period in 2015. Boomers and Gen X, which account for 70.5% of all Supplies Spending, both mirrored this trend. We’ll see what the 2nd half of 2016 brings.

In the final chart we will look at the spending performance of each generation. We will compare their share of spending on Total Products, Pet Food and Pet Supplies to their share of CU’s and see “Who is earning their share?”

Performance = Share of Spending/Share of CU’s;        100+% indicates you are “earning your share”

  • Silent Generation Performance – Pet Products: 66.7%; Pet Food: 71.0%; Pet Supplies: 59.4%
    • This group ranges in age from 71 to 87. Pet ownership is more difficult after age 75 and this is reflected in the low share of Pet Products spending. However, the desire and the commitment is still there. This is evident in the 71% performance on Pet Food. While they don’t “earn their share”, their performance is better than the Millennials.
  • Baby Boomers Performance – Pet Products: 136.5%; Pet Food: 148.0%; Pet Supplies: 114.4%
    • The Boomers led the way in building the industry and they are still doing it. They are earning their share and in fact, the spending leader in both Food and Supplies. Ultimately, this will fade as they age but based upon their history, they will continue to perform for many more years, well into old age.
  • Gen X Performance – Pet Products: 96.4%; Pet Food: 88.8%; Pet Supplies: 110.8%
    • Next in line and next in performance to the Boomers, the Gen Xers are the only other generation to “earn their share” in spending on a Pet Product segment – Supplies. Spending on Supplies is a much higher priority for the younger groups. Gen Xers range in age from 36 to 51. As they reach the 50 to 54 age group, their children will start to move away from home and their focus will turn to their Pet Children. Expect their performance to surpass the 100% level within the next 5 years as they move to take over the #1 spot from the Boomers.
  • Millennials Performance – Pet Products: 72.6%; Pet Food: 61.9%; Pet Supplies: 93.7%
    • The Millennials are widely touted as the future of the industry. This is ultimately true, but the future is still a ways off. The Millennials are currently 18 to 35 years old. They have pets, a lot of them, but their responsibilities are growing and money is still in short supply. They spend a lot on Supplies as they are establishing Pet households and actively seek products that make Pet Parenting easier. However, value shopping is still the rule. They initially bought into the food upgrade in 2014 but pulled back in 2015. They are 20 years away from occupying the highest income group. Also, since they are having children later, the spending lift from children leaving will undoubtedly be delayed. We’ll keep a close eye on them, but realistically, they are 20 years away from being the dominant force in Pet Spending.

U.S. Pet Services Spending (Non-Vet) $6.82B (↑$0.96B): 2016 Mid-Year Update

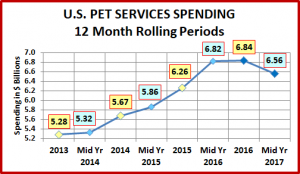
The US BLS just released their Mid-Year Update of the Consumer Expenditure Survey covering the period 7/1/2015 to 6/30/2016. The report shows Non-Vet Pet Services Spending at $6.82B, Up $0.96B (+16.4%) from a year ago. The following charts and observations were prepared from calculations based upon data from that report and earlier ones. The first chart will help put the $6.82B into perspective with recent history.

Specific Comparisons

  • 2013 > 2015: ↑$0.98B (+18.6%)
  • Mid-Yr2014> Mid-Yr2016: ↑$1.5B (+28.2%)
  • 2015 ($6.26B) vs 2014 ($5.67B)
    • ↑$0.59B (+10.4%)
      • 1st Half ↑$0.19B
      • 2nd Half ↑$0.4B
  • Mid-Yr 16 ($6.82B) vs Mid-Yr 15 ($5.86B)
    • ↑$0.96B (+16.4%)
      • Jul>Dec 2015 ↑$0.4B
      • Jan>Jun 2016 ↑$0.56B

Observations

  • Pet Services has shown uninterrupted growth since 2013.
  • The growth has accelerated since the second half of 2015.
  • Although inflation has slowed from the beginning of 2015 through Mid-year 2016, it has still averaged over 2% per year. Thus far, the rising prices have not had an impact on overall Pet Services Spending.

Let’s take a look at the Mid-Year Services Spending by Age Group.

Age Group Observations

  • The bulk of Pet Services Spending (70%) is done by the 45 and over group (61% of all CU’s)
  • All but 2 Age Groups are spending more on Pet Services
  • The 35>44 Age group is down slightly. This is the group of Gen Xers who are under strong financial pressure as they are at the peak of Family responsibilities.
  • The over 75 group is more likely to “need” pet services than have them as a convenience. In this case, it is possible that the rising prices could be impacting this lower income group.

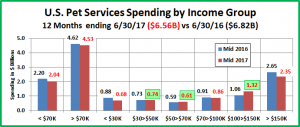
Now let’s look at Pet Spending by Income Group

Income Group Observations

It’s an interesting pattern. The Below Avg income group and the wealthiest group over $150K are driving the increase.

  • Under $70K ↑$0.32B and $70K > $150K ↓$0.32 exactly cancel each other out.
  • CU’s making over $150K, with a $259K avg income, are in effect, generating the entire $0.96B increase.
  • The above average income group, primarily those who are Gen Xers, are at the peak of family pressure and are thinking twice about the largely discretionary spending on Services.

Comments

The $0.96B growth in Services Spending in the 12 month period ending 6/30/16 was the biggest growth in any 12 month period since they began the annual survey in 1984. It beats out the $0.82B increase in 2012 which came after a 2 year spending decline in 2010-11 due to cautious spending as a result of the financial crisis. Also, the inflation rate for Mid-Yr 2016 was 2.5%, which sounds like a lot. However, the annual inflation rate from 2000 to 2009 in this industry segment averaged 4.1% so 2.5% is a 40% drop. It also means that 85% of the recent $0.96B growth was real.

Of the $0.96B increase, $0.4B came in July-Dec 2015 and $0.56B came in the first half of 2016. So what’s in store for the second half of 2016? Inflation continued to slow, finishing up at 2.03% for the year. Except for the 2010 recession aftermath year, that’s the lowest rate since 1999. 2016 seems to be poised to be an exceptional year for services.

The good news also is widespread. Here are some of the biggest Demographic Segment gainers In Services Spending:

  • All Wage & Salary Earners ↑$0.66B
  • White, Not Hispanic ↑$0.96B;
  • College Grads ↑$1.09B
  • Homeowners & Renters are all Up. HomeOwners w/o Mtge ↑$0.51B
  • Suburbs ↑$0.77B…only Rural areas are down.
  • All Married and Unmarried CU’s are Up. Married Couples “only” (No children) lead the way ↑$0.56B
  • All Sizes of CU’s (1 > 5+) are up. 3 person or Less CU’s ↑$0.85

U.S. Pet Supplies Spending $14.84B (↓$1.01B): Mid-Year 2016 Update

2015 was quite a year for Pet Food but not so good for Pets & Supplies. Now it’s time to see what the beginning of 2016 brought to Supplies Spending. In the US BLS Mid-Year Update of their Consumer Expenditure Survey covering the 12 month period ending 6/30/16, Supplies Spending was $14.84B, down $1.01B from a year ago and even slightly less than 2013. The following chart should put the recent history into perspective.

  •  2015 ($14.9B) vs 2014 ($17.0B)
    • $2.1B (-12.4%)
      • 1st Half ↓$1.15B
      • 2nd Half ↓$0.95B
  • Mid-16 ($14.84B) vs Mid-15 ($15.85B)
    • ↓$1.01B (-6.4%)
      • Jul>Dec 2015 ↓$0.95B
      • Jan>Jun 2016 ↓$0.06B – Flat
  • 2015 vs 2013 – Spending Flat:↓$0.06B
  • Mid-16 vs Mid-14 – Spending ↓$1.09B

The Chart clearly shows the Spending ride that Supplies has taken since 2013, climbing to the summit in 2014 then descending into the valley in 2015. Supplies is a diverse and complex segment so there are a number of factors behind these changes in Spending. For this report we will focus on 2 which seem particularly relevant.

The first is pricing – inflation/deflation. Many Supplies Categories are commoditized so spending is impacted by the rise and fall of prices. 2014 was a “deflation” year. Prices were down so the largely discretionary Supplies spending was up, way up. During the Holiday season of 2014, prices turned upward. Spending was not significantly slowed…but the prices stayed up into the new year. This would have a negative impact.

At the same time in 2015, another trend was starting in another segment. A large group of consumers, mostly Baby Boomers was choosing to upgrade their Food to Super Premium. This upgrade was significantly more expensive so this group immediately began looking for ways to save on discretionary spending. Basically, everyone was looking for savings and Supplies prices were going up. The result was a $2B drop in Supplies spending primarily from only a 10% decrease in purchase frequency.  In Nov-Dec 2015, the Consumer Price Index for Pet Supplies dropped by a record 2% – but it wasn’t enough to turn the year around. Prices stayed down for the first half of 2016 and Spending stabilized at the level of the same period in 2015, which is not good, but at least it stopped falling.

Now let’s look at the 2016 Mid-year Supplies Spending versus previous year by Age Group

At the end of 2015, every age group was showing decreased spending on Supplies vs 2014. At the Mid-Year update in 2016 we are starting to see evidence of at least a pause in the decline if not the beginning of a turnaround.

  • The biggest drop in Supplies is still occurring in the age groups which have Baby Boomers who range in age from 52 to 70 at the time of this report. In 2015 the Boomers opted to upgrade to Super Premium Foods and reduced spending in other areas, especially Supplies. We’re still seeing the residual effect of that choice.
  • Supplies have always been an important portion of overall Pet Spending for the younger groups so it’s fitting that the Under 35 group is showing an increase. Perhaps the turnaround will start with the Millennials.
  • Another point to note is the increase, although slight, at both ends of the age spectrum. The individuals in age groups are always changing. This increase indicates that new pet households are being added and that existing pet households are being maintained.

Now let’s look at Supplies Spending by Income Group to see if Money Matters.

Just like the Age Groups, every Income group showed decreased spending in 2015. At the 2016 Mid-Year update, the decline is still pretty pervasive but there are a couple of positives.

  • The $1B decrease is almost equally split between the Over $70K and Under $70K groups.
  • All the Income Levels under $70K are also showing a drop in Supplies Spending.
  • The $100>$150K group is still reflecting the cut back in Supplies Spending which was driven by the Food Upgrade and value shopping. Their income is $120K but this group is at the peak of family responsibilities & children <18.
  • There is a slight increase of $0.12B in the above average income group $70>$100K. There is probably a strong correlation between this group and the lift in the 25>34 age group, especially married couples only.
  • The Over $150K group is also showing an increase of $0.11B. With an average income of $259K, discretionary spending is just that…at their discretion.

Comments

2015 was not a good year for Supplies. It was a year of price inflation. While not strictly tied to the CPI, many of the commoditized Supply Categories are strongly influenced by price. With inflation, Spending fell $2.1B in 2015. Prices had a record drop in November-December. This may have mitigated the decline but it was not enough to turn the second half around. The lower prices continued for the first half of 2016 and Spending stopped falling and flattened out at a level equal to the first half of 2015. What will happen in the second half? We’ll just have to wait and see. The Segment could certainly use a turnaround. Here are some large Demographic segments that are showing an increase in Supplies Spending for the first Half of 2016 and might lead the way.

  • <$100K ↑$0.36B
  • 35>44 yrs ↑$0.19B
  • 3 Person or less CU’s ↑$0.5B
  • College Grads ↑$0.14B
  • White, Not Hispanic ↑$0.14B
  • Northeast & Western Regions ↑$0.3B


U.S. Pet Food Spending $28.6B (↑$1.94B): Mid-Year 2016 Update

The US BLS just released their Mid-Year Update of the Consumer Expenditure Survey covering the period 7/1/2015 to 6/30/2016. The report shows Pet Food Annual Spending at $28.62B (Food & Treats). The following charts and observations were prepared from calculations based upon data from that report and earlier ones. The first chart will help put the $28.6B into perspective with recent history.

  • From 2013 to 2015 the Pet Food Segment grew from $23B to $29.5B – a $6.5B (28.3%) increase in 2 years!
  • Most of the increase occurred from 2014-2015 when spending reached $29.5B – a $5.4B (22.4%) increase
    • First half of 2015 – Up $2.6
    • Second half of 2015 – Up $2.8B
  • Mid-Year 2015 ($26.7B) vs Mid-Year 2014 ($22.9B)Up $3.8B
  • Mid-Year 2016 ($28.6B) vs Mid-Year 2015 ($26.7B)
    • Up $1.9B
    • July>Dec 2015 – Up $2.8B
    • Jan>Jun 2016 – Down $0.9B

2015 was the critical year. It produced the tremendous lift in spending due to the move to upgrade to Super Premium, which was primarily driven by the Baby Boomers. However, 2015 was a unique year in another way too. There was a radical increase in Food Spending and at the same time, the biggest deflation since they began keeping records back in 1997. These don’t usually go together since you don’t buy more food just because it’s cheaper. Perhaps the brands that were losing consumers to the Super Premium Foods were trying to “buy them back”. The result was we had the huge lift due to the upgrade at the same time that everyone else was paying less for their regular food. This appears to have created a value shopping mentality in that the consumer was looking for the best price in other retail outlets and the internet. The deflation continued through the first half of 2016 and so did the pricing scramble.

Let’s see where the $28.6B came from – First by Age Group

  • The 55>64 Age group, which is all Baby Boomers is still driving the mid-year increase – Up $2.95B
  • You also see the influence of the youngest Boomers in the small lift in the 45>54 Age Group.
  • The 65>74 age group is a different story. This group, who originally bought into the Food Upgrade, appears to have backed off a bit.
  • The 25>44 age group was the first to try upgrading Food in the second half of 2014 which started the “lift”. In 2015 they backed away. The drop you are seeing is primarily a result of that.
  • At the extreme edges of the Age Spectrum, it appears that the Under 25 group is adding pets and the over 75 folks are maintaining them.

Now let’s look at Spending by Income Group:

  • Pet Food Spending is almost evenly divided between CU’s earning < $70K and those earning >$70K
  • This upgrade to Super Premium was not strictly about money but more about the benefit to your Pet.
  • The biggest decrease is coming in the mid to upper income groups. This seems unusual but it is still reflective of the roll back from Super Premium in the 25>44 age group that occurred in 2015.
  • You can see that the Under $70K group (Note: Avg U.S. Income is $73K) and the super high incomes are driving the increase. The >$150 is certainly not all Baby Boomers. We may have a new convert to Super Premium.

Comments

Mid-Year 2016 Pet Food Spending totaled $28.62B, an increase of $1.94B (7.3%). That is excellent but I’m sure the question on everyone’s mind is what about the $0.88B decrease in the first 6 months of 2016? What does that mean? Unfortunately, there is no absolute answer. The huge $5.4B lift in Food in 2015 came primarily from the upgrade in Food by Baby Boomers. In fact, their increase was closer to $5.8B so they made up for declines in other groups.

When a large group makes a major change like switching to Super Premium, not everyone will stick with it. You will undoubtedly see some slippage. In the first half of 2016, the 55>64 age group spent slightly less than in 2015 – $0.19B. The Retired group spent a lot less – $0.9B.

There is another factor at work here in the decline in spending in the first half of 2016 which affects everyone…deflation. There was strong deflation in Pet Food Prices for all of 2015 and this continued into the first half of 2016. Even if you are loyal to your Pet Food Brand, why would you pay more than you have to? In today’s world, price comparison is much easier and the internet is now a real option for Food as well as Supplies. Consumers did their homework and paid less.

So what will happen in the second half of 2016? Will there be a net increase in spending for 2016 over 2015? The answer is of course, no one knows.

For 2016 to show an increase over 2015, consumers would have to spend $0.9B more in the second half of 2016  than they did in the second half of 2015, which was the largest second half of all time. Deflation ended in July of 2016 but without a move to Super Premium by a significant demographic segment(s) an overall increase for 2016 seems unlikely. We’ll wait and see. Don’t be overly concerned. In reviewing 30 years of Pet Food Spending history I have noted that there are periodic plateau years where spending slows or even declines slightly, only to bounce back with a renewed vigor. Recent Plateau years occurred in 2013, 2010, 2006, 2003, 2000 and 1997. Pet Food will come back strong, either in the second half of 2016 or in 2017. It always has. Here are some demographic segments that showed strength and increased Pet Food spending in the first half of 2016:

  • $150K – ↑$0.59B
  • Total Wage & Salary Earners – ↑$0.54B
  • 25>34 yr Age Group – ↑$0.41B
  • Hispanics, African Americans & Asians – ↑$0.66B
  • Homeowners with Mortgages ↑$0.63B
  • Center City ↑$0.72B

U.S. Pet Spending: Single Pet Parents – Does Gender Matter?

The subject of this report is Single American Consumer Units (H/H’s) – 1 adult, no children or other adults. Most of our discussions on Pet Spending have focused on the various demographics segments that have 2 or more people, with or without children. There is good reason for this as they spend 80% of all Pet Dollars. However, we shouldn’t overlook the singles segment. Currently they represent 11.6% of the total U.S. population. However they are 29.5% of all Independent Financial Units (CU’s) and account for 20% of Total Pet Spending. With 29.5% of CU’s and “only”20% of Pet Spending they are not as productive as many segments. However the Total Pet Spending in 2015 by U.S. Singles was more than…

  • The total of all Hispanic, African Americans & Asians
  • The entire Millennial Generation.
    • Single Women alone spent more than Millennials
  • The whole Northeast Region of the U.S.
  • Everyone earning between $100K and $150 K
  • And almost equal to all CU’s with incomes over $150K

I think that they deserve a closer look. But before we get started, I want to give credit to the US BLS. All the numbers were taken from or calculated from data in their Annual Consumer Expenditure Survey and a special report on singles spending by gender. To get a valid sample size for single men and women, they combined the data from 2014 and 2015. In order to compare these numbers to overall national data for the same period I calculated the average spending for 2014-2015. Let’s first look how singles are dispersed across society by age group.

  • Two peaks at either end of the age spectrum with the low point at 35>44, which is prime time for marriage & family.
  • Note that single men outnumber women up to age 55 then things change radically. Longevity may be a factor.
  • Actually the percent of single men remains rather stable after age 25 – ranging from 10 to 15%.
  • The 51% number in the small <25 group is a bit deceptive. The bulk of singles are in the older groups. 53% of all singles are over 55 (63% of women). Over 45, the numbers jump to 66% of all singles.(58% of Men; 74% of Women)

Now let’s get to know a little more about their characteristics, starting with homeownership and employment.

  • Homeownership – (82.6% of all U.S. Pet Spending comes from Homeowners)
    • Singles are much less likely to be a homeowner.
    • Women have a higher percentage – over 50%.
    • Homeownership increases with age maxing at 65>
    • Only 3% of singles under 25 own a home.
  • Earning Income – (83.1% of U.S. Pet Spending is done by “earners”)
    • 40% of all singles don’t earn money.
    • Single men are 40% more likely to be an earner.

Speaking of earning, let’s look at income and spending.

We’ll compare Singles to the National Avg in Income, Spending, Pet Spending and Pet Share of Total $pending

In the first chart we saw that Singles were significantly below par in the percentage of homeownership and “earners”. This usually results in decreased Pet Spending. Here’s how they compare on income and spending.

  • Income – The average income of Singles is 50% of the National Average, about $34.5K
    • At $39.4K Men make 30% more than Women at $30K
    • While this seems challenging, consider the fact that all CU’s with an income of less than $70K make up 64.2% of the U.S. total. Their average income is $32.2K, but they still manage to spend 44% of all Pet $ and 49% of Pet Food.
  • Total Spending – Annually, Single Men and Women spend about the same amount of money, which is high considering their income. This situation is especially pronounced among Single Women who make 30% less.
  • Pet Spending – As you can see, Pets are important to Singles. To be more precise, Pets are extremely important to Single Women. They make 56% less than average. Overall they spend 41% less than average. However, when it comes to their Pets, their spending is basically on par with the total Nation. Amazing! Single Men spend less than 40% of what Single Women spend on their pets. This disparity is so great that it undoubtedly indicates that far fewer Single Men actually have a pet.
  • Pet Spending as a Share of Total Spending – 1% has become the benchmark for performance. Pet Spending first reached 1% of Total Spending in 2008. Since then it has remained at or near this level. In 2014-15, the time covered by the data in this report, Pet Spending was 0.95% of Total Spending.
    • Total Singles – At 1.07% they are in the elite “Top 25” of the 85 demographic segments that I monitor, but as usual the story gets more complex when you drill deeper.
    • Single Women – At 1.5% they are in line for the Silver medal. Only truly Rural CU’s with a population less than 2500 and located outside of a Metropolitan Area beat them – with 1.65%.
    • Single Men – At 0.6% this is the flip side. Only 5 Segments are lower, including – Hispanics, African Americans, Asians, the members of the Greatest Generation (Born before 1929) and CU’s where the oldest child is under 6.

Now we’ll “Show you the Money” as we compare Avg CU Pet Spending to Single CU’s for every age group.

Observations

Total Singles – Overall, the pattern of CU spending generally mirrors that of the National trend. Spending starts to grow in the 25>34 age group, builds to a peak at 55>64 then falls off after 65. One thing to note is the huge spending increase for Singles between age groups 25>34 and 35>44 – 50%. The National increase is only 18%. Singles acquire pets a little later than the general population.

Single Men – This pattern is markedly different. Spending triples when they reach the 25>34 age group as they are acquiring pets. However, their spending peak comes early at age 35>44. From 45>64 their spending falls off a little bit, but it is basically static. When they reach 65, spending drops 25%. The stability in the spending from 35>65 indicates that there are few new pet households but those who have pets are committed to their pets. Also, the spending drop at age 65 is less precipitous for Single Men than the overall national numbers.

Single Women – Spending takes off in the in the 25>34 age group and essentially matches the national average by age 35>44. However, it continues to accelerate after age 45 and peaks at 55>64 at a rate that is 20% above the national average. Remember, their income is still under $40K and less than half of the national average. The 50% drop after age 65 suggests that there is a significant decrease in Pet households.

Final Thoughts

Single Pet Parents are a significant segment in the Pet Industry both in size and in spending. Here are the totals:

  • 2015 Total Pet Spending for Singles was $13.45B – a 6.7% increase, despite a 1.1% drop in the number of CU’s
    • This was better than the overall industry increase of 5.3% which included a 1.1% increase in CU’s.
  • Based upon the US BLS special report on singles,
    • Single Women accounted for $9.95B (74% the total)
    • Single Men Accounted for $3.50B (26% of the total)

That’s an incredible difference, considering that these groups are close to the same size – Women – 52% of CU’s; Men – 48%. We have found that gender definitely does matter in terms of Pet Spending by Single consumers.

Let’s consider the experience of Pet Parenting for Singles. It’s an enormous responsibility for anyone. However, if you are single, then all the responsibilities, big and small, “belong” to you, unless you choose to hire someone to help. By the way, that does happen. $1.64B (26%) of all 2015 Pet Services Spending was by Singles.

Singles are very interested in any product or service that makes going “solo” as a Pet Parent significantly better or easier. With relatively low income, price will always matter. However, they will spend more for a product that is significantly functionally better.

In terms of reaching this group, there appear to be 3 major opportunities/challenges:

  1. Opportunity – Overall, the spending commitment to their Pet Children by Single Women is high but it actually increases significantly as they age. Remember, 1.5% of their Total Spending is on their Pets. However, the 45>54 age group spent 1.9% and the 55>64 group spent 2.4%. That last number is truly amazing and it’s not just %. The money is there – $3.4B – about the same as the spending for all single men. Make sure that older single Women have everything they need or want for their pets. Be especially cognizant about the Pet Parenting difficulties that arise as singles move into old age.
  2. Challenge – The main issue with single Men as Pet Parents seems to be getting them to participate. Pets seem to be a more natural addition to the household for women than men. Getting single men started when they are young and as they reach middle age is the challenge. Through HABRI, we have an amazing amount of scientific evidence documenting the benefits of Pets. This is further magnified by the companionship that pets provide for singles. We need to put on our marketing thinking caps and find ways to get the message across to this group.
  3. Income – With lower income, money will always be an issue for singles. There is also a high percentage of older adults in the group, both men and women, so some sort of Senior Discount makes sense. We need to keep singles spending and encourage transaction building. Overall, Singles didn’t participate to any great extent in the 2015 movement to upgrade to super premium food. Price was undoubtedly a major factor in that decision.

That wraps it up for this report. The Single Pet Parents demographic group definitely deserved a closer look and we certainly answered the question regarding Pet Spending and gender. Currently, it does matter and if it’s a contest, women win in a runaway.