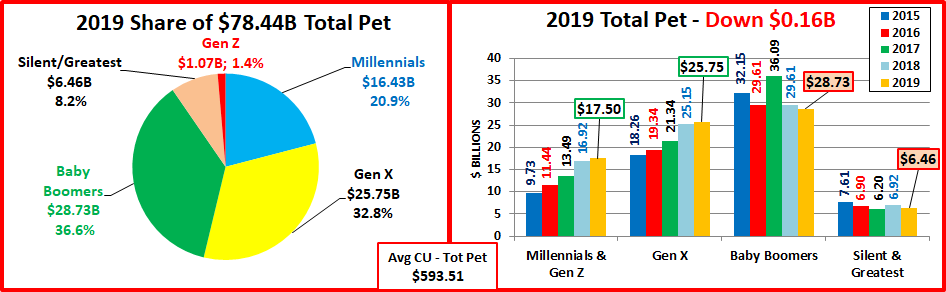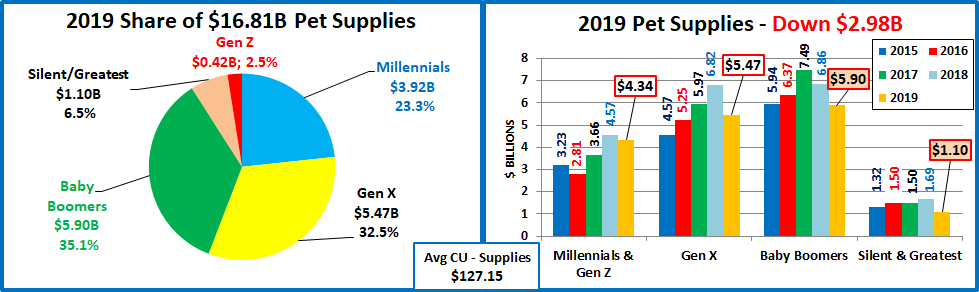
2019 Pet Supplies Spending was $16.81B – Where did it come from…?
Next, we’ll turn our attention to Pets and Supplies. We’ll see some differences from Pet Food as the spending in the Supplies segment is more discretionary in nature. There are other factors too. Spending can be affected by the spending behavior in other segments, especially Food. Consumers often trade $ between segments. However, the biggest factor is price. Many supplies categories have become commoditized so pricing changes (CPI) can strongly impact Consumers’ buying behavior in this segment. In the 2nd half of 2016, deflation began, and Supplies started a 24 month spending lift, totaling $4.97B. Then prices turned up in mid-2018 due to impending new tariffs. Spending fell -$0.01B in the 2nd half but the tariffs really hit home in 2019. 93 of 96 demographic segments spent less and Supplies $ fell a record -$2.98B.
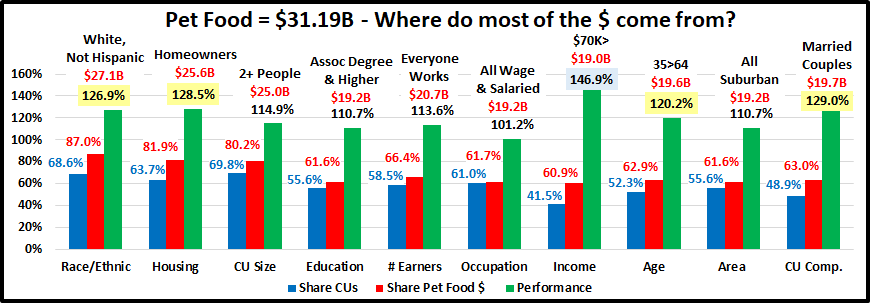
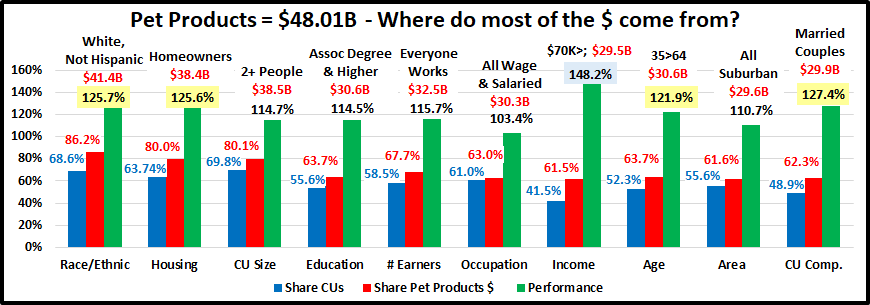
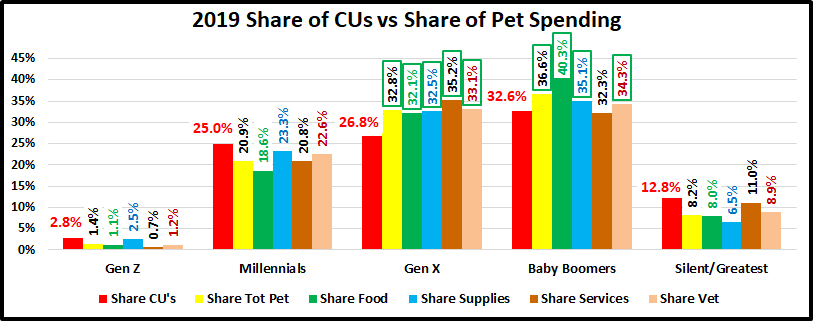
Let’s see which groups were most responsible for the bulk of Pet Supplies spending in 2019 and the $2.98B drop. The first chart details the biggest pet supplies spenders for each of 10 demographic categories. It shows their share of CU’s, share of Supplies spending and their spending performance (Share of spending/share of CU’s). Although their share of the Pet Supplies $ may be different, all of the big spending groups are the same as Total Pet and Food. The categories are presented in the order that reflects their share of Total Pet Spending. This highlights the differences in importance. All 10 of the groups have over a 60% market share. The big difference is we have 7 groups with performance over 120%. Pet Food had only 5. Education and # Earners were added. Both of these categories correlate with higher income which is more important in Supplies spending. 2 more 120+% performers also indicates that Supplies spending is less balanced.
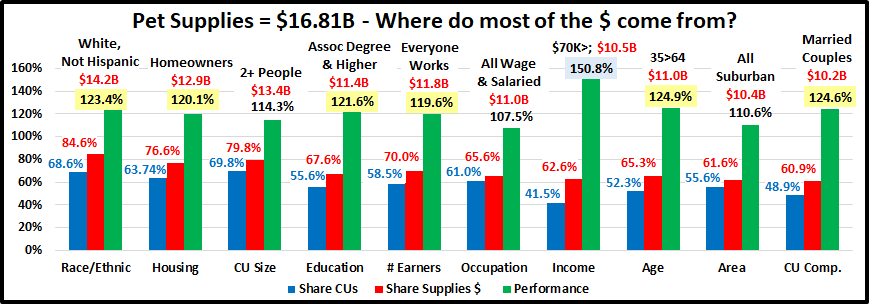
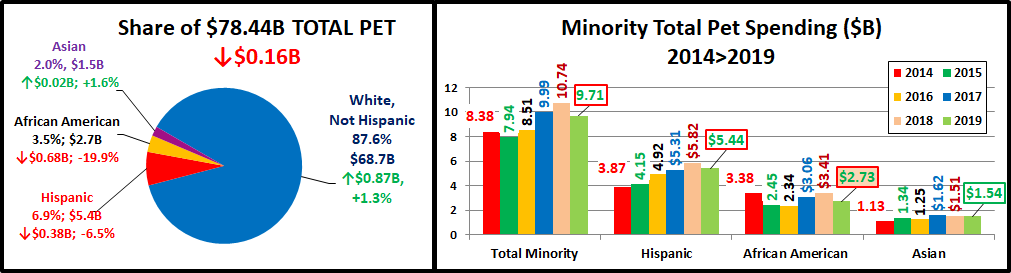
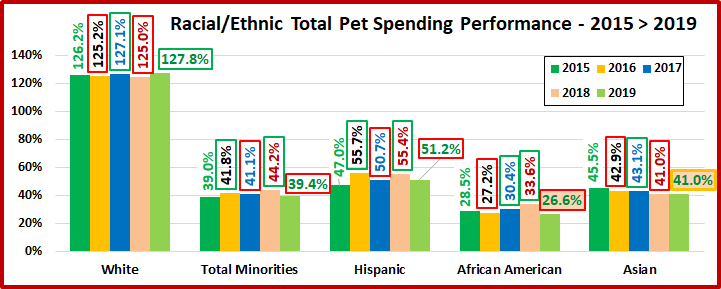
- Race/Ethnic – White, not Hispanic (84.6%) down from (86.3%) This large group accounts for the vast majority of spending in every segment. Their share fell and their performance rating was down from 125.0% to 123.4% but they remain #4, in terms of importance in Supplies Spending. Minority groups account for 31.4% of all CUs but spend only 15.4% of Supplies $. This is actually up from 13.7%. Minorities also spent less but their drop was less severe because lower income Hispanics and African Americans are more focused on essential supplies, not more discretionary items.
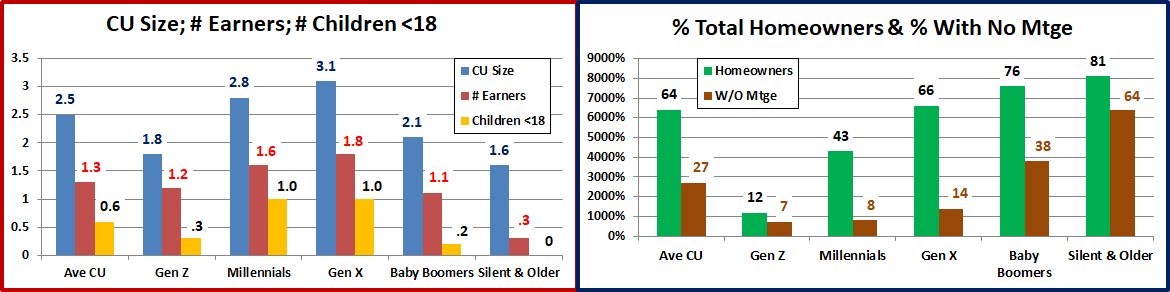
- Housing – Homeowners (76.6%) down from (79.9%) Homeownership is a major factor in pet ownership and spending in all industry segments. Their performance dropped to 120.1%, from 125.9%, and they fell from 3rd to 6th place in terms of importance for increased Pet Supplies spending. Both Homeowners and Renters spent less. However, the bulk of the spending drop – $2.50B (84%) came from Homeowners with a mortgage.
- # in CU – 2+ people (79.8%) down from (82.7%) Their Supplies performance was 114.3%, down from 117.3%. All CU sizes spent less but 1 person CU’s had the smallest decrease, -0.8%. Also, in 2018 all 2+ CUs performed above 100%. In 2019, it was only 2 & 3 person CUs. In fact, 5+ Person CUs replaced singles at the bottom. Basically, 2+ CUs lost share and performance because 1 Person CUs had a less bad year.
- Education – Associates Degree or Higher (67.6%) down from (68.2%) Higher Education lost market share and their performance level dropped from 125.0 to 121.6%. They also fell from 4th to 5th in importance for generating greater Supplies spending. All groups spent less, but 71% of the decrease came from the Associates> Group. They have higher income and purchase more truly discretionary supplies. This was the spending most impacted by prices.
- # Earners – “Everyone Works” (70.0%) up from (65.4%) Their performance grew from 113.2% to 119.6% and they entered the 120+% club at #7. In this group, all adults in the CU are employed. Income and now # Earners is very important in Supplies $. They gained in share and performance because of $1.78 drop by 2+ CUs with 1 or no earner.
- Occupation – All Wage & Salary Earners (65.6%) up from (65.2%) – The performance of this group was 107.5%, up from 106.8%. All wage/salary groups spent less on Supplies. They gained in share and performance because the Self-Employed and Retirees had even bigger decreases in Supplies $, -20%.
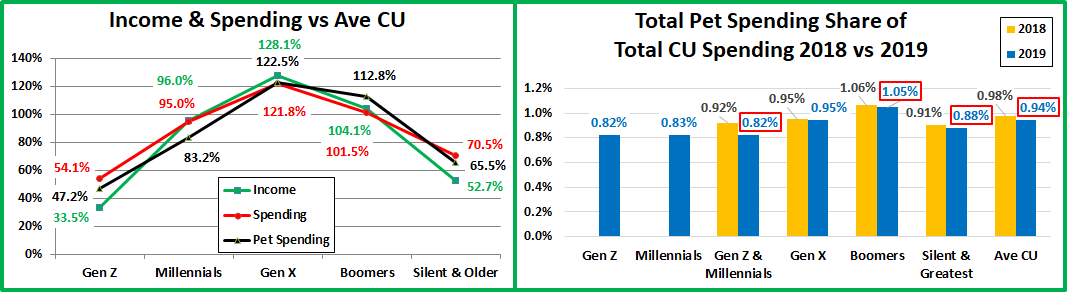
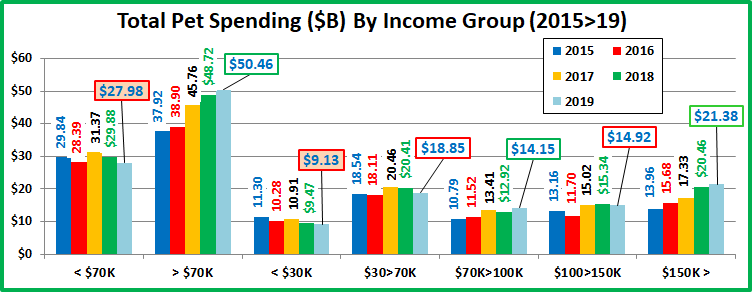
- Income Over $70K (62.6%) up from (60.1%) With a performance rating of 150.8%, up from 148.9%, CU income is the single most important factor in increased Pet Supplies Spending. The $30>39K group actually spent more but the $70K> made gains again because they had a smaller decrease than <$70K. The increased discretionary nature of much of Supplies purchases pushes the performance above Food, but it is significantly below the Services segments.
- Age – 35>64 (65.3%) up from (65.2%) Traditionally, Supplies Spending skews more towards the younger groups. The 35>64 group maintained their dominance and their performance level increased to 124.9% from 123.2% moving them up to 2nd in importance. Supplies Spending was down in all segments but <25. However, they have a very small share. The 35>64 performance grew because the big spending 55>64 yr olds had only a small decrease.
- Area – Suburban (61.6%) down from (63.3%) Suburban CUs are the biggest spenders in every segment. They lost a little ground in Supplies and their performance fell to 110.6%, from 114.4% in 2018. All areas spent less but the Suburbs fell in share and performance because Central City spending was only down -3.9%.
- CU Composition – Married Couples (60.9%) down from (64.8%) Their performance also dropped from 130.5% to 124.6% and they fell from 2nd to 3rd in importance. Married Couple w/other adults, but no kids actually spent more on Supplies. However, Married Couples $ were down -20%. They loss ground because Singles only spent -0.8% less.
The biggest spending groups for Pet Supplies are the same as Total Pet and Food. However, the discretionary nature of Supplies causes spending to be more impacted by income than Food. Groups associated with higher income, like Education and # Earners, perform better than in Food. Homeowners, Married and Whites, the biggest spenders, had the biggest drops in Supplies $. Also, 7 groups with 120+% performance indicates greater disparity between segments.
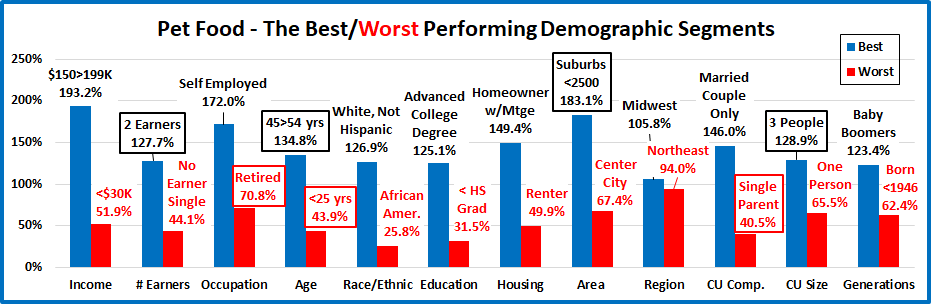
Now, we’ll look at 2019’s best and worst performing Pet Supplies spending segments in each category.
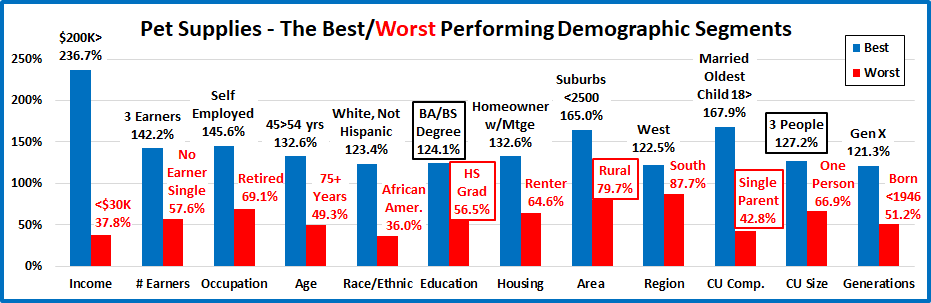
Almost all of the best and worst performers are those that we would expect. In Pet Supplies spending, there are 5 that are different from 2018. That is the same as Total Pet but 2 fewer than Pet Food. It is actually the lowest number for any Industry segment. As we move deeper into the data, we will start to see even more differences between the Industry Segments. Changes from 2018 are “boxed”. We should note:
- Income matters in Supplies spending.
- The 236.7% Performance by the $200K> group is 22.5% better than the best income segment in Food.
- All of the 12 winners for best performance were either 1st or 2nd in income of any segment in the category.
- Education – Although the winner and loser were different from 2018, the performance dividing line in Supplies Spending remains the same. Only those with a formal degree, Associates>, earn their share with 100+%.
- CU Composition – Single Parents Supplies spending fell -44.3%, the biggest drop of any segment in any category.
- Area – The second biggest Supplies Spending percentage decrease was Rural, -35.2%.
- # in CU –In 2019 the performance of 2 to 4 people CUs was again very close. 3 edged out 2 for the win. However, even 5+ earned their share at 103.0%. That truly leaves Singles “standing alone”. In Supplies $, it still just takes 2.
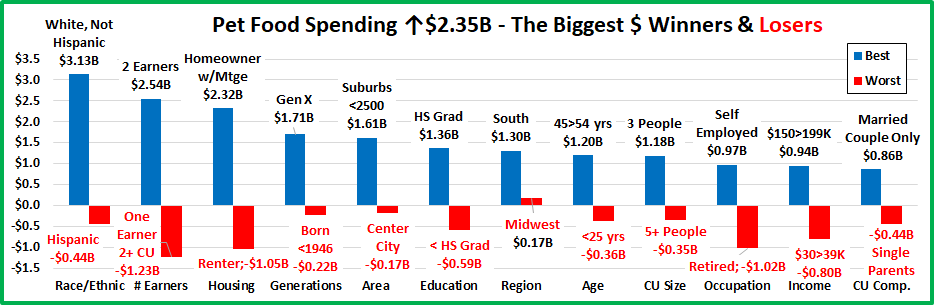
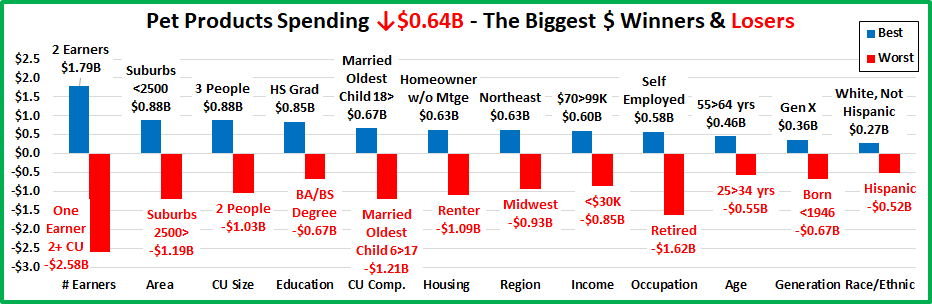
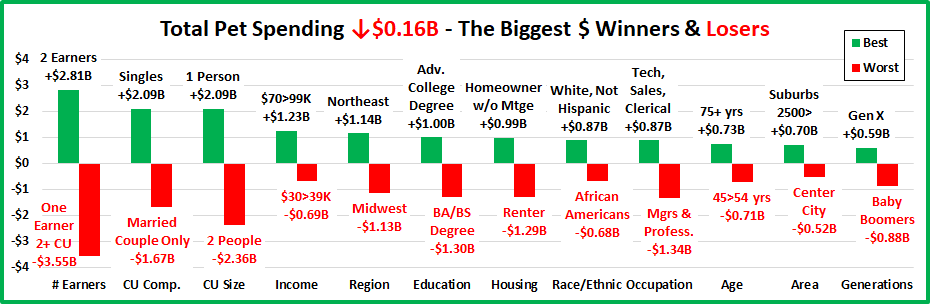
It’s time to “Show you the money”. Here are segments with the biggest $ changes in Pet Supplies Spending.
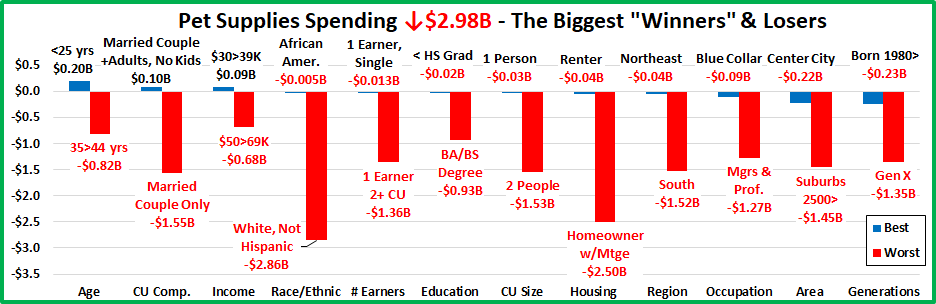 In 2019 Supplies Spending was down $2.98B. The decline began in the second half of 2018 as spending turned down slightly. Then the full impact of the tariffs hit home and the $ plummeted. In the chart, there are 2 repeats from 2018 – 1 winner and 1 loser. 9 segments switched from last to first or vice versa. This is much greater turmoil than in the Food Segment. Almost all winners were a surprise. However, the biggest surprise or change from recent history was that in 2019, every segment in 9 of 12 Demographic Categories decreased spending on Supplies. In 2018, in 3 categories every segment increased spending and in 2017 this was true for 10 categories. This provides perhaps the biggest indication of the massive impact of tarifflation on the Supplies Segment. Here are the specifics:
- Age – Only the <25 group spent more.
- Winner – <25 yrs – Pet Supplies Spending: $0.87B; Up $0.20B (+29.5%) 2018: 35>44 yrs
- Loser – 35>44 yrs – Pet Supplies Spending: $3.24B; Down -$0.82B (-20.1%) 2018: 65>74 yrs
- Comment: The 35>44 yr olds flipped from first to last. 74% of the $2.98B drop came from 25>54 yr olds.
- CU Composition – Married Couples Only flipped from 1st to last.
- Winner – Married, + Adults, No Kids – Supplies: $0.79B; Up $0.10B (+14.4%) 2018: Married, Couple Only
- Loser – Married, Couple Only – Supplies: $4.50B; Down -$1.55B (-25.6%) 2018: Single Parents
- Comment – Only Married Couples with additional adults but no kids spent more. Unmarried CUs of all sizes with no children had the smallest decrease, -$0.11B (-1.8%).
- Income – Both winner and loser are new.
- Winner – $30>39K – Pet Supplies Spending: $1.32B; Up +$0.09B (+7.1%) 2018: $200K >
- Loser – $50 > 69K – Pet Supplies Spending: $1.93B; Down -$0.68B (-26.2%) 2018: $70>99K
- Comment – The $30>39K is the third and last segment in any category to spend more. There was no clear spending trend dividing line. The $70>99K had the second best performance, down only -$0.02B, while the $100>149K group was almost the big loser at -$0.67B.
- Race/Ethnic – White, Not Hispanic flipped from first to last but the winner was new.
- Winner – African Americans – Supplies: $0.79B; Down -$0.005B (-0.6%) 2018: White, Not Hispanic
- Loser – White, Not Hispanic – Supplies: $14.23B; Down $2.86B (-16.7%) 2018: Asian Americans
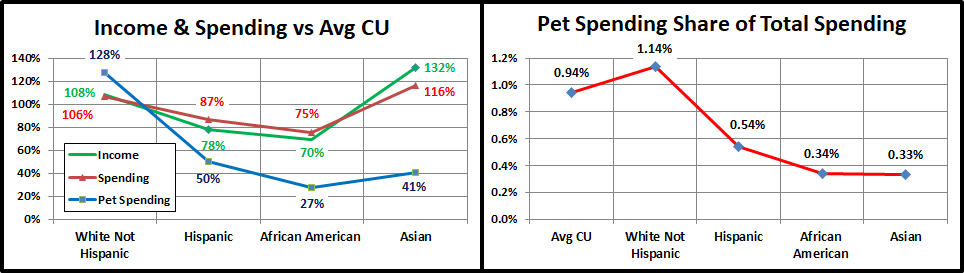
- Comment – White, Not Hispanics drive this discretionary segment. They have the highest % of pet ownership and the second highest income. The interaction of these two factors is very clear in the Racial/Ethnic category. Asians have the highest income but lowest Pet ownership – $ down -11.0%. Hispanics are 3rd in income but second in pet ownership – $ down -5.0%. African Americans have low pet ownership and lowest income – $ down -0.6%.
- # Earners – All segments spent less but 1 Earner, 2+ CUs stayed on the bottom.
- Winner – 1 Earner, Single – Pet Supplies Spending: $2.11B; Down -$0.013B (-1.1%) 2018: 2 Earners
- Loser – 1 Earner, 2+ CU – Pet Supplies Spending: $2.77B; Down -$1.36B (-32.9%) 2018: 1 Earner, 2+ CU
- Comment – Income is a big factor and the # of Earners is becoming more important, at least for the 69.8% of CUs with 2+ people. Singles only spent $0.01B less, regardless if they worked or not. However, in 2+ people CUs, those with 1 or No Earner spent -32.0% less. Those with 2 or more Earners spent -10.9% less.
- Education – Winner and loser flipped but all segments spent less.
- Winner – < High School Grads – Pet Supplies Spending: $1.80B; Down -$0.02B (-3.5%) 2018: BA/BS Degree
- Loser – BA/BS Degree – Pet Supplies Spending: $5.34B; Down $0.93B (-14.9%) 2018: < HS Grads
- Comment – Once again, those that spent the least in 2018 won because they had the smallest decrease.
- # in CU – Just like in CU Composition, 1 person CUs had the smallest decrease.
- Winner – 1 Person – Pet Supplies Spending: $3.39B; Down -$0.03B (-0.8%) 2018: 4 People
- Loser – 2 People – Pet Supplies Spending: $6.40B; Down -$1.53B (-19.3%) 2018: 5+ People
- Comment: The 2 person CUs were particularly hard hit as their spending decrease was bigger than the combined drop of all 3 or more person CUs.
- Housing – Another flip by the 2018 winner and loser.
- Winner – Renter – Supplies: $3.94B; Down -$0.04B (-1.0%) 2018: Homeowner w/Mtge
- Loser – Homeowner w/Mtge – Supplies: $8.30B; Down -$2.50B (-23.2%) 2018: Renter
- Comment – Renters have a significantly lower level of pet ownership, so they “won” because they had less to lose. We should also note that the spending for Homeowner w/o a mortgage only fell -8.8%.
- Region – The Northeast flipped from last to first.
- Winner – Northeast – Pet Supplies Spending: $3.31B; Down -$0.04B (-1.2%) 2018: Midwest
- Loser – South – Pet Supplies Spending: $5.68B; Down -$1.52B (-21.1%) 2018: Northeast
- Comment – Last year the South finished a close second to the Midwest for the biggest increase. In 2019 they were the clear “loser” in $ but they were down -21.1% while the Midwest fell -25.8%.
- Occupation – Both winner and loser are new.
- Winner – Blue Collar – Pet Supplies Spending: $3.15B; Down -$0.09B (-2.8%) 2018: Tech/Sls/Clerical
- Loser – Managers & Professionals – Pet Supplies Spending: $5.14B; Down -$1.27B (-19.8%) 2018: Retired
- Comment – All Occupation groups spent less on Supplies in 2019. In 2018 all but Retirees spent more so they are the only segment with 2 consecutive decreases in Supplies spending. Blue Collar workers are the only group with a single digit % decrease. The 2 biggest spenders, Managers & Self-Employed, cut back spending by 20%.
- Area Type – The big Suburbs flipped from 1st to last.
- Winner – Center City – Pet Supplies Spending: $5.39B; Down -$0.22B (-3.9%) 2018: Suburbs 2500>
- Loser – Suburbs 2500> – Pet Supplies Spending: $7.44B; Down -$1.45B (-16.3%) 2018: Suburbs <2500
- Comment – Central Cities, the area with the lowest pet ownership, had the smallest decrease.
- Generation – Those born in 1981 or after, Millennials/Gen Z, held their spot at the top
- Winner – Born 1980> – Supplies: $4.34B; Down -$0.23B (-5.0%) 2018: Millennials
- Loser – Gen X – Supplies: $5.47B; Down $1.35B (-19.8%) 2018: Baby Boomers
- Comment – This win by Millennial/Gen Z was driven by the <25 group, which had the only spending increase in the age category. Gen X, which had the highest CU Supplies spending in 2018, cut back the most in 2019.
We’ve now seen the winners and losers in terms of increase/decrease in Pet Supplies Spending $ for 12 Demographic Categories. In 2019, spending fell a record -$2.98B due to tarifflation. Only 3 of 96 segments had increases and 9 of 12 categories had no segments that spent more on Supplies. In performance, we saw many expected winners, but it was a different story in $ change. Most of the 2019 winners were those that had the least to lose from 2018. However, like previous years, not every good performer can be “the” winner and some of these “hidden” segments should be recognized for their performance, which was “bad”, but better than most. They don’t win an award, but they deserve…
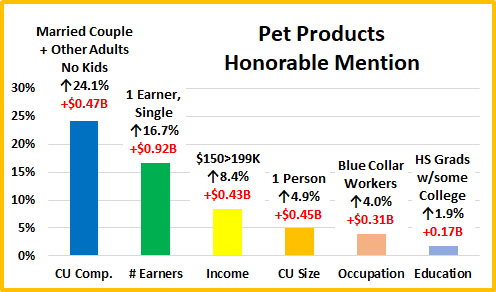
HONORABLE MENTION
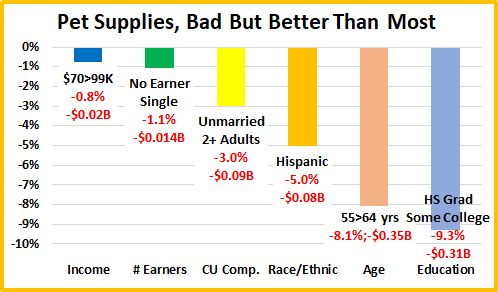
The numbers from these segments are not good but merit some recognition in such a devastatingly bad year. Like many of the winners, most are unusual and a very eclectic mix. The $70>99K middle income group was only down 0.8% so their decrease was truly minimal. No Earner, Singles was literally only $1M away from winning the # of Earners category. The best performances generally came from “no kids” CUs like those consisting of 2+ Unmarried Adults. The lower income Hispanics finished 2nd with only a 5% decrease because their focus was primarily on more essential supplies. The 55>64 yr old Baby Boomers have the largest share of Supplies $ of any age group and their % decrease was about half of the national number. HS Grads with some College were the only other group besides those with no HS Diploma to have a % decrease less than double digits. 2018 was not a great year but it was still pretty good as 72 of 92 Demographic Segments spent more. In a marked contrast, 2019 was nearly universally bad as 93 of 96 demographic segments spent less on Supplies.
Summary
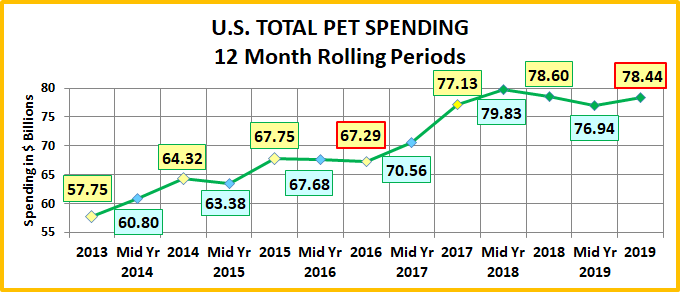
While Pet Food spending has shown a definite pattern, Pet Supplies have been on a roller coaster ride since 2009. Many Supplies categories have become commoditized and react strongly to changes in the CPI. Prices go up and spending goes down…and vice versa. Supplies spending has also been reactive to big spending changes in Food. Consumers spend more to upgrade their Food, so they spend less on Supplies – trading dollars. We saw this in 2015. In 2016 the situation reversed. Consumers value shopped for Food and spent some of the “saved” money on Supplies.
That brought us to 2017. Both Supplies and Food prices deflated while the inflation rate in both of the Services segments dropped to lows not seen in recent years. Value was the “word” and it was available across the market. Perhaps the biggest impact was that the upgrade to super premium Food significantly penetrated the market. This could have negatively impacted Supplies Spending, but it didn’t. Supplies’ spending increased in 93% of all demographic segments.
2018 started out as expected with a $1B increase in Supplies and a small lift in Food. Then the government got involved. In July the FDA issued a warning on grain free dog food and spending dropped over $2B. New tariffs were implemented on Supplies and spending flattened out then turned down $0.01B in the 2nd half. Because of shipping timing, the full retail impact of Tariffs was delayed until 2019 when spending fell -$2.98B, affecting 97% of all demographic segments.
Among the demographic categories in which a consumer has some control, Higher Income, Marriage, Homeownership and Higher Education are still the biggest factors in Supplies spending. In 2019 Income stayed on top and two categories directly associated with income – Occupation and # of Earners increased in importance.
Increased Tariffs increased prices which obviously severely impacted Supplies Spending. Those that spent the most in 2018 were often the most negatively affected in 2019. A prime example of this is that 6 of the 12 segments with the biggest increase in 2018 flipped to having the biggest decrease in 2019. In terms of performance, 10 of the 12 best performing segments repeated in 2019. There has always been a big gap in performance between the best and worst performers in Supplies. It’s still there as It narrowed only 0.6% from 2018 to 2019.
It appears the 2019 decrease most affected the groups that spent the most money on the more discretionary supplies categories. It will be interesting to see the impact of the COVID-19 pandemic on Supplies $pending Demographics.
Finally – The “Ultimate” Pet Supplies Spending CU consists of 3 people – a married couple, with 1 child, over 18. They are 45>54 yrs old. They are White, but not of Hispanic origin. At least one has a BA/BS Degree. Both of them work, running their own business and their child just started a part time, after school job. They’re doing well with an income over $200K. They live in a small suburb, adjacent to a big city in the Western U.S. and are still paying off the mortgage.