2022 Pet Products Spending was $60.63B – Where did it come from…?
We looked at the Total Pet Spending for 2022 and its key demographic sources. Now we’ll start drilling down into the data. Ultimately, we will look at each individual segment but the first stop in our journey of discovery will be Pet Products – Pet Food and Supplies. Food and Supplies are the industry segments that are most familiar to consumers as they are stocked in over 200,000 U.S. retail outlets, plus the internet. Every week over 20,000,000 U.S. households buy food and/or treats for their pet children. Pet Products accounted for $60.63B (59.0%) of the $102.71B in Total Pet $ in 2022. This was up $2.42B (+4.2%) from the $58.21B that was spent in 2021. Pet Food spending rebounded after the big drop in 2021 following the binge buy in 2020. Supplies had its own spending rollercoaster. After falling during the 2020 pandemic, there was a record surge in 2021. This couldn’t be repeated so spending fell in 2022.
Overall, in 2022 Pet Food spending rose +$4.29B, while Supplies spending fell a -$1.86B. We’ll combine the data and see where the bulk of Pet Products spending comes from.
We will follow the same methodology that we used in our Total Pet analysis. First, we will look at Pet Products Spending in terms of the same 10 demographic category groups that were responsible for 60+% of Total Pet spending. Then we will look for the best and worst performing segments in each category and finally, the segments that generated the biggest dollar gains or losses in 2022.
The first chart details the biggest pet product spenders for each demographic category. It shows their share of CU’s, share of pet products spending and their spending performance (spending share/share of CU’s). Although their share of the Pet Products $ may be different from their share of the Total Pet $, the biggest spending groups are the same. The categories are shown in the order that reflects their share of Total Pet Spending. This highlights the differences. In Pet Products spending share, larger CUs and age are more important while income matters less. However, we should note that, like Total Pet Spending, Income is the highest performing demographic characteristic. In Pet Products there are only 4 groups with a performance rating of 120+%, 1 less than last year and 1 less than Total Pet in 2022. This reflects the fact that Pet Products spending, especially on Food, is spread more evenly across the category segments.

- Race/Ethnic – White, not Hispanic (82.7%) down from 83.8%. They are the 2nd largest group but still account for the vast majority of spending in every segment. Their performance fell from 124.8% to 123.1% but they moved up from 4th to 3rd in terms of importance in Pet Products Spending demographic characteristics. Hispanics, African Americans and Asian American account for 32.8% of U.S. CU’s, but they only spend 17.3% of Pet Products $. Although the minority share of Pet Poducts $ is low, it has improved considerably from 12.8% in 2020. Pet ownership is relatively high in Hispanic households, but it is significantly lower for African Americans and Asians.
- Housing – Homeowners (80.0%) up from 79.3%. Controlling your “own space” has long been the key to pet ownership and more pet spending. Their performance grew from 122.6% to 123.0% and they officially moved up from 5th to 4th in terms of importance for increased pet products spending. Although both Homeowners and Renters spent more on Pet Products in 2022, 76% of the increase came from Homeowners w/o a Mortgage. Those with a Mortgage spent $0.51B, +1.6% more but that was much better than Renters. Overall, Homeowneers were +5.2% while Renters were +0.6%. This disparity caused the positive change in Share & Performance for Homeowners.
- # in CU – 2+ people (81.4%) up from 80.8%. The share for Pet Products is higher than for Total Pet, 80.8%. If you put 2 people together, pets very likely will follow. If you have a pet, you must spend money on food and supplies. Their performance of 117.9% is up from 116.2%. Only 2 & 5 People CUs spent less but this was overcome by a 33% lift from 3 People CUs. Singles were only +1.0%. This combination improved share & performance for 2+ People CUs.
- Area – Suburban & Rural (72.7%) up from 72.1%, but their performance fell from 111.8% to 111.0%. Suburban households are the biggest pet spenders and they are growing in popularity. The increase in the number of CUs is what pushed the group performance down. Rural CUs alone grew by 1331, +5.5%.
- Education – Assoc Degree> (68.6%) down from 73.4%. Their performance level also dropped sharply from 127.2% to 118.9%. They fell from 2nd to 5th in importance and are no longer in the 120+% club. The drops in share and performance are only due to a $3.5B decrease in spending by College Grads. All groups with less than a College Degree spent more on Pet Products. The Associates Degree group did especially well, +46.5%.
- Income – Over $70K (64.3%, down from 65.3%). Pet Parenting is common in all income groups but money is a big driver in the spending behavior for all industry segments. Although their performance fell to 136.0% from 145.7%, CU income continues to be the single most important factor in increased Pet Products Spending. As a general rule, Higher Income = Higher Pet Products Spending. In 2022 there was an up & down rollercoaster in Pet Products spending but performance grew with income. All and only, income segments over $70K perform at 100+%.
- # Earners – “Everyone Works” (65.3%) up from 64.1%. Their performance is 111.9%, down from 113.0%. In this group, all adults in the CU are employed. While 1 Earner, Singles spent $0.44B less, 2+ Earner CUs spent $2.75B more. This produced the increase in share. The drop in performance was due to a 2.45 million increase in CUs (Note: other groups were down -1.98 million CUs) along with a $2.14B spending lift from 1 Earner, 2+ People CUs. Income is the top priority in Pet Products Spending, but how many people work to get it is less important.
- Occupation – All Wage & Salary Earners (64.7%) up from 60.7%. Their performance also grew from 102.2% to 107.2%. Mgrs/Professionals had the biggest lift but only Tech/Sls/Cler spent less among the employed. Blue Collar $ were +32.5%. Retirees & A/O,Unemployed spent $2.1B less. Together, this produced the lift in share & performance.
- CU Composition – Married Couples (61.1%) down from 63.7%. Their performance fell from 134.4% to 127.8% but they went from 3rd to 2nd in importance. Only Married, Couple Only & CUs with a Child 6>17 spent less, -$4.1B. Single Parents & Unmarried, 2+ Adult CUs were +$2.3B. These were key factors in the drops in share & performance.
- Age – 35>64 (61.3%) up from 59.7%. Their performance also grew from 113.9% to 117.7%. Even with a -$1.26B drop by 35>44, their spending grew by +$2.49B. Outside of the group the combined change was -$0.07B. This produced the big gains in share and performance. However, they stayed in 7th place in terms of importance.
The biggest spending groups are the same for Pet Products as for Total Pet, but there are subtle differences in market share and performance. Money matters most but how many earners, their occupation and education matters less. It also appears that Pet Products Spending is becoming more balanced across almost all demographic categories.
Now, let’s drill deeper and look at 2022’s best and worst performing Products spending segments in each category.

Most of the best and worst performers are the ones that we would expect. However, there are 9 that are different from 2021. That is 2 less than last year but 2 more than Total Pet this year. Changes from 2021 are “boxed”. We should note: Only 2 of the Product winners are different from Total Pet – $150>199K rather than $200K> and 3 People CUs rather than 4 people CUs. These differences are slight, and both reinforce the importance of Income & Family in Pet Spending.
The average performance of the 2022 Product winners was 136.1%, down from 148.6% – 10 were down. The average for the losers was 60.7%, up from 56.3% – 10 were up. The gap between best and worst narrowed from 92.3% to 75.4% indicating that Pet Products spending became more balanced across America in 2022. We should also note:
- Generation – Gen X continues to hold their spot at the top. However, Gen Z has “awakened” which has pushed the oldest group, those Born <1946 to the bottom.
- Income, # Earners – The new winners are still at or near the top In CU income. The importance of income is also reinforced by a number of other winners, including Mgrs/Prof., 45>54, Adv. College Degree & Gen X.
- CU Composition, CU Size – Families and children remain important. Married, w/Children now outperforms Married, Couple Only. All Married CUs perform at 100+% but even Single Parents are up to 97%.
- Age – The high-income 45>54 group replaced 35>44. After the “youth” spending surge in 2021, especially on Supplies, spending is skewing towards older Gen Xers.
- Region – The Midwest took the top spot from the West, and they are the only 2 Regions performing at 100+%. However, the “under performers” are from 91>93% so spending is still relatively regionally balanced.
It’s time to “Show you the money”. Here are segments with the biggest $ changes in Pet Products Spending.
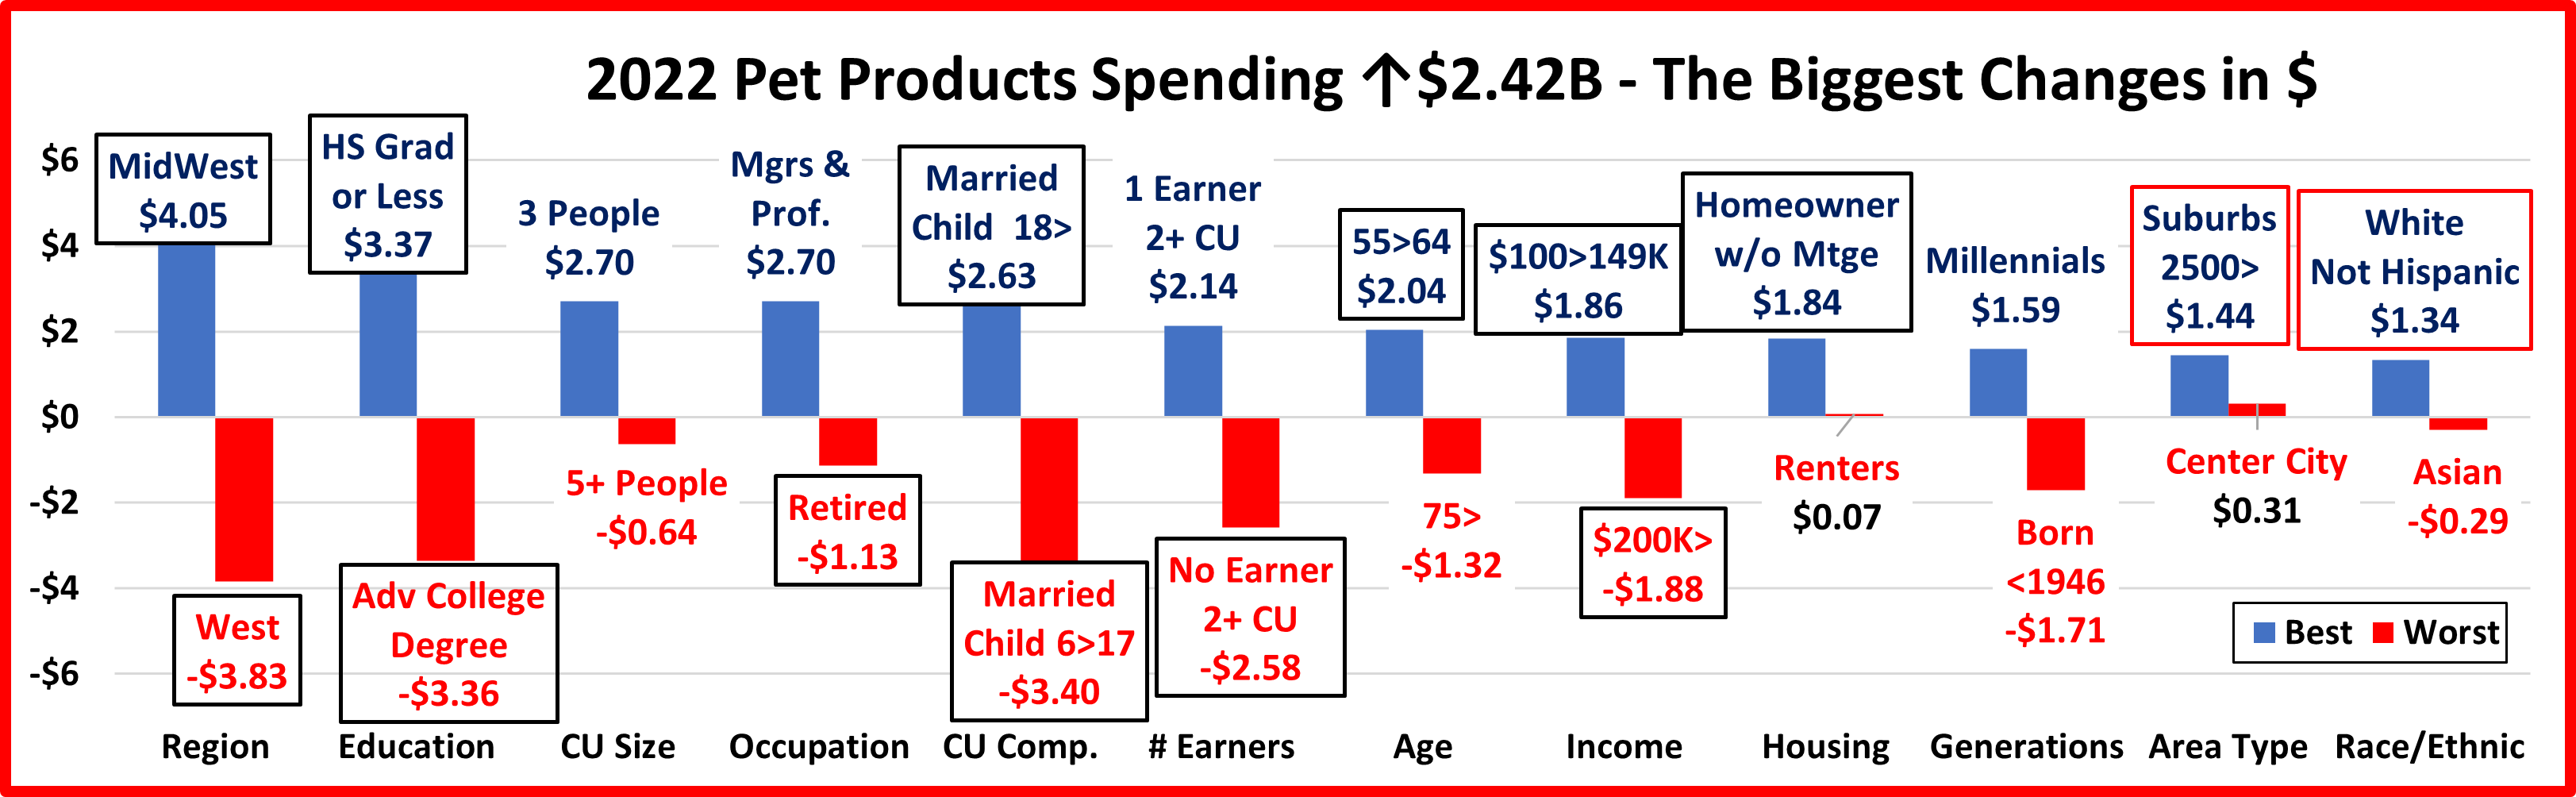
In this section we’ll see who drove Pet Products spending up. There are 2 repeats from 2021 and 12 Segments switched positions – from first to last or vice versa. This is slightly less turmoil than 2021 which had only 1 repeat but 16 flips. There is only 1 truly surprising winner, High School Grads or Less. In 2 categories, all spent more. Here are the specifics:
- Region – Both the 2021 winner and loser flipped in 2022.
- Winner – Midwest – Products Spending: $14.93B; Up $4.05B (+37.2%) 2021: West
- Loser – West – Products Spending: $14.54B; Down $3.83B (-20.9%) 2021: Midwest
- Comment – The West had drops in both Food & Supplies. The NE had the only other decrease – in Supplies only.
- Education – Both winner and loser flipped.
- Winner – HS Grad or Less – Products Spending: $10.45B; Up $3.37B (+47.5%) 2021: Adv College Degree
- Loser – Adv College Degree – Products Spending: $15.87B; Down $3.36B (-17.5%) 2021: Less than HS Grad
- Comment – There was a clear dividing line in the 2022 Pet Products spending pattern. Those with at least a BA/BS degree spent less. All segments without a college degree spent more.
- # in CU – Both the winner and loser are new. Only 3 People CUs spent more on both Food & Supplies.
- Winner – 3 People – Products Spending: $10.88B; Up $2.70B (+33.1%) 2021: 2 People
- Loser – 5+ People – Products Spending: $7.14B; Down $0.64B (-8.2%) 2021: 4 People
- Comment: All but 3 people CUs spent less on Supplies but only 2 and 5+ CUs spent less on Pet Products.
- Occupation – Retirees flipped from 1st to last.
- Winner – Mgrs & Professionals – Products Spending: $21.33B; Up $2.70B (+14.5%) 2021: Retired
- Loser – Retired – Products Spending: $10.23B; Down $1.13B (-9.9%) 2021: Self-Employed
- Comment – All but Retirees, Tech/Sls/Cler and All Other/Unemployed spent more. Retirees $ were down due to a big drop in Food. The other drops came because of a big decrease in Supplies spending.
- CU Composition – Again, both the winner and loser flipped.
- Winner – Married, Oldest child 18> – Products: $6.96B; Up $2.63B (+60.8%) 2021: Married, Oldest Child 6>17
- Loser – Married, Oldest Child 6>17 – Products: $8.08B; Down $3.40B (-29.6%) 2021: Married, Oldest Child 18>
- Comment – Married Couple Only and Married, Oldest Child 6>17 were the only segments to spend less on Pet Products, but their drop was enough to turn Total Married Couples negative. Most segments were up in Food but down in Supplies. Only Oldest Child 18> and Married, plus Adults, but no kids were up in both Food & Supplies $.
- # Earners – The winner is new but No Earner, 2+ People CUs flipped to the bottom spot.
- Winner – 1 Earner, 2+ CU – Products Spending: $12.22B; Up $2.14B (+21.2%) 2021: No Earner, 2+ CU
- Loser –– No Earner, 2+ CU – Products Spending: $4.47B; Down $2.58B (-36.6%) 2021: 2 Earners
- Comment – While income matters most, the # of Earners is still not a major factor in Pet Products spending as 1 Earner, 2+ CUs won. Only 1 Earner, Singles and No, Earner, 2+ People CUs spent less.
- Age – The 55>64 yr-olds flipped from last to first and 75> moved to the bottom due to a big drop in Food $
- Winner – 55>64 yrs – Products Spending: $13.25B; Up $2.04B (+18.2%) 2021: 35>44 yrs
- Loser – 75> yrs – Products Spending: $3.41B; Down $1.32B (-27.9%) 2021: 55>64 yrs
- Comment: The only spending drops came from 25>44 and over 75. The 45>74 yr-olds spent more in both Food & Supplies. Only 25>34 yr-olds spent less on both – minor decreases. Supplies $ drove the 35>44 group down.
- Income – Both winner and loser flipped.
- Winner – $100 to $149K – Products Spending: $11.67B; Up $1.86B (+19.0%) 2021: $200K>
- Loser – $200K> – Products Spending: $9.77B; Down $1.88B (-16.1%) 2021: $100>149K
- Comment – A spending rollercoaster: <$40K = -$0.63B; $40>69K = +$2.07B; $70>99K = -$0.32B; $100>199K = +$3.19B; $200K> = -$1.88B. Most Impressive: $40>49K was +34.6% and spent more on both Food & Supplies.
- Housing – Homeowners w/o Mtge flipped from last to 1st but all segments spent more on Pet Products.
- Winner – Homeowner w/o Mtge – Products: $15.93B; Up $1.84B (+13.1%) 2021: Homeowner w/Mtge
- Loser –– Renter – Products Spending: $12.10B; Up $0.07B (+0.6%) 2021: Homeowner w/o Mtge
- Comment– Wealthier Homeowners who have paid off their homes, but are not retired, were the big drivers.
- Generation – Both the winner and loser are new.
- Winner – Millennials – Products Spending: $15.14B; Up $1.59B (+11.8%) 2021: Gen X
- Loser – Born <1946 – Products Spending: $2.77B; Down $1.71B (-38.2%) 2021: Baby Boomers
- Comment – There were only 2 Pet Products negatives – Gen X had a strong lift in Food, but it was overcome by a huge drop in Supplies $ and Born <1946, who were up slightly in Supplies but had a big drop in Food $.
- Area Type – The larger Suburbs held their spot on top. Center City is a new loser, but all Area Types spent more.
- Winner – Suburbs 2500> – Products Spending: $26.70B; Up $1.44B (+5.7%) 2021: Suburbs 2500>
- Loser – Center City – Products Spending: $16.56B; Up $0.31B (+1.9%) 2021: Population <2500
- Comment – <2500 was the only area to spend more on Supplies & Food. Center City had the only drop in Food $.
- Race/Ethnic – White, Non-Hispanic held their spot on top while Asians replaced African Americans at the bottom.
- Winner – White, Not Hispanic – Products Spending: $50.14B; Up $1.34B (+2.7%) 2021: White, Not Hispanic
- Loser – Asian – Products Spending: $1.50B; Down $0.29B (-16.4%) 2021: African American
- Comment – African Americans didn’t win but they spent 59.7% more overall and were the only group to spend more on Supplies – and on both Food & Supplies. On the flip side, Asians were the only group to spend less on both Food & Supplies. White, Not Hispanic “won” because a $3.28B Food lift overcame a $1.94B drop in Supplies.
We’ve now seen the winners and losers in terms of increase/decrease in Pet Products $ for 12 Demographic Categories. 2022 was a positive, but mixed year for Pet Products Spending. Food rebounded after the big 2021 drop from the binge buy in 2020. The lift was enough to overcome the drop in Supplies $ after the record post pandemic spending surge in 2021. In 2022, 52% of segments still spent more on Supplies, but 82% spent more on Food so that 70% spent more on Pet Products. Of course, not every good performer can be a winner but some of these “hidden” segments should be recognized for their outstanding effort. I’ve narrowed the group down to 6. They don’t win an award, but they deserve…
Honorable Mention

Pet Products spending was up $2.42B in 2022. A rebound in Food exceeded the big drop in Supplies. The lift in Pet Products spending was widespread as 70% of 96 demographic segments spent more. Income was still the most important factor, but spending became a little more balanced. In our honorable mention group, you see that Gen Z truly got into the game by more than doubling their Pet Products spending. Although 2022 spending skewed towards the older Gen X group, 70% lifts by the <25 group and CUs with an oldest child <6 showed that the younger groups were still “strong” pet parents. Some other low-income segments that often finish on the bottom in spending also had a good year. Single Parents and African Americans both increased their Pet Products spending by 58+%. Finally, Higher Education became a little less important. College Grads spent less on Pet Products while all demographic segments w/o a college degree spent more. Those with an Associate’s degree were a big contributor with a 46% increase. The lift in Pet Products spending was widespread and more balanced so there were many “heroes”.
Summary
Pet Products spending has seen a lot of turmoil since 2015. Many consumers upgraded to Super Premium Food and cut back on Supplies in 2015. In 2016 they value shopped for Food and Spent some of the saved money on Supplies. In 2017 there was increased availability and value in both segments. More Consumers recognized the opportunity and spent $7B more. 2018 was calm, until the second half when the FDA warning on grain free dog food caused many consumers to downgrade their food and new tariffs on Supplies flattened spending growth. The result was -$1B drop in Products $.
In 2019 Pet Food spending rebounded to a new record level but the full impact of higher prices in the Supplies segment really hit home, with a record $2.98 decrease in spending. The drop was almost universal as 93 of 96 demographic segments spent less. The result was a -$0.64B drop in Pet Products $, the second consecutive decrease.
2020 brought the COVID pandemic. Out of fear of reduced availability, Pet Parents binge bought Pet Food in the 1st half of the year. As Pet Parents focused on “needs”, discretionary Supplies dropped significantly in importance and $. However, Pet Products spending still grew by $3.99B and exceeded $50B for the 1st time at $52.0B.
In 2021, the Food binge was not repeated and pets “ate down” the overstock so Pet Food spending fell. However, Pet Parents caught up on purchasing all the Supplies that they had postponed buying due to the pandemic. The result was a record increase in Supplies and a $6.21B increase in Pet Products $.
2022 brought a return to more normal spending behavior. Pet Food spending increased $4.29B, +12.5%. Obviously, the binge was not repeated but Supplies spending only fell -7.8% and 52% of demographic segments still spent more. The net was a $2.42B, +4.2% increase which pushed Pet Products $ up to $60.63B. Overall, the lift was widespread as 70% of 96 demographic segments spent more. While the Spending leader remained Gen X, the $ moved towards their older members in the 45>54 yr-old age group. However, the youngsters also made their presence felt as Gen Z more than doubled their Pet Products spending. Spending also became more demographically balanced. The most visible feature of this change was in the big groups doing at least 60% of the dollars. In order to reach the 60% minimum, the Education group was downgraded from College Grads to those with an Associate’s Degree or more. However, the balancing act was not limited to Education. 10 of 12 categories narrowed the gap between their best and worst performing segments. Overall, the average gap narrowed from 92.3% in 2021 to 75.4% in 2022. It’s still big but definitely improving.
Finally,… The “Ultimate” 2022 Pet Products Spending CU is 3 people, a married couple with a child over 18. They are in the 45>54 age range and are White, but not Hispanic. At least one has an Advanced College Degree and is a Mgr/Professional. Everyone works, including their child, producing a CU income of $150>199K.They still have a mortgage on their house located in a small suburb in the Midwest.

