
2022 Pet Food Spending was $38.69B – Where did it come from…?
As we continue to drill ever deeper into the demographic Pet spending data from the US BLS, we have now reached the level of individual Industry segments. We will start with Pet Food, the largest and arguably most influential of all. We have previously noted the trendy nature of Pet Food Spending. In 2018 we broke a pattern which began in 1997 – 2 years up then spending goes flat or turns downward for a year. We expected a small increase in 2018 but what we got was a $2.27B decrease (-7.3%). This was due to the reaction to the unexpected FDA warning on grain free dog food. A pattern of 20+ years was broken by 1 statement. The grain free warning lost credibility and spending rebounded in 2019, +$2.35B (+7.1%). In 2020 the market was hit by an even bigger outside influence – the pandemic. The impact varied by segment. In Pet Food, it created a wave of panic buying out of fear of shortages, resulting in a $5.65B (18.1%) lift. The panic buying wasn’t repeated in 2021 resulting in a $2.44B (-6.6%) drop in spending. In 2022 spending returned to more “normal” behavior with a strong $4.29B, +12.5% increase to $38.69B, a new record high. Let’s take a closer look.
First, we’ll see which groups were most responsible for the bulk of Pet Food spending and the $4.29B increase. The first chart details the biggest pet food spenders for each of 10 demographic categories. It shows their share of CU’s, share of pet Food spending and their spending performance (Share of spending/share of CU’s). All are the same as Total Pet. The categories are presented in the order that reflects their share of Total Pet Spending. The big difference is that $70K> income has the smallest share of Food $. This difference is magnified in performance. Being Married is the most important factor in Food spending. In Total Pet and other segments, Income is the most important. Food spending is also a little more balanced than Total Pet Spending. This is evident by the fact that the Performance of only 4 groups exceeds 120%. In Total Pet and Pet Products there were 5. In 2022, Pet Food accounted for 63.8% of Pet Products $ and 37.7% of Total Pet. This is better than 59.1% and 34.4% in 2021 but still far below 70.8% of Pet Products and 44.0% of Total Pet in 2020 and even 65.0% and 39.5% in pre-pandemic 2019. Spending is a little more balanced between industry segments.
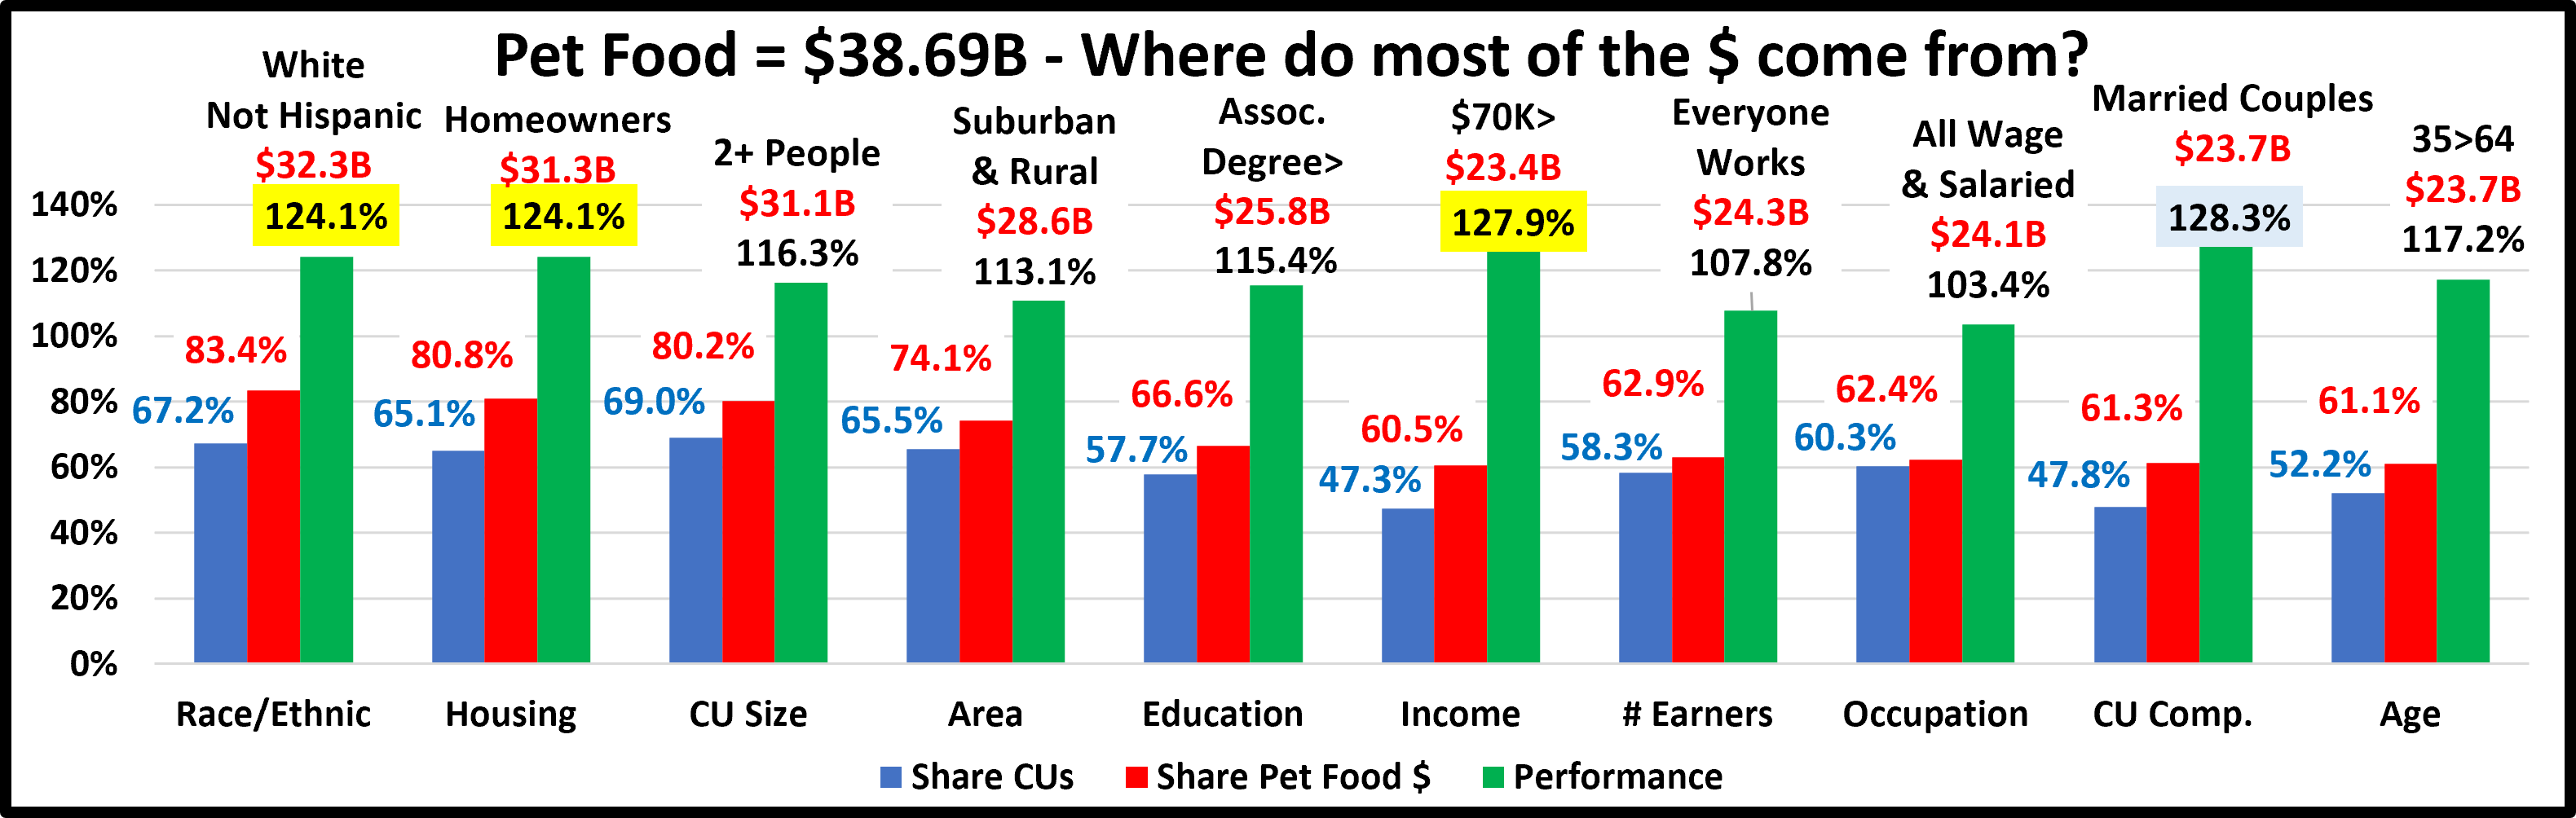
- Race/Ethnic – White, not Hispanic (83.4%) – down from 84.2%. This large group accounts for the vast majority of spending in every segment. They lost share and their performance decreased to 124.1% from 125.2%, but this category moved up from #4 to a tie for #3 in terms of importance in Pet Food Spending demographic characteristics. Hispanics, African Americans and Asians account for 32.8% of U.S. CU’s, but they spend only 16.6% of Pet Food $. Asians were the only minority to spend less on Food. Hispanics and African Americans spent $1.2B more.
- Housing – Homeowners (80.8%) – down from 81.0%. Homeownership is a huge factor in pet ownership and pet spending. In 2022, homeowners lost a little share and their performance fell from 125.1% to 124.1%. However, homeownership moved up from 5th to a tie for 3rd in importance. Renters were +13.8%. Homeowners were +12.1%
- # in CU – 2+ people (80.2%) – up from 79.1%. The share of market grew for 2+ CUs and is again back over 80% for Pet Food. Their performance also grew from 113.8% to 116.3% but their rank stayed at #6. Only 2 person CUs spent less, but 79% of the increase in Food $ came from a $2.3B lift from 3 people CUs and a $1.1B lift by 4 people CUs. Although Singles spent more, their increase was only 6.1%, less than half of the 14.1% for 2+ CUs. This drove the increase in share and performance. Singles are the only CU size performing below 100% – 63.7%.
- Area – Suburban + Rural (74.1%) up from 69.4%. Their performance grew from 107.6% to 113.1%. (still 8th) Only Center City spent less but 98% of the Food increase came from a $4.2B, +33.0% lift by Suburbs over 2500 population.
- Education – Assoc. Degree> (66.6%) – down from 71.5%. College Grads share fell below 60% due to a big lift by <College Grads. The group now includes Associate’s degrees. Performance fell from 123.9% to 115.4% (No longer in the 120+% Club) and higher education fell from 3rd to 7th in importance in increased Pet Food Spending.
- Income – Over $70K (60.5%) – down from 63.1%. Their performance also dropped from 140.9% to 127.9% and they fell from 1st to 2nd in importance. High income is still very important in Pet Food Spending but the bar was lowered slightly in 2022. The 50/50 $ divide fell from $92K in 2021 to $91K in 2022. The <$100K group was up $2.2B while $100K> was up $2.09B – pretty balanced. The only spending decrease came from $70>99K, -$0.4B. This caused the drop in share and performance. Pet ownership is common across all income levels but only groups with an income over $70K perform at 100+%.
- # Earners – “Everyone Works” (62.9%) – up from 57.6%. This was a huge increase from last year and their performance also increased from 101.7% to 107.8%. They moved up from 10th (last) to 9th in importance. No Earner, 2+ CUs spent $2.2B less while 2+ Earners CUs spent $4.5B more. This drove the lift in share & performance.
- Occupation – All Wage & Salaried Workers (62.4%) – up from 60.5% – Only Retirees spent less so this workers group’s performance also grew slightly from 102.0% to 103.4%. However, Occupation is now last in importance in Pet Food spending.
- CU Composition – Married Couples (61.3%) – down from 64.8%. They lost share and their performance fell from 136.8% to 128.3%, but they moved up to #1 in importance. Married, Couples Only and those with an oldest child 6>17 years old were the only segments that spent less so Married CUs had a smaller increase than Unmarried CUs.
- Age – 35>64 (61.1%) – up from 55.0%. This younger group replaced 45>74 yr-olds. Their performance grew from 105.0% to 117.2% and age moved up from #7 to #5 in importance. 45>64 is in both groups. The change happened because the 35>44 share is 18.6% while 65>74 is 17.2%. Only 25>34 and 75> spent less on Pet Food in 2022.
All of the big spenders for Pet Food are the same as Total Pet. Last year there was 1 special group and in 2020 there were 3. 2022 brought a return to a more normal spending pattern and spending became slightly more balanced. This is best illustrated by the fact that in 2022 the performance for only 4 groups exceeds 120% with the highest at 128.3%. In 2021 there were 5, with 3 over 130%. In 2020 there were 8 at 120+%, 5 of which had a performance level above 130%.
Now, we’ll look at 2022’s best and worst performing Pet Food spending segments in each category.

Almost all of the best and worst performers are the ones that we would expect. 2022 produced just 1 surprise – Married, Oldest Child <6 won in CU Composition. There are 4 different winners from 2021 and 7 different losers. This is much different from 2021, which had 10 new winners and 5 new losers. This reflects a more stable environment among the winners. Changes from 2021 are “boxed”. We should also note the performance gap between winner and loser narrowed in 9 categories. Overall, the average gap fell from 82.8% in 2021 to 73.5%. More evidence of increased spending balance. Here are some more performance specifics:
- Income No changes. Although the gap narrowed from 141% to 112%, this is the only category with a gap over 100%.
- # Earners – The highest income group moved to the top, but the gap narrowed from 90% to 71%.
- Occupation – Mgrs/Prof. stayed on top, but Service Workers replaced Blue Collar & the gap widened – 45% to 54%
- Age, Generation- The high income, 45>54 Gen Xers stayed on top. The oldest replaced the youngest on the bottom.
- Race – The usual winner and loser. The gap narrowed from 103.2% to 93.9%.
- Education – Higher education with its higher income mattered in Pet Food Spending but the gap was only 53.7%.
- Housing – Owning a home is always important. The usual winner & loser returned. The gap narrowed by only 4.1%.
- CU Comp., CU Size– Married, Oldest Child <6 was a surprise. Singles replaced Single Parents. 3 replaced 5+ CUs.
- Region – Midwest flipped from Worst to Best and the South took their place at the bottom.
- Area – The areas <2500 population stayed on top and Center City regained its usual position as the worst performer.
It’s time to “Show you the money”. Here are segments with the biggest $ changes in Pet Food Spending.
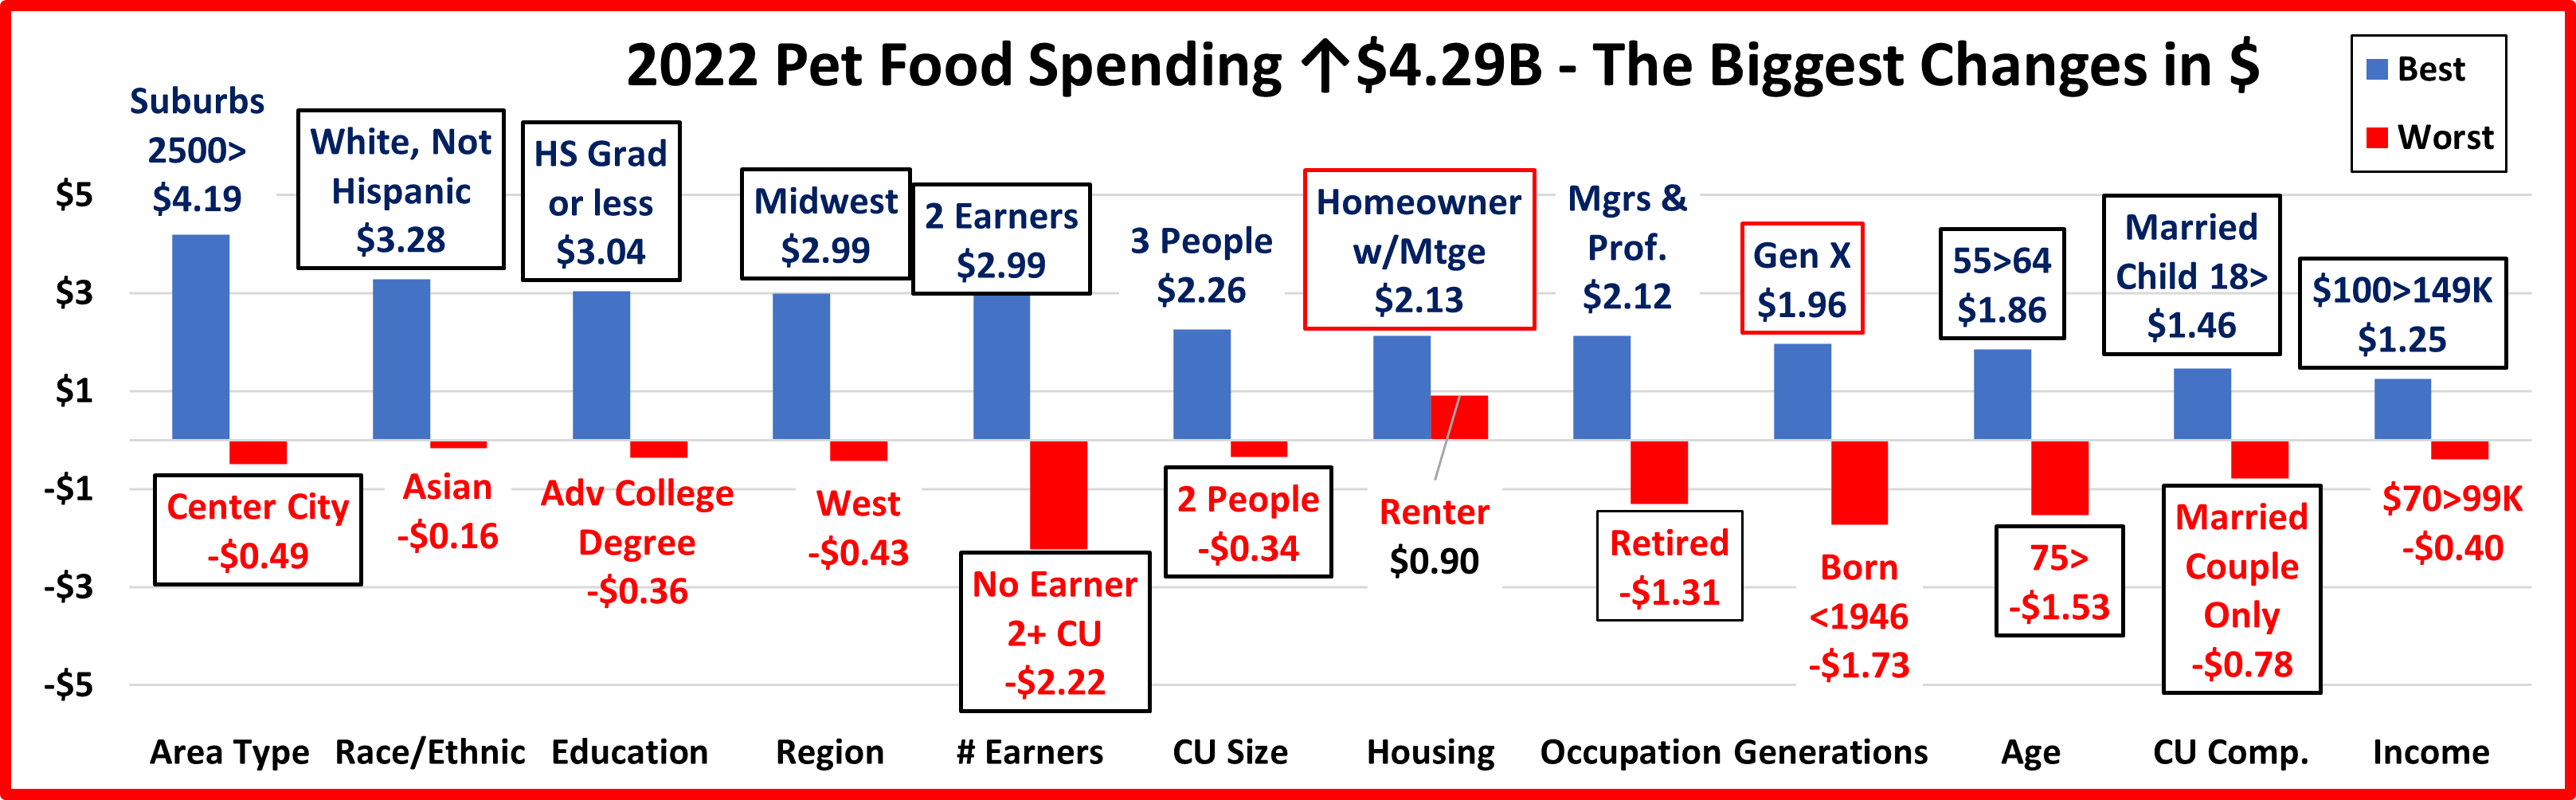
There are 2 repeats from 2021. 6 losers won last year and 7 of the winners were 2021 losers. 54% flipped from 1st to last or vice versa, down from 71% in 2021. Almost all of the winners are expected. The only Surprise winner was HS Grad or Less. The surprising losers were Adv. College Degree, 2 People and Married Couple Only. Spending grew 12.5% as 82% of 96 demographic segments spent more. Plus, all segments in the Housing category had increases. Here are the specifics:
- Area Type – Center City, the 2021 surprise winner, had the only spending decrease, and flipped to last.
- Winner – Suburbs 2500> – Pet Food Spending: $16.86B; Up $4.19B (+33.0%) 2021: Center City
- Loser – Center City – Pet Food Spending: $10.05B; Down $0.49B (-4.7%) 2021: Areas <2500
- Comment – The Areas <2500 also spent a little more, +$0.59B (+5.3%).
- Race/Ethnic – White, Not Hispanics flipped to the top and Asians replaced them at the bottom.
- Winner – White, Not Hispanic – Pet Food Spending: $32.26B; Up $3.28B (+11.3%) 2021: Hispanic
- Loser – Asian – Pet Food Spending: $0.84B; Down $0.16B (-15.9%) 2021: White, Not Hispanic
- Comment – The U.S. is becoming more racially/ethnically diverse but White, Not Hispanics are by far the biggest spender in every Pet Segment. Asian Americans had the only decrease, but it was not surprising after growing 130% in 2021. Pet Food spending became more balanced. Both African Americans & Hispanics were up 20+%.
- Education – Higher education fell in importance in Pet Food spending as HS Grads or Less flipped to the top.
- Winner – HS Grads or less – Food Spending: $7.78B; Up $3.04B (+64.0%) 2021: BA/BS Degree
- Loser – Adv College Degree – Food Spending: $10.03B; Down $0.36B (-3.5%) 2021: HS Grads or less
- Comment – The $3.04B lift was almost equally divided between those with only a HS Diploma and those without. Those with an Associate’s Degree finished in 3rd place with a $1.14B, 36.5% increase. In fact, only those with an Advanced College Degree spent less on Pet Food in 2022. Note: In 2021 they were up $2.63B, +33.9%
- Region – The Midwest flipped from last to 1st.
- Winner – Midwest – Pet Food Spending: $9.58B; Up $2.99B (+45.5%) 2021: South
- Loser – West – Pet Food Spending: $8.56B; Down $0.43B (-4.7%) 2021: Midwest
- Comment – In 2021, only the Midwest spent less. In 2022, it was only the West, but their decrease was only -4.7%.
- # Earners – The winner and loser flipped putting both in a more normal position.
- Winner –– 2 Earners – Pet Food Spending: $15.08B; Up $2.99B (+24.7%) 2021: No Earner, 2+ CU
- Loser – No Earner, 2+ CU – Pet Food Spending: $3.13B; Down $2.22B (-41.5%) 2021: 2 Earners
- Comment – 1 Earner, Singles were the only other segment to spend less, and their drop was only -$0.01B (-0.3%). All other segments were up at least 17.5%. The number of earners is definitely less important than income.
- # in CU – 2 People CUs flipped to the bottom.
- Winner – 3 People – Pet Food Spending: $7.17B; Up $2.26B (+46.1%) 2021: 2 People
- Loser – 2 People – Pet Food Spending: $14.23B; Down $0.34B (-2.3%) 2021: 4 People
- Comment: Only 2 People CUs spent less on Pet Food in 2022. While 3 People CUs had the biggest increase, 4 People CUs were also up $1.11B (+25.5%) and 5+ CUs grew by $0.82B (+24.3%).
- Housing – Homeowners w/Mtges held onto their expected position on top.
- Winner – Homeowners w/Mtge – Food: $20.90B; Up $2.13B (+11.3%) 2021: Homeowners w/Mtge
- Loser – Renters – Food: $7.44B; Up $0.90B (+13.8%) 2021: Homeowners w/o Mtge
- Comment – All segments spent more so Renters “lost” with a $0.90B increase. Homeowners w/o Mtge, also spent $1.3B more so they are at $10.05B, +22.5% vs 2019. They have recovered from the binge & drop in 20/21.
- Occupation – After 4 years away, Managers & Professionals returned to the Top. Retirees flipped to the bottom.
- Winner – Mgrs & Professionals – Pet Food Spending: $12.97B; Up $2.12B (+19.6%) 2021: Retired
- Loser – Retired – Pet Food Spending: $7.13B; Down $1.31B (-15.5%) 2021: Self-Employed
- Comment – Only Retirees spent less. All occupations including A/O & Unemployed spent more. Mgrs/Profess. had the biggest $ lift but the highest % increase belonged to Blue Collar Workers, +40.2%.
- Generation – Gen X held on to the top spot.
- Winner – Gen X – Pet Food Spending: $13.08B; Up $1.96B (+17.6%) 2021: Gen X
- Loser – Born <1946 – Pet Food Spending: $1.88B; Down $1.73B (-47.9%) 2021: Baby Boomers
- Comment – Much of the 2020>21 Pet Food spending boom and bust was due to the Boomers. Gen X has now taken over and held on to the top position. Only those Born <1946 spent less on Pet Food in 2022. After their big drop in 2021 the Boomers again spent more on Pet Food. However, their $1.50B increase ranked only 3rd behind Gen X, +$1.96B and Millennials, +$1.56B. Gen Z also spent +158% more so they are now entering the “game”.
- Age – The Winner and loser both flipped.
- Winner – 55>64 yrs – Pet Food Spending: $8.60B; Up $1.86B (+27.5%) 2021: 75+ yrs
- Loser – 75+ yrs – Pet Food Spending: $2.23B; Down $1.53B (-40.8%) 2021: 55>64 yrs
- Comment: Only 25>34 & 75> spent less. The big drop by 75> may have been from them downgrading their food due to high inflation. The 55>64 group is about 70% high income Boomers which produced most of their lift.
- CU Composition – Again the winner and loser both flipped.
- Winner – Married, Oldest Child 18> – Food: $4.04B; Up $1.46B (+56.7%) 2021: Married, Couple Only
- Loser – Married, Couple Only – Food: $10.82B; Down $0.78B (-6.7%) 2021: Married, Oldest Child 18>
- Comment – Only Married, Couple Only and those with an Oldest Child 6>17 spent less. There were strong increases in a number of unexpected segments. Those with an Oldest Child <6 were +$1.24B. Single Parents were +$1.22B as were Unmarried, 2+ All Adult CUs. Overall, CUs with Children were +3.29B.
- Income – In a second consecutive flip, $100>149K flipped again to the top.
- Winner – $100 to $149K – Pet Food Spending: $6.71B; Up $1.25B (+23.0%) 2021: $150 to $199K
- Loser – $70 to $99K – Pet Food Spending: $5.81B; Down $0.40B (-6.5%) 2021: $100 to $149K
- Comment – The $70>99K group was the only segment to spend less. Spending increases were widespread but $50>69K was +$1.23B, a very close 2nd. $40>49K was +40.5%. This made <$70K +20.5% compared to $70> +7.8%.
We’ve now seen the “winners” and “losers” in terms of increase/decrease in Pet Food Spending $ for 12 Demographic Categories. In 2020, very specific segments binge bought Pet Food. In 2021, their pets “ate up” the overstock so Pet Food spending fell. 2022 brought a new challenge, strong inflation. However, most of America remains firmly committed to high quality Pet Food. Super premium Food already had high prices, so income is still very important in Pet Food spending. The pandemic and inflation have accelerated value shopping, especially on the internet. The result was 82% of all demographic segments spent more on Pet Food in 2022 producing a $4.29B, 12.5% increase. We have identified the winning segments in performance and $ increase but they were not alone. Not every good performer can be a winner. Some “hidden” segments should also be recognized for performance. They don’t win an award, but they get…
HONORABLE MENTION

This group clearly demonstrates that the lift in Pet Food spending was very demographically widespread. The first thing that you notice is that the youngest Americans have become much more committed to Pet Parenting. Gen Z and the <25 group (All Gen Z) more than doubled their Pet Food spending in 2022. Also, Super Premium Pet Food prices are high and inflated in 2022 but lower income groups still “found a way”. Single Parents, African American, Blue Collar Workers and $40>49K CUs all have low incomes and are under tremendous financial pressure. They often finish at the bottom in performance, but not in 2022. Single Parents more than doubled their Pet Food spending and the other groups increased spending over 40%. Pet Parenting is widespread, and all are committed to the welfare of their children.
Summary
Pet Food has been ruled by trends over the years. The drop in 2018 due to the FDA grain free warning broke a pattern of 2 years up followed by 1 year of flat or declining sales which had been going on since 1997. This trendy nature increased with the first significant move to premium foods in 2004. The Melamine crisis in 2007 intensified the pattern and resulted in a series of “waves” which became a tsunami with the introduction of Super Premium Foods.
The 25 to 34 yr old Millennials were the first to “get on board” with Super Premium in the 2nd half of 2014. In 2015, many more groups began to upgrade. The result was a $5.4B spending increase. These consumers were generally more educated and had higher incomes. Unfortunately, they often paid for the upgrade by spending less in other segments. In 2016 the anticipated drop in spending happened. Many value shopped for their new food and found great deals, especially online. They spent some of the $3B “saved” Food $ in other segments but not enough to make up for the drop in Food. Total Pet Spending was down $0.46B. In 2017 we were ready for a new “wave”. However, due to a price competitive market, what we got was a deeper penetration of Super Premium. These upgraders were mostly middle-income and not college educated. The result was a $4.6B increase but this time there was no trading of segment $.
In 2018 we were “due” a small annual increase in Pet Food. Spending in the 1st half was +$0.25B but then the bottom dropped out as spending fell $2.51B in the 2nd half in reaction to the FDA warning on grain free dog food. The big decrease in spending came directly from the groups who had fueled the 2017 increase. In fact, 71% of the demographic groups with the biggest change in Pet Food $ switched from first to last or vice versa from their position in 2017.
That brought us to 2019. The FDA warning was false, so Pet Parents returned to Super Premium or even pricier options. Supplement $ also grew as the health of their Pet Children remained the #1 priority. Pet Food $ grew $2.35B with 75% of demographic segments spending more. Income and related categories mattered more, and Pet Food Spending became less demographically balanced. In 2020 the Pandemic accelerated this trend. Fear of shortages led to binge buying and a $5.65B increase. This behavior was driven by very specific groups. This spending disparity was manifested in the fact that the performance of 8 of 10 big spending groups exceeded 120% while 49% of all segments spent less.
In 2021, the retail market strongly recovered but the turmoil in Pet Food continued. The 2020 binge buying didn’t increase usage, so Pet Food spending fell by $2.44B. Every segment with the biggest increase in 2020 had the biggest decrease in 2021. The resulting drop in $ hid the fact that 65% of all demographic segments spent more on Pet Food.
In 2022 the situation returned to a more normal, balanced pattern in spending. Pet Parents renewed their commitment to high quality food for their children. Despite strong inflation, 82% of demographic segments increased spending generating a $4.29B (+12.5%) lift and reaching a new record high of $38.69B – even exceeding the 2020 binge by $1.85B.
Finally – The Ultimate Pet Food Spending CU is 3 people – a married couple with a child over 18. They are 45>54 years old and White, but not Hispanic. Everyone works and at least one has an Advanced College Degree and is a Manager or Professional. They earn $150>$199K but are still paying the mortgage on their house in a small suburb in the Midwest.
