Retail Channel Monthly $ Update – July Final & August Advance

Time for our monthly update on U.S. retail sales by channel. The current COVID-19 crisis has caused turmoil in the Retail Marketplace. Consumer spending behavior has changed and continues to evolve. In this report we will track the changes and migration between channels. We will do that with data from two reports provided by the U.S. Census Bureau.

The Reports are the Monthly Retail Sales Report and the Advance Retail Sales Report. Both are derived from sales data gathered from retailers across the U.S. and are published monthly at the same time. The Advance Report has a smaller sample size so it can be published quickly – approximately 2 weeks after month end. The Monthly Final Report includes data from all respondents, so it takes longer to compile the data – about 6 weeks. Although the sample size for the Advance report is smaller, the results over the years have proven it to be statistically accurate with the final monthly reports. The biggest difference is that the full sample in the Final report allows us to “drill” a little deeper into the retail channels.

This means to get the full picture in our monthly channel update we need to look at the latest release of both reports. We will begin with the Final Retail Report from July and then move to the Advance Retail Report for August. This will also allow us to better track the consumers’ evolving spending behavior in terms of channel migration.

Both reports include the following:

  • Total Retail, Restaurants, Auto, Gas Stations and Relevant Retail (removing Restaurants, Auto and Gas)
  • Individual Channel Data – This will be more detailed in the “Final” reports and we fill focus on Pet Relevant Channels

The information will be presented in detailed charts to facilitate visual comparison between groups/channels of:

  • Current Month change – % & $ vs previous month
  • Current Month change – % & $ vs same month in 2019
  • Current YTD change – % & $ vs 2019
  • Monthly and Year To Date $ will also be shown for each group/channel

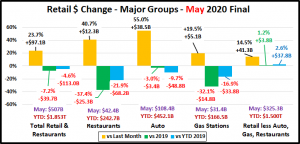
We’ll start with the July Final report. The retail market hit bottom in April then began a slow recovery which continued in July. First, we will look at some major retail groups. (Note: The Data in all graphs is Actual, Not Seasonally Adjusted)

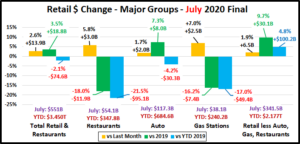
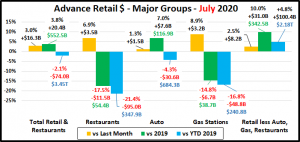
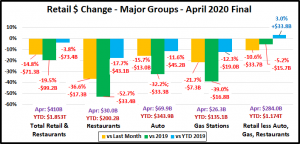
The final total is $2.5B less than the Advance report projected a month ago. All were down slightly from projections. Relevant Retail: -$1B; Auto:-$0.6B less; Restaurants: -$0.3 less and Gas Stations’ $ were -$0.4B. $ales were up vs June across the board. Driven by Relevant Retail, +$30B and Auto, +$8B, Total monthly sales were also up $18.8B vs 2019.

The Spring Lift is usually over by July but the COVID crisis has pushed the Spring timing back. Things began to open up in May and continued into July. However, all but Relevant Retail were still down YTD vs 2019.

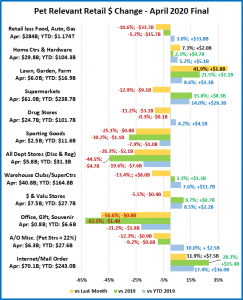
Now, let’s see how some Key Pet Relevant channels were doing in July.

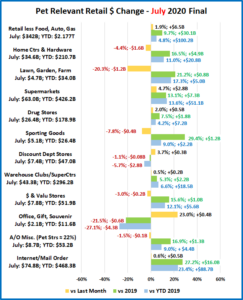
  • Overall – Sales in 5 of 11 groups were down vs June, but 9 of 11 again showed increases vs same month in 2019.
  • Building Material Stores – This group has their biggest annual lift in Spring. This is unchanged and even stronger. While sales were down vs June, they still have spectacular increases vs 2019. Although Sporting Goods stores are not included in this group, they have a similar Spring lift pattern. Their sales took off in May and continued to grow spectacularly through June. Although July sales dipped slightly from June, they turned positive YTD in June.
  • Food & Drug – After a dip in June vs May Supermarket sales are back up with incredibly strong growth vs 2019. After 2 months of slowed $, Drug Stores came back strong in June and July and remain positive across the board.
  • General Merchandise Stores – Sales in Clubs/SuperCtrs slowed down in June but are back up in July and still strong vs 2019. Despite slowed sales in June & July, $ Stores are showing exceptional strength vs 2019. Discount Dept. store sales were generally slowing before the pandemic. This trend has continued despite a small July lift.
  • Office, Gift and Souvenir Stores – They were slow to re-open. Sales are growing, but this group was hit hard.
  • Internet/Mail Order – The pandemic has accelerated this channel’s growth vs 2019. Sales vs June were flat, but the crisis has introduced many new consumers to online shopping and the behavior is likely to become habitual.
  • A/O Miscellaneous – This is a group of small to midsized specialty retailers – chains and independents. It includes Florists, Art Stores and Pet Stores (22 to 24% of total $). Pet Stores were usually essential, but most stores were not. The others began reopening in May and the number grew in June which produced an increase vs 2019. July was down slightly from June but was strong vs 2019 which pushed YTD sales up to +9.0%.

May began a slow recovery which continued in June and July as even more businesses began to re-open. The Relevant Retail Segment turned positive in all measurements in May and has stayed that way through July. Although many segments are now contributing, the Internet, Supermarkets, SuperCtrs/Clubs/$ Stores and Hdwe/Farm are the key drivers. Let’s see how the situation is progressing. Here are the Advance numbers for August.

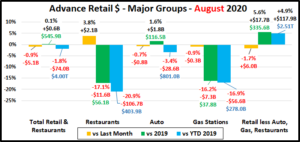
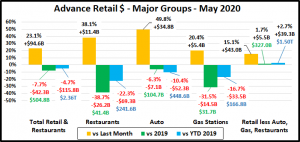
April and May were the 2 biggest spending drops in history. In June, monthly sales turned positive for the first time since February. In July the recovery continued. However, it flattened out in August leaving Total Retail still down -$74B YTD.

Total Retail – Total Retail spending increased $0.6B, +0.1% vs 2019, a big change from +3.9% in July and +3.4% in June. In February 2020 sales were up $60B, +6.6% YTD versus 2019. Then came COVID-19. Hopefully, we hit bottom at -$112B in May. We began moving in the right direction but have stalled in August, still -$74B YTD and -$134B from February.

Restaurants – The Spending increase slowed to +$2.1B over July and sales were down $11.6B vs 2019. This is important as August is usually their biggest $ month of the year. January and February, normally the 2 slowest months, are on top in 2020. In February YTD sales were up $9B. Then came the forced closures. Re-openings began in May but ran into problems in July and August. Delivery/Pickup can’t make up the difference as spending is now down $106.7B YTD.

Automobile & Gas Stations – When you are staying home your car becomes less of a focus in your life. Auto Dealers, both new and used, began combating this attitude with some fantastic deals and a lot of advertising. Sales turned positive versus 2019 in June, grew strongly in July, then slowed a bit in August. Although sales are down $28.6B YTD, they are up $20B vs 2019 in the last 3 months. Gas Station $ales increased in May, June and July over the previous month, but fell in August – Down $56.6B YTD. People are still not driving as much, whether for commuting or road trips.

Relevant Retail – Less Auto, Gas and Restaurants – Many non-essential businesses began to shutter their doors in March but there was also a rash of binge/panic buying for “necessities” and a big lift in groceries as consumers focused on home cooking which drove spending up $19B. April brought a full month of closures and an end in binge buying, spending dropped $34B from March. In May, the overall market began to reopen so spending began to move in the right direction. In June and July the growth continued but it slowed in August. However, the monthly June>August $ are larger than all months in 2019 but December. The primary drivers have been Nonstore, Grocery and SuperCenters/Clubs & $ Stores along with an enhanced spring lift from the Hardware/Farm and Sporting Goods channels. The Relevant Retail group now has posted positive numbers versus last year and year to date for 4 consecutive months and is up $118B YTD (+4.9%) vs 2019. In July it was up +4.8%.

Now let’s look at what is happening in the individual retail channels across America. In August, consumer spending in the relevant retail market grew even more positive versus 2019. Let’s see where the $ came from. These groups are less defined than in the Final Monthly reports and we will look across the whole market, not just pet relevant outlets.

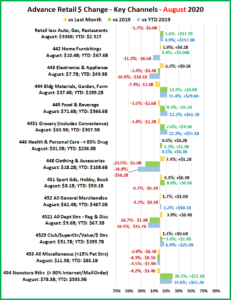
In July, 11 of 13 channels beat last month’s $. In August it was down to 7. In July, 10 channels beat July 2019. In August, this number was down to 7. However, in YTD numbers, 8 are now showing an increase as Health & Personal Care joined the group. The YTD decreases are coming from channels that are primarily nonessential businesses.

After a full month of stay at home and widespread closures there was a surge in May. Things truly opened up in June and July and sales continued to increase. In August they slowed slightly but YTD Relevant Retail Channels are up $117.9B vs 2019. The essential channels are responsible for the YTD lift vs 2019, primarily:

  • Nonstore Retailers – Even more consumers are online shopping.
  • Food & Beverage, especially Grocery– Restaurant $ are still down so consumers continue to eat & drink at home.
  • Bldg Materials/Garden/Farm – A bigger than usual Spring lift continues as consumers focus “on their home”.
  • SuperCtrs/Club/Value/$ Strs – Sales slowed in April but came back in May and continue to grow. This group turned the whole Gen Mdse channel positive. It clearly shows that value is still a consumer priority.

Regarding the Individual Large Channels

General Merchandise Stores – Regular Department stores are reopening which has cut the losses for total Department Stores as Discount Department stores continue to slowly fade. Club/SuperCtr/$ stores provided the big positive force. In April consumers dialed back their panic buying and spending on discretionary items was also down significantly. Since May we have seen consumer spending return to a more normal pattern in the big and small stores that promise value.

Food and Beverage, plus Health & Personal Care Stores – The Grocery segment is still driven by increased Food sales due to a slow restart by restaurants, up 7.6%, +$4.5B in August. Sales in the Health, Personal Care group were up vs 2019 in June July and August and finally turned positive YTD. Drug Store sales growth was a key factor.

Clothing and Accessories; Electronic & Appliances; Home Furnishings – In August, sales grew for the fourth consecutive month. Home Furnishing has even registered slight increases vs 2019 in July and August. However, all 3 channels are down double digit percentages in YTD sales. Clothing Stores are by far the worst performers. Even though August sales were up 7.4% over July they were still down 23.5% vs August 2019 and 34.9% YTD.

Building Material, Farm & Garden & Hardware – Sales fell again after peaking in June. However, this channel continues to benefit from consumers turning their focus to their home needs, including house and yard repair and improvements. This has accelerated and extended their Spring lift. Sales were up 11.9% vs August 2019 and up +$29.6B (+11.4%) YTD.

Sporting Goods, Hobby and Book Stores – Book and Hobby stores are open and sales in Sporting Goods stores have taken off as Consumers again sought outdoor recreation. Although sales fell again from their June peak, they were up 8% vs August 2019. YTD sales were down $3.4B in April. In August, this deficit had been cut to -$0.3B. If current trends continue, their YTD numbers could turn positive by September.

All Miscellaneous Stores – This group is mostly small to medium specialty stores – both chains and independents. Pet Stores are essential but most other stores are not, so closures hit this group particularly hard. Sales began to rebound in May and grew through July when they finally beat the monthly sales for 2019. In August sales dropped -2.9% vs July and -4.9% vs 2019. In February, this group was up $2.6B YTD. Through July,  they were down -$3.4B but moving in the right direction. That has stopped, at least temporarily as they are now down -$3.9B YTD. They have a long road ahead.

NonStore Retailers – 90% of the volume of this group comes from Internet/Mail Order/TV businesses. The COVID-19 crisis has only accelerated the ongoing movement to online retail. In February NonStore was up 8.6% YTD. In August, despite falling -4.2% from July, they are up 19.6%, +$97.2B YTD. Their increase is 82% of the total $ increase for Relevant Retail Channels. They are the clear leader and their performance far exceeds their 12.9% annual increase in 2019. Since much of their annual increase comes from holiday sales, 2020 looks to be another banner year for NonStore Retailers.

Note: Almost without exception, online sales by brick ‘n mortar retailers are recorded along with their store sales in their regular channel. Whether they are up or down, their online sales are included in the totals.

Recap – April and May saw the 2 biggest year over year monthly sales declines in history. Restaurants, Auto and Gas Stations increased sales from May through July. In August, only restaurants had an increase. The Auto segment is  showing positive monthly numbers vs 2019 but Restaurants and Gas Stations are still struggling. The Relevant Retail segment has been the only true positive. Although August sales are lower than July, monthly and YTD sales vs 2019 are up for 4 consecutive months. However, for many segments in this group there is still a long way to go. In July Total Retail was positive for the second consecutive month but it turned essentially flat in August. We saw a resurgence of the virus and retail restrictions were reimposed in many areas, which contributed to sales declining from July. This is going to be a long battle with no end in sight. We will continue to monitor the data and provide you with regular updates.




2019 Top 100 U.S. Retailers – Sales: $2.4 Trillion, Up 4.5%

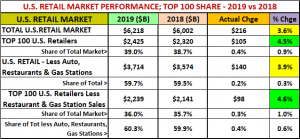
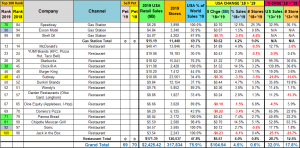
The U.S. Retail market reached $6.22 Trillion in 2019 from all channels – Auto Dealers, Supermarkets, Restaurants, Online retailers and even Pet Stores. This year’s increase of $216B (+3.6%) was 23.4% below last year’s increase of $282B. This breaks a string of steadily growing increases which began in 2015. One factor is that fuel prices stabilized, and Gas station revenue flattened out. (Data courtesy of the Census Bureau’s monthly retail trade report.)

In this report we will focus on the top 100 Retailers in the U.S. Market. These companies are the retail elite and account for 39% of the total market. The vast majority also stock and sell a lot of Pet Products. The retail market is constantly evolving which produces some turmoil – mergers, acquisitions, closures. The Top 100 are not immune and you will see changes in ranking but for first time since I began tracking in 2013, the list is the same as last year. The report does contain a lot of data, but we’ll break it up into smaller pieces to make it more digestible. All of the base data on the Top 100 comes from Kantar Research and was published by the National Retail Federation (NRF).

We’ll begin with an overview:

  • The total Retail Market grew $216B in 2019 (+3.6%). In 2018 it was +4.9% and in 2017, +4.3%. Although sales are still increasing, the growth rate slowed markedly in 2019.
    • The Top 100 grew $105B (+4.5%). This is less than last year’s +4.8% but significantly better than the total market.
    • The Top 100 generates $2.4 Trillion in revenue, 39.0% of the total U.S. retail market – slightly more than 2018.
  • Let’s make the data a bit more relevant. If you remove the revenue from Auto, Restaurant and Gas Stations, the “targeted” retail market for the Pet Industry is $3.7 Trillion – 59.7% of the total market. By the way, the slight gain in share is due to the flattening of Gas Station revenue.
    • If we also remove Restaurant & Gas Station $ from the Top 100, the remaining $2.2T is 36.0% of the total market.
    • … and 60.3% of the $3.7 Trillion “target” market.

The Top 100 generally outperforms the overall market. In 2019 the difference in performance was significant. The lift was driven by the Top 100 targeted retail group, less restaurants and gas stations. Remember, the Top 100 is really a contest. In a “normal” year companies drop out and new ones are added. This can be the result of mergers, acquisitions or simply surging or slumping sales. In 2019 there were no changes. However, here are some significant changes in rank:

  • You see the growing strength of the internet.
    • Wayfair moved up 12 spots from #77 to #65
  • Sales for these 2 companies continued their downhill slide.
    • Sears from #60 to #75
    • GameStop from #75 to #97

Now let’s start “drilling down” into the specifics of the 2019 Top 100. Here’s a summary of Regular and Online Retailers versus the bundled total for Restaurants & Gas Stations.

  • Regular & Online Retailers have 58.4% of the stores but 92.3% of the business, up slightly from 92.1% last year.
  • 93.0% of the increase came from Regular/online retailers. However, they are only up 4.6% versus +5.2% in 2018.
  • Restaurant sales were up $6.7B (+4.0%) in 2019 and Gas Stations turned positive, +0.62B (+4.2%).
  • The overall Store count was up +0.6% versus +0.8% in 2018. The lift was driven by Gas Stations (+9.0% due to an acquisition) and Restaurants (+0.8%). Regular retailers were basically flat (+0.03%).

Now that we have an overview of the Top 100, let’s take a look at the “targeted” retailer segment. There are 82 total companies. How many are buying and selling Pet Products? This will reinforce how Pets have become an integral part of the American Household and how fierce that the competition for the Pet Parents’ $ has become.

  • Of 82 companies, 69 are selling some mixture of Pet Products in stores and/or online. (down from 70 in 2018)
    • Their Total Retail Sales of all products is $2.09 Trillion which is…
      • 93.4% of the total business for Regular & Online Retailers in the Top 100
      • 33.6% of the Entire $6.22T U.S. Retail market – from 69 Companies who sell Pet Products.
  • 58 Cos. (up from 56), with $1.99T sales sell pet products off the retail shelf in 145,607 stores – 2600 more than 2018.
    • As you can see by the growth in both sales and store count, in store is still the best way to sell pet.
  • Online only is another story and the story gets complicated.
    • Amazon includes Whole Foods, which has stores so the Amazon $ are in the “Pet in Store” numbers.
    • 2 traditional Retailers who only sold Pet Products online converted to in store. The others who only sell pet online are losing market share. However, internet only retailers, like Wayfair are showing strong growth

Pet products are an integral part of the strongest retailers and are widespread across the entire U.S. marketplace. Of the Top 100, 145,600 stores carry at least some pet items at retail. There are thousands of additional “pet” outlets including 20,000 Grocery Stores, 10,000 Pet Stores, 16,000 Vet Clinics, 5,000 Pet Services businesses and more. Pet Products are on the shelf in over 200,000 U.S. brick ‘n mortar stores… plus the internet.

Before we analyze the whole list in greater detail let’s take a quick look at the Top 10 retailers in the U.S.

  • They did $1.33 Trillion in Sales
    • 54.8% of Top 100 $ales
    • 21.4% of Total U.S. Retail $
  • No change in rank (The group is unchanged since 2015)
  • Sales are up for all. Amazon leads the way…again.
  • Store count is down 500, (-1.4%)

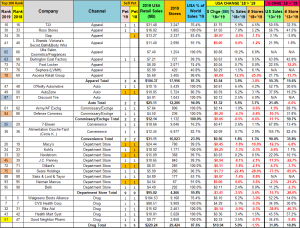
In the next section we will look at the detailed list of the top 100. We’ll sort it by retail channel with subtotals in key columns. We’ll then break it into smaller sections for comments.

I have not done a lot of highlighting however:

  • Pet Columns ’19 & ‘18 – a “1” with an orange highlight indicates that products are only sold online
  • Rank Columns – Change in rank from 2018: (Note: Acquisitions, Divestitures and Corporate Restructuring can cause big changes in ranking.)
    • Up 4-5 spots = Lt Blue; Up 6 or more = Green
    • Down 4-5 Spots = Yellow; Down 6 or more = Pink

Let’s get started. Remember online sales are included in the sales of all companies

Observations

  • After a number of acquisitions over several years, Drug is still in turmoil. Now we are seeing a growing number of closures of unproductive stores. However, sales growth remains strong.
  • The Traditional Department store segment continues its overall decline. Nordstrom stores were an exception with small gains in both sales and number of outlets for 2 straight years. Belk, a small chain, had the biggest $ales growth.
    • Sears sales and store count continue to plummet.
    • Saks sold Lord & Taylor in November 2019.
    • Although all carry a few pet items, often online, this channel has never fully embraced Pet Products.
  • Much of the growth in the Convenience Store Chains in the Top 100 in recent years has come through acquisitions. In 2019 there were no major acquisitions, but both major chains had small increases in $ales and stores.
  • Military Exchanges/Commissaries have added locations in recent years, which fueled the growth in sales. In 2017 they began reducing the number of Army/AF Exchanges. By 2019 this policy had spread to all military groups. 2019 sales were up in the Army/AF group which kept the overall drop in Military Exchg/Commissaries to -$0.06B (-0.5%).
  • Auto Parts Stores have become more stable in their growth. All chains increased their store count for the 2nd consecutive year. Overall, sales were up 5.5% in 2019 versus +2.5% in 2018.
  • Among Apparel retailers, the value outlets continue to show strong growth. All three of these chains carry pet products. The Gap sold Old Navy and no longer offers pet products. Ascena closed all Dress Barn stores (650).

Observations

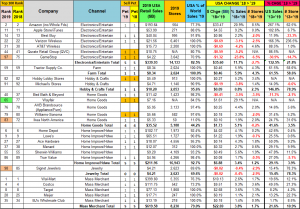
  • Amazon continues to drive the evolution of U.S. Retail. Sales are up 267% in 5 years. With the acquisition of Whole Foods in 2017 they also have a small but growing brick ‘n mortar presence in the market.
    • Of the three Phone People, only Apple had a strong year.
    • QVC lost ground in 2019. Sales were down -5.2% and they fell 3 spots to #44 in the ranking.
    • In 2017 a move to online gaming began. GameStop sales continue to fall, and closures grow. They fell 22 spots.
  • Signet Jewelry’s sales were down -0.04%. This was bad but better than -3.4% in 2018 and -3.9% in 2017.
  • Mass Merchants have 2 of the 4 largest volume retailers in America – Wal-Mart and Costco. Recently, these two companies have driven the growth in this channel. In 2019 Costco was strongest, but all companies increased sales.
    • Wal-Mart had a 2.6% increase in sales which is below last year’s 3.4%. Their business is mixed as SuperCenters continue to grow and their online sales are taking off. However, “regular” Discount Department Stores are losing market share. These trends impact the overall business in both Wal-Mart and Target.
    • Target posted a third consecutive sales increase in 2019, after 3 years of flat or declining revenue.
    • Costco continues its strong growth (+9.3%), building new stores and increasing sales – both in store and online.
    • BJ’s sales were up for the second consecutive year after a string of annual declines from 2013 to 2017.
    • Meijer had small growth in sales and store count in 2019. However, since 2013 they rank third overall in the percentage of sales increase and first in the percentage of store count increase.
  • All Home Improvement/Hardware companies increased sales, but overall, the growth slowed a bit, from +4.3% to +3.4%. Store count turned positive but Lowe’s and True Value continued closures. Home Depot (#6) and Lowes (#9) led the way in sales growth, supplying $5.24B (76%) of the $6.88B lift in the category.
  • Like 2018 all Home Goods Companies but Bed Bath & Beyond increased sales. They also drove down store count. Sales were up 5.1%, again driven by Wayfair, who entered the top 100 in 2018 and now ranks #65, up 12 from last year.
  • Tractor Supply was up 5.9% which is much less than 2018, +11.4%, and below their average growth rate of +8.3% since 2013.

Observations

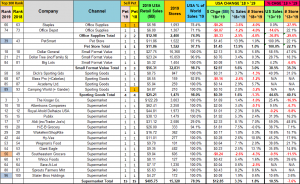
  • Supermarkets – $406B in Sales; 15 Companies; 15,000 stores; All Selling Pet Products. This is a very important group for the Pet Industry. With the highest frequency of consumer visits of any channel, the competition is fierce. The mergers and acquisitions have slowed. All companies but Southeastern showed increased sales. However, the strongest growth came from Sprouts (Natural) and Aldi (Value).
    • Southeastern Grocers filed for bankruptcy in 2018. Store closures and reduced sales continue.
  • Small Format Value Stores: Remember, this retail channel does more business than Traditional Department Stores.
    • As expected, Dollar General increased its lead over Dollar Tree in Sales, Sales Increase and Store Count.
    • Dollar Tree continues to increase sales, but its store count growth rate has slowed.
    • Big Lots had small growth in sales and stores after trending down in both areas in 2018.
    • This retail channel continues to grow in popularity. They are committed to Pet Products and their focus on value appeals to today’s ever more price conscious consumers. Plus, they are easy to shop.
  • Pet Stores – After the acquisition of Chewy in 2017, PetSmart’s sales registered a huge increase. In 2018, their sales were up +4.7%. In 2019, driven by the increasing popularity of the internet and Chewy, sales grew an impressive +14%. Petco qualified for the Top 100 for the first time in 2016. This was widely viewed as evidence of the strength of the U.S. Pet Industry. They hung on in 2017 but dropped out in 2018. It looks like they need a new formula, perhaps the internet, to make it back into the club.
  • Office Supply Stores – This channel continues its decline as Consumers are increasingly moving to online ordering.
  • Sporting Goods – Bass Pro (includes Cabela’s) continues to struggle but the other 3 companies eked out a small sales increase (2>3%) in 2019. Sales are up overall for the category but all companies, but Academy Sports are closing some underperforming stores.

Restaurants & Gas Stations and the Grand Total

Restaurant & Gas Station Observations

Although restaurants & gas stations aren’t relevant in terms of Pet Products Sales, they are relevant in our daily lives.

  • In 2019 although 4 companies had decreases, the overall sales for Restaurants in the Top 100 was up 4.0%%. This was better than the 3.6% increase in 2018 but less than the 4.6% increase in the total restaurant channel. McDonalds led the way in $, +$1.89B, but Chick-fil-A and Chipotle tied for the biggest percentage increase, +14.5%.
  • Falling gas prices in 2019 flattened the revenue growth of the total Gas Station Channel. The Top 100 Gas Station sales and stores are both up solely because Speedway acquired Andeavor Brands with their 3200+ outlets.

Wrapping it up!

The Top 100 became the Top 100 by producing big sales numbers and their performance, except for 2018, usually exceeds the overall market. In 2019 things returned to “normal”, +4.5% for the Top 100 vs +3.6% for Total Retail. The Top 100 Gas Stations, with a major acquisition, far exceeded the full market performance. However, top 100 restaurants underperformed to the overall Restaurant channel. If you just compare the “regular” retailers – both brick ‘n mortar and internet, then the Top 100 “won” big, +4.9% to +3.6% for the total “relevant” retail market.

Pet Products are an important part of the success of the Top 100. Sixty-nine companies on the list sell Pet Food and/or Supplies in 145,600 stores and/or online. Let’s take a closer look at the fifty-eight companies that stock pet products in their stores. This group generated $1.99T in total sales. How much was from pet? Let’s “Do the math”. If we take out the $11.9B done by PetSmart and the remaining companies generated only 1.5% of their sales from Pet, we’re looking at $29.7B in Pet Products sales from only 57 “non-pet” sources! (Note: The 1.5% share for Pet items is a low end estimate based on data from the U.S. Economic Census.) After a major adjustment, the APPA reported $56B in Pet Products sales for 2019. That means that 57 mass market retailers accounted for 53+% of all the Pet Products sold in the U.S. in 2019.

Pet Products are widespread in the retail marketplace but the $ are concentrated. Regardless of your position in the Pet Industry, monitoring the Top 100 group is important. This group also reflects the ongoing evolution in the retail market – the growing influence of the internet and the importance of Value. The group was relatively stable in 2019, with no changes from 2018. Competition is still intense, and the current COVID-19 crisis will likely cause turmoil in 2020.


Race and Ethnicity in the Pet Industry

The issue of racial and ethnic inequities is a hot topic right now and for good reason. Despite laws and constitutional amendments, major societal and economic disparities still exist between White, Not Hispanics and minorities in the United States. In this report we will start to look at the Pet industry in terms of Race and Ethnicity. The Data is taken from U.S. Government sources including the USBLS Consumer Expenditure Survey, the HUD American Housing Survey and the Census Bureau’s Annual Business Survey. All of the surveys are designed and conducted by personnel from the U.S. Census Bureau to insure that they accurately represent the situation in the total U.S.

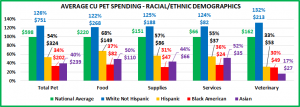
First let’s look at the racial/ethnic share of U.S. CU’s (financially independent Consumer Units – more defined than H/Hs) compared to their share of $78.6B in Total Pet Spending in 2018. Note: 260K CUs identify as both Black and Hispanic. This is only 0.2% of all U.S. CUs and about 1.5% of each group so it has little effect on the numbers. Their data appears to more closely match that from the Black group so whenever possible it is included with them. This is a first indication of the impact of Race in U.S. society. Race/Skin Color is more significant than ethnicity.

The White, not Hispanic group obviously takes a much bigger bite out of the Pet Spending Pie. Let’s see how their spending compares at the CU level for Total Pet and the 4 industry segments.

  • As you can see the White, not Hispanic group is the runaway winner in all segments.
  • Hispanics finish 2nd across the board and Black Americans are last overall and in all segments but Veterinary.
  • Although the disparity between White and Minority spending is still huge, it is lowest in the Pet Food Segment. This makes sense as it is the only true necessity in Pet Spending. You may not opt for Super Premium, but if you have a pet, you need to buy food.
  • We usually think of Veterinary spending as another pet necessity. However, strongly inflating prices in recent years have caused many pet parents to delay or cancel services. This has been especially impactful in many minority households. The result is that the biggest racial/ethnic disparity is in the Veterinary segment.

Race/Ethnicity is a big factor in Pet Spending. Let’s take a closer look at the other key drivers behind the numbers.

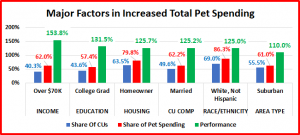
The chart below shows the key CU demographics that drive increased Pet Spending. Regarding Race/Ethnicity, people have no choice in what group they are included. In the other categories they can affect what segment that they are in. The graph shows the biggest spending group in the demographic category along with their Share of Pet spending and Share of CU’s. Then we divide share of spending by share of CUs. This “Performance” allows us to compare the relative importance of the demographic categories.

The chart shows only Total Pet Spending. However, while the performance numbers may vary slightly between segments, all of these demographic groups are important in all areas of Pet Spending.

  • We saw in our very first pie chart that race/ethnicity was important. In this chart we see that there are 4 other demographics that are equally or even more important in Pet Spending.
  • Higher Income is the single most important factor in all segments. It is at its lowest level in food but grows in importance as spending becomes more discretionary in Supplies and Services…or super expensive in Veterinary.
  • A College degree generally means higher income, but it also correlates with recognizing the “value” of super premium foods and regular Veterinary care.
  • Homeownership – Space that you own, and control has always led to increased Pet ownership and spending.
  • Married couples have made a commitment to each other. They are far more likely to commit to pets.
  • Suburbia – More space means more room for Pets. Pet ownership and spending is lowest in the Central Cities. As you move away from the city it grows, peaking in the areas under 2500 population – both suburban and rural.

Now let’s break down these key demographic factors in terms of Race/Ethnicity.

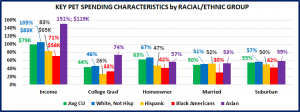
The chart shows the average number or share for U.S. CUs compared to that for each of the Racial/Ethnic Groups

  • One thing that stands out immediately is the status of Asian Americans. They are the leaders in 4 of the 5 categories, including the runaway winners in Income and Education. Yet, they have a very low level of Pet Spending. This goes contrary to all the national numbers. It also shows that there are “hidden” factors when it comes to our relationship with our pets. It suggests that there may be cultural differences in Asian American households so that pet ownership is substantially less likely than for other groups.

In light of this situation, we’ll focus on comparing White, not Hispanic to Hispanic and Black American CUs.

  • Income – The Whites are a clear winner – 28% more than Hispanics and 48% more than Black Americans.
  • College Education – This generally correlates with income, but the disparity is even wider. This category is the only one in which Blacks outperform Hispanics. Both groups have socio-economic inequities which keep their numbers down. However, there is a key early difference. 87% of Blacks graduate from High School compared to 71% of Hispanics. The Hispanic numbers are driven down by foreign born individuals with a 55% HS graduation rate. Blacks benefit from the availability of Historically Black Colleges and Universities which produce 20% of all Black College Grads and also the opportunity provided by athletics. They receive 23% of all college athletic scholarships and 77% graduate.
  • Homeownership – Whites again lead the way, with a disparity even greater than income. We should also note that this is the only category in which Whites beat Asian American CUs.
  • Marriage – This is the demographic in which Black Americans are most different from the other groups. Only 30% of Black American CUs are Married Couples. This is 40% less than all other groups of which 51 to 53% are Married Couples – with or without children.
  • Suburban – Black Americans tend to live in more urban areas. They are the only group in which less than 50% of CUs live in the Suburbs. We should also note that they also live in the suburban areas with higher population.

In terms of the Best Spending Demographics, you can see why White spending far exceeds Hispanics and especially Black Americans. Now, let’s take a look at some of the worst spending groups in terms of Race and Ethnicity.

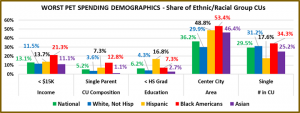
These 5 groups are the worst performing in terms of pet spending in their category.

  • Under $15K Income – 1 of every 5 Black American CUs makes under $15K – 63% higher than the National Avg.
  • Single Parents – These CUs are generally under tremendous financial pressure. You can see that they are more likely to be Hispanic and especially likely to be Black American. In fact, 32% of all Single Parent CUs are Black American. That is stunning considering that Black Americans only make up 12.9% of total U.S. CUs.
  • Less than High School Diploma – You can see where the educational disparity begins and that it goes much deeper than a college degree. 1 of every 6 Hispanic CUs has no member that completed High School.
  • Center City – Black Americans are the only group with 50+% living in Center City. Hispanics and Asians are relatively evenly divided between the Suburbs and the City, but Whites tend more toward suburban/rural living.
  • Single – In Pet Spending it just takes 2. Obviously, being single is not popular with Hispanics. Black Americans lead the way, but Whites are not far behind, which ultimately reduces the overall Pet $pending for both groups.
  • Note: Single Parents and Singles are 2 of the lowest Pet Spending Groups. They make up 47.1% of Black CUs.

We saw that Black Americans had the lowest share of all the biggest Pet Spending groups except College Degrees, where they were next to last. Now we see that they have the highest share of all the lowest Pet Spending groups but education, where they again finish next to last. This is an overwhelming combination and provides specific reasons for their low level of Pet Spending.

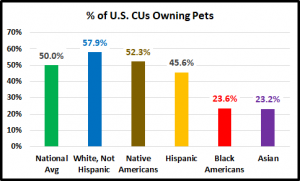
When we look at the varied rates of Pet Spending, one obvious question comes to the forefront. What is the percentage of Pet Ownership? For an unbiased answer we again turn to a Government resource – HUD, The Department of Housing and Urban Development. With the help of the Census Bureau, every two years HUD conducts the American Housing Survey to measure the current state of housing in the U.S. In the 2017 Survey of over 70,000 H/Hs they included a specific section on Disaster Preparedness to assess the state of readiness across the U.S. in the event of a disaster – natural or manmade. A series of questions was both relevant and significant for the Pet Industry. They asked if respondents had a pet and if so, would they need assistance in evacuating the animal in the event of a disaster? This is obviously relevant to the industry but also significant in that the U.S. Government officially recognized that our Pet Children are an integral part of U.S. households. Their only reason for asking the question was to help insure that communities are adequately prepared to protect and save all members of their community – people and pets.

The next graph shows the results of the question regarding pet ownership by racial/ethnic groups. There is a bonus as they also include Native Americans as a separate group. The numbers are lower than what you have seen from industry sources but don’t be distracted. The key is to focus on the relative differences between groups.

  • The first thing that we note is that the pet ownership rates closely reflect the relative pattern of pet spending rates for these groups.
  • The high rate for Native Americans shows that Pet Parenting is truly an American tradition.
  • Asians have the lowest rate of ownership which explains their low pet spending, despite the fact that they are leader in many key demographic categories which directly relate to increased Pet Spending.
  • Whites have more pets, but they also make a lot more money than Hispanics or Blacks. This is the fundamental basis for the pet spending difference between these 3 groups which is only magnified as incomes grow and the White households’ share of higher income groups becomes even larger.

From all this data, we see that there is a definite Racial/Ethnic disparity in pet ownership and pet spending. This is not the fault of the Industry. It is just a reflection of the extreme inequality in the current American Society. Black Americans are at the bottom of the ladder, with no clear route to the top without major societal changes.

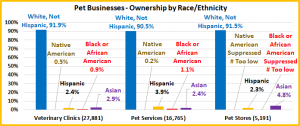
So far, we have looked at the industry from the consumers’ perspective. What is the situation when we start looking up the distribution chain? Are Blacks, Hispanics and Asians represented in participating Pet Industry Companies. I’m not aware of any data that measures the racial/ethnic breakdown of Pet Company employees. However, the Annual Business Survey from the Census Bureau does track ownership by race/ethnicity for businesses with employees that qualify for this measurement. Larger Companies generally don’t fit the parameters but there are still thousands of small businesses that do. Let’s look at a few business types that are directly tied to the Pet Industry. This data is from 2017.

The chart below shows the percentage of Racial/Ethnic ownership in 3 Pet Business types and the number that qualify.

  • Veterinary Clinics – 27,881
  • Pet Services Outlets – 16,765
  • Pet Stores – 5191

Note: We were once again able to further define the data to include Native Americans. FYI – In 2017 they accounted for about 0.9% of U.S. CUs.  The numbers for each group will not total 100% because the owners of a small percentage of businesses are from multiple racial/ethnic groups.

Note: Other Racial/Ethnic shares of U.S. CU’s:

White: 69.0%

Hispanic: 13.4%

Black: 12.9%

Asian: 4.7%

  • Over 90% of all these businesses types are owned by White, Not Hispanics. That is a more dominant situation than Pet Spending, where their share was 86.3%.
  • Veterinary Clinics – You can see that a huge number of Veterinary Clinics are small businesses and can be classified by the race/ethnicity of the owner. Native Americans make their best showing in this category. About 92% are white while only 0.9% are owned by Black Americans.
  • Pet Services – There are also a lot of these small businesses. Stereotypically, Hispanics and Blacks are more associated with Services work. That may be true in the Pet Industry as both have their highest ownership share.
  • Pet Stores – Over 5 thousand pet store owners can be classified by race or ethnicity. The share of Asian owned pet stores actually exceeds their share of U.S. CU’s, a singular situation for any minority. Hispanics are seriously underrepresented, but the biggest concern is in regard to Black Americans. The number of stores is so small that the Census Bureau doesn’t release it because looking at metro area data could reveal the sales info for a specific business. Native American data is also suppressed but they don’t account for 12.9% of U.S. CUs, like Blacks.
  • Other Pet Businesses – In most cases the NAICS code doesn’t specifically define “Pet” businesses. However, data is available for Dog/Cat Food Manufacturers. There are 237 that can be classified. 223 (94%) are White-owned. Minorities own 14 businesses but again the number is so small that all Racial/Ethnic specifics are suppressed.

The Pet Industry is not the cause of the racial/ethnic inequality in the U.S but it certainly reflects the situation, especially for Black Americans. Let’s start with consumers. Due to socio-economic factors, Black Americans have an incredibly low level of pet ownership. This obviously suppresses spending, but it could even be a matter of health. HABRI is constantly offering evidence of the health benefits of Pets. The recent COVID-19 crisis has revealed that the overall health of Black Americans is the worst of any group. Programs should be developed to encourage and assist in increasing the level of pet ownership by Black American Households.

In terms of Industry Participants, minority representation is even more limited. There are no Blacks on any of the 3 Industry Organization Boards. That’s to be expected. You have to first be a member before you can be on the Board. Programs should be developed to encourage and aid minority Pet businesses of all kinds. Existing businesses should also take a look at their current staff and actively work for more diversity.

To solve a problem, you must first recognize its existence. Then take action to solve it. Racial/Ethnic inequality is definitely a problem in the Pet Industry. That means that it is also an opportunity. Let’s get to work!


Retail Channel Monthly $ Update – June Final & July Advance

Time for our monthly update on U.S. retail sales by channel. The current COVID-19 crisis has caused turmoil in the Retail Marketplace. Consumer spending behavior has changed and continues to evolve. In this report we will track the changes and migration between channels. We will do that with data from two reports provided by the U.S. Census Bureau.

The Reports are the Monthly Retail Sales Report and the Advance Retail Sales Report. Both are derived from sales data gathered from retailers across the U.S. and are published monthly at the same time. The Advance Report has a smaller sample size so it can be published quickly – approximately 2 weeks after month end. The Monthly Final Report includes data from all respondents, so it takes longer to compile the data – about 6 weeks. Although the sample size for the Advance report is smaller, the results over the years have proven it to be statistically accurate with the final monthly reports. The biggest difference is that the full sample in the Final report allows us to “drill” a little deeper into the retail channels.

This means to get the full picture in our monthly channel update we need to look at the latest release of both reports. We will begin with the Final Retail Report from June and then move to the Advance Retail Report for July. This will also allow us to better track the consumers’ evolving spending behavior in terms of channel migration.

Both reports include the following:

  • Total Retail, Restaurants, Auto, Gas Stations and Relevant Retail (removing Restaurants, Auto and Gas)
  • Individual Channel Data – This will be more detailed in the “Final” reports and we fill focus on Pet Relevant Channels

The information will be presented in detailed charts to facilitate visual comparison between groups/channels of:

  • Current Month change – % & $ vs previous month
  • Current Month change – % & $ vs same month in 2019
  • Current YTD change – % & $ vs 2019
  • Monthly and Year To Date $ will also be shown for each group/channel

We’ll start with the June Final report. The retail market hit bottom in April then began a slow recovery which continued in June. First, we will look at some major retail groups. (Note: The Data in all graphs is Actual, Not Seasonally Adjusted)

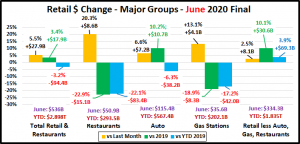
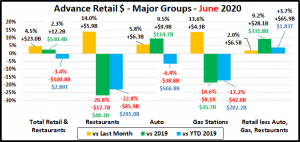
The final total is $6B more than the Advance report projected a month ago. Relevant Retail and Restaurants were both $2.5B more than expected and the Auto segment was $1B better. Gas Stations’ $ were the same. $ales were up vs May across the board. Driven by Relevant Retail and Auto, Total monthly sales were also up vs 2019.

The Spring Lift is usually winding down in June but the COVID crisis has pushed the Spring timing back. Things began to open up in May and this continued in June. However, all but Relevant Retail were down YTD vs 2019.

Now, let’s see how some Key Pet Relevant channels were doing in June.

  • Overall – While sales in 6 of 11 groups were down vs May, 9 of 11 showed increases vs June 2019.
  • Building Material Stores – This group usually has their biggest annual lift in Spring. This is unchanged and even amplified. While Farm Stores sales were down vs May, they have spectacular increases vs 2019. Although Sporting Goods stores are not included in this group, they have a similar Spring lift pattern. Their sales took off in May and continued to grow spectacularly in June, turning positive for YTD vs 2019.
  • Food & Drug – Supermarket sales are down slightly from May but show strong growth vs 2019. After 2 months of slowed sales Drug Stores came back strong in June and are again positive across the board.
  • General Merchandise Stores – Sales in $ Stores and Clubs/SuperCtrs slowed down vs May but are still strong vs 2019. $ Stores are showing exceptional strength. Discount Department store sales were generally slowing before the pandemic. This trend has continued and accelerated slightly.
  • Office, Gift and Souvenir Stores – In May and June they began to slowly re-open, but this group was hit hard.
  • Internet/Mail Order – The pandemic has accelerated this channel’s growth vs 2019. This will likely continue as the crisis has introduced many new consumers to online shopping and the behavior is likely to become habitual.
  • A/O Miscellaneous – This is a group of small to midsized specialty retailers – chains and independents. It includes Florists, Art Stores and Pet Stores. Pet Stores account for 22 to 24% of total sales. Pet Stores were usually deemed essential, but most stores were not. The others began reopening in May and the number grew in June which produced an increase vs 2019. Strong early year sales and this rebound pushed YTD sales up 7.9%.

May was the beginning of a slow recovery which continued in June as even more businesses began to re-open. The Relevant Retail Segment turned positive in all measurements in May and stayed that way in June. Although many segments are now contributing, the Internet, Supermarkets, SuperCtrs/Clubs/$ Stores and Hdwe/Farm are the key drivers. Let’s see how the situation is progressing. Here are the Advance numbers for July.

April and May were the 2 biggest spending drops in history. In June, monthly sales turned positive for the first time since February as Total Retail was up $18B vs 2019. In July the recovery continued, +$20B but we’re still down -$74B YTD.

Total Retail – Total Retail spending increased $20.4B, +3.8% vs 2019, slightly more than the +3.4% in June. It’s hard to remember, but in February 2020 sales were up $60B, +6.6% YTD versus 2019. Then came COVID-19. Hopefully, we hit bottom at -$112B in May. We’re moving in the right direction but are still down -$74B YTD and -$134B from February.

Restaurants – Due to the reimplementation of closures in some areas, the Spending increase slowed to +$3.5B over June and sales were down $11.5B vs 2019. In February sales were up $9B. Then came the forced closures. Re-openings began in May but ran into problems in July.  Delivery/Pickup can’t make up the difference as spending is down $95B YTD.

Automobile & Gas Stations – When you are staying home your car becomes less of a focus in your life. Auto Dealers, both new and used, began combating this attitude with some fantastic deals and a lot of advertising. They started winning this battle in June as monthly sales turned positive versus 2019. Although sales are down $31B YTD, they are up $18B vs 2019 in the last 2 months. Gas Station sales increased in May, June and July over the previous month, but they are still down -$49B YTD. People are still not driving as much, whether for commuting or road trips.

Relevant Retail – Less Auto, Gas and Restaurants – Many non-essential businesses began to shutter their doors in March but there was also a rash of binge/panic buying for “necessities” and a big lift in groceries as consumers focused on home cooking which drove spending up $19B. April brought a full month of closures and an end in binge buying, spending dropped $34B from March. In May, the overall market began to reopen so spending began to move in the right direction. In June and now July the growth continued. Although openings became more widespread in June and July the primary drivers have been Nonstore, Grocery and SuperCenters/Clubs & $ Stores along with an enhanced spring lift from the Hardware/Farm and Sporting Goods channels. As a result, the Relevant Retail group now has posted positive numbers versus last month, last year and year to date for 3 consecutive months and is up $100B YTD vs 2019.

Now let’s look at what is happening in the individual retail channels across America. In July, consumer spending in the relevant retail market grew even more positive versus 2019. Let’s see where the $ came from. These groups are less defined than in the Final Monthly reports and we will look across the whole market, not just pet relevant outlets.

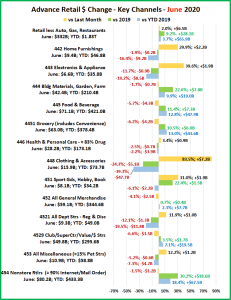
The increases were widespread – 11 of 13 channels beat June $ and 10 of 13 channels beat July 2019. However, in YTD numbers, only 7 are showing an increase. The YTD decreases are coming from channels of nonessential businesses.

Observations

 After a full month of stay at home and widespread closures there was a surge in May. Things have truly opened up in June and July and sales continue to increase. However, the essential channels are responsible for the lift vs 2019.

  • Nonstore Retailers – Even more consumers are online shopping.
  • Food & Beverage, especially Grocery– Restaurant $ are still down so consumers continue to eat & drink at home.
  • Sporting Gds/Hobby/Books – Stores re-opened and consumers began to return to outside recreational activities.
  • Bldg Materials/Garden/Farm – A bigger than usual Spring lift continues as consumers focus “on their home”.
  • SuperCtrs/Club/Value/$ Strs – Sales slowed in April but came back in May and continue to grow. This group turned the whole Gen Mdse channel positive. It clearly shows that value is still a consumer priority.

Regarding the Individual Large Channels

General Merchandise Stores – Regular Department stores are reopening which has cut the losses for total Department Stores as Discount Department stores continue to slowly fade. Club/SuperCtr/$ stores provided the big positive force. In April consumers dialed back their panic buying and spending on discretionary items was also down significantly. Since May we have seen consumer spending return to a more normal pattern in the big and small stores that promise value.

Food and Beverage, plus Health & Personal Care Stores – The Grocery segment is still driven by increased Food sales due to a slow restart by restaurants, up 12.3%, +$7.2B. Sales in the Health, Personal Care group are up vs June and vs July 2019 but remain down YTD. The situation is improving with more reopenings and Drug Store sales growing again.

Clothing and Accessories; Electronic & Appliances; Home Furnishings – As reopening became even more widespread in July, sales grew for the third consecutive month. Home Furnishing even registered a slight increase vs July 2019. However, all 3 channels are down double digit percentages in YTD sales. Clothing Stores are by far the worst performers as sales were down 20% vs July 2019 and 36% YTD.

Building Material, Farm & Garden & Hardware – Sales fell slightly from June, -6.5%. However, this channel continues to benefit from consumers turning their focus to their home needs, including house and yard repair and improvements. This has accelerated and extended their Spring lift. Sales were up 16% vs July 2019 and up +25.5B (+11.3%) YTD.

Sporting Goods, Hobby and Book Stores – Book and Hobby stores are open and sales in Sporting Goods stores have taken off as Consumers again sought outdoor recreation. Although sales fell slightly from June, -3.9% they were up 19% vs July 2019. YTD sales were down $3.4B in April. In July this deficit had been cut to -$0.9B. If current trends continue through the summer, their YTD numbers could turn positive by September or maybe even August.

All Miscellaneous Stores – This group is mostly small to medium specialty stores – both chains and independents. Pet Stores are essential but most other stores are not, so closures hit this group particularly hard. Sales began to rebound in May and continued to grow through July when they finally beat the monthly sales for 2019. In February they were up $2.6B YTD. Through July,  they are down -$3.1B. They are moving in the right direction but still have a long road ahead.

NonStore Retailers – 90% of the volume of this group comes from Internet/Mail Order/TV businesses. The COVID-19 crisis has only accelerated the ongoing movement to online retail. In February NonStore was up 8.6% YTD. In July, they are up 19.8%, +$85.5B. Their increase is 85% of the total $ increase for all Relevant Retail Channels. They are the undisputed leader and their performance far exceeds their 12.9% annual increase in 2019. Since much of their annual increase comes from holiday sales, 2020 is on track to be a banner year for NonStore Retailers.

Note: Almost without exception, online sales by brick ‘n mortar retailers are recorded along with their store sales in their regular channel. Whether they are up or down, their online sales are included in the totals.

Recap – April and May saw the 2 biggest year over year monthly sales declines in history. Restaurants, Auto and Gas Stations increased sales from May through July. The Auto segment is showing positive monthly numbers vs 2019 but Restaurants and Gas Stations are still struggling. The Relevant Retail segment has provided the only true positive as sales are up in all measurements for 3 consecutive months. However, for many segments in this group there is still a long way to go. In July Total Retail was positive for the second consecutive month and Relevant Retail appeared to be moving towards a more routine pattern – a new normal. We have recently seen a resurgence of the virus and retail restrictions are being reimposed in many areas. The impact on retail in July was negligible but this is going to be a long battle with no end in sight. We will continue to monitor the data and provide you with regular updates as the situation evolves.


Pet Products Spending by Generation: Mid-Year 2019 Update

Pet Products spending totaled $46.61B for the 12-month period ending 6/30/19. This was a decrease of $4.56B (-8.9%). Total U.S. spending for the period totaled $8.23 Trillion, up $280B (+3.5%). Big decreases in Food, due to the FDA grain free warning and Supplies, due to tariffs sent Pet Products Spending in the opposite direction from Total U.S. spending.

In this report we will update Pet Products Spending for arguably the most popular demographic measurement – by Generation. Baby Boomers built the Pet Industry and they still have the biggest share of Total Pet and Pet Products $. However, in 2018 Gen Xers took the lead in pet spending per household, but the group that gets the most “press” is the Millennials. They are the future. Are they stepping up in life and in spending?

We also have some special news this year – both good and bad. The good news is that Gen Z, born 1997 and later, now have enough CUs for a reliable sample. We will start reporting their CU characteristics and spending separately from Millennials in this report. We won’t be able to compare any data to track their movement for another year. When appropriate, we will consolidate the numbers from all CUs born in 1981 or after so we can compare it to last year. The bad news is that the Greatest Generation, born before 1928, is now too small to accurately measure. Their spending will now be included with the Silent Generation. The new group will be everyone born before 1946. Now, let’s get started. As always, the numbers come from or are calculated from data in the US BLS Consumer Expenditure Survey.

First, let’s define each generation and look side by side at their share of Consumer Units (H/H’s) and Total Spending.

Generations Defined

Gen Z: Born 1997 and after

In 2019 age 18 to 22

Millennials: Born 1981 to 1996

In 2019 age 23 to 38

Gen X: Born 1965 to 1980

In 2019 age 39 to 54

Boomers: Born 1946 to 1964

In 2019 age 55 to 73

Silent/Greatest: Born  <1946

In 2019 age over 73

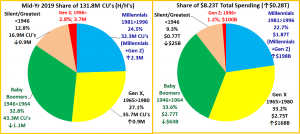
  • Boomers are still the largest group with 43.3M CUs (32.8%) and the biggest spenders – $2.8T. They are losing ground in both areas. However, their spending performance in relation to their share of CUs is still 102%.
  • Gen X is ranked second in size and spending and both are growing. Their spending performance is 123%, by far the best of any group. They are likely to take the lead in total spending by the end of 2019.
  • Millennials are the largest generation in sheer numbers, but third in CUs. More are developing financial independence and their spending reached $1.87T – 3rd place. However, their spending performance is only 93%.
  • The oldest Silent/Greatest generations are losing CUs and their overall spending was down $25B.
  • Gen Z is the newest generation, so their low numbers are to be expected. Avg CU age is just 19.7 yrs.

Age certainly affects behavior but there are other CU characteristics, like income, family situation and home ownership that make a difference both in Total Spending and in Pet Spending. Let’s look at some of these key differences.

  • Singles had a big year, but 2+ people CUs account for 77.7% of all Pet Products Spending. (down from 84.8% in 2018)
  • The size of the CU and number of children is all about Family responsibility and all the financial pressures that this generates. The CU size overall is unchanged from Mid-2018 and still peaks with the Gen Xers. However, the Boomers decreased by 0.1 person. Perhaps, their Millennial kids are finally moving out?
  • Married couples with children under 18 are an important group with 22.6% of all CUs. They more than earn their share with 27.7% of all Pet Products spending and 29.2% of Supplies Spending. However, as the number of children grows, the increased financial responsibility can slow Pet Spending.
  • Boomers still average 2+ people in the CU. However, they are much less likely to have children <18 at home. As their human children leave home, they turn their attention and spending to their Pet Children who are still with them.
  • Pet Products spending is also tied to the number of earners in a CU. 2+ Earner CUs account for 41% of the total but they spend 51% of Pet Products $. Most “earning” is being done by Gen Xers, Millennials and Boomers, with Gen Xers at the top, as to be expected. Boomers are down 0.1 as more move into retirement, but Gen Z is stepping in.
  • Homeownership – Owning and controlling your own space has always been a key to increased Pet Ownership and spending. Homeowners currently account for 78.1% of all Pet Products Spending, which was driven down from 80.2% largely by the performance of Homeowners w/o Mtges. Renters spent slightly more overall, +0.6% but all groups spent less on Pet Products in the 1st half of 2019.
    • Nationally, Homeownership moved up slightly to 63.47%. Gen Xers moved up from 62% to 65%, beating the national average for the first time. As you can see Homeownership increases regularly with age.
    • The Millennials are now up to 41% but they are still 15% below the rate for the older generations when they were the same age.
    • Boomers dropped from 78% to 76% and Gen Z got started with 10% of CUs owning a home.

Next, we’ll compare the Generations to the National Avg. :

In Income, Spending, Pet Products Spending and Pet Products Share of Total $pending

CU Avg Income – $81.220; Total Spending – $62.438; Pet Products Spending – $353.94; Pet Products Share – 0.57%

  • Income – The 39>54-year-old Gen Xers are the leaders. The Boomers earn over 20% less and their income will continue to fall as they age. Millennials income is still 10% less than the Boomers and only 70% of the Gen Xers. The big drops are at both ends of the age range with the retired Silent/Greatest and the “just getting started” Gen Zers.
  • Total Spending – The Gen Xers make the most and spend the most, but their spending is not out of line with their income. Boomers also spend more than the average, but their income can still support it. The Millennials’ spending is also very much in line with their income as they approach the national average in both areas. Spending doesn’t fall as fast as income with the older generations. In fact, they are actually deficit spending in relation to their after tax income. Gen Z is in an even worse deficit situation as they spend 25% more than they make.
  • Avg CU Pet Products Spending – Gen X briefly took over the top spot at the end of 2018 but lost it to the Boomers because of a big drop in Supplies spending in the 1st half of 2019. Only Boomers and Gen X spend more than the national average. The Millennials are closing the gap but still trail the Gen Xers and Boomers by over 20%. The oldest CUs spend about half as much per CU on Pet Products as the top 2. The Gen Zers are just getting started with Pet Parenting so they spend only about ¼ of the national average.
  • Pet Products Share of Total Spending – One measure of the level of commitment to their Pets.
    • The Pet Products share of total spending fell to 0.57% as Pet Products CU spending fell 9.7% while total spending was up 2.7%. Only Boomers exceed the National Average but everyone over 23 years of age is at least 81% of the national average.
    • All groups decreased their pet products spending in terms of its share of their overall spending. However, the biggest drops came from the older groups, especially the Boomers.
    • Millennials are in 3rd place in both income and total spending but moved up to 2nd place in Pet Products Spending share. They are committed to their pet children.
    • Much of the drop for the Oldest Americans came as a result of bundling the Greatest with the Silent Generation. The 74 to 91-year-old Silents still have a strong commitment to their pet companions.

Now let’s look at Pet Products $ spent by Generation and their share of the total.

  • In terms of 2019 Mid-Yr Performance, the older groups were down, and the younger groups were up, especially <39.
  • Boomers still have the largest share, but Millennial/Gen Z gained the most, moving up to 23.1% from 19.4% in 2018.
  • Overall – Ave CU spent $353.94 (-$37.96); 2019 Mid-Yr Pet Products spending = $46.61B, Down $4.56B (-8.9%)
    • There were big drops in both halves. July>Dec 18, Down $2.52B; Jan>Jun 2019, Down $2.04B
  • Boomers – Ave CU spent $416.00 (-$86.14); 2019 Mid-Yr Pet Products spending = $18.03B, Down $4.44B (-19.8%)
    • Huge drop in 2018 and continued down in 2019. – Jul>Dec 18, Down $3.82B; Jan>Jun 19, Down $0.62B.
  • Gen X – Ave CU spent $406.63 (-$4.41); 2019 Mid-Yr Pet Products Spending = $14.40B, Up $0.01B (+0.07%)
    • Up in 2018, down in 2019. Only 2.6% more CUs “saved” them.– Jul>Dec 18, Up $0.75B; Jan>Jun 19, Down $0.74B
  • Millennial/Gen Z– Ave CU spent $295.22 (-$3.15); 2019 Mid-Yr Pet Products Spending = $10.77B, $0.82B (+8.3%)
    • Due to 6.5% more CUs, they had an increase in both halves. – Jul>Dec 18, Up $0.77B; Jan>Jun 19, Up $1.23B.
      • Millennials Only – Ave CU spent $319.56; 2019 Mid-Yr Pet Products Spending = $10.44B
      • Gen Z Only – Ave CU spent $49.08; 2019 Mid-Yr Pet Products Spending = $0.33B
  • Silent/Greatest – Ave CU spent $207.36 (-$42.99); 2019 Mid-Yr Pet Products Spending = $3.42B, ↓$0.95B (-21.8%)
    • Down in both halves but the big drop came in 2019. Jul>Dec 18, Down $0.13B; Jan>Jun 19, Down $0.82B.

All Generations spent less per CU. The biggest drops came from the oldest groups who spent much less and decreased in numbers. The increase from younger groups was due to more CUs. Let’s look at individual segments. First, Pet Food

  • The impact of the FDA grain free warning hit the Boomers…hard. The response in the oldest group was delayed.
  • The younger groups grew in both halves – Gen X won the 2nd half of 2018 – Millennials/GenZ won the 1st half of 2019
  • Overall – Ave Cu spent $219.54 (-$20.90); 2019 Mid-Yr Food spending = $28.71B, Down $2.46B (-7.8%)
    • After a big drop in the 2nd half of 2018, spending turned up… barely. Jul>Dec 18 (-$2.51B); Jan>Jun 19 (+$0.05B)
  • Boomers – Ave CU spent $274.51 (-$58.79); 2019 Mid-Yr Food spending = $11.91B, Down $3.05B (-20.4%)
    • July>Dec 18 (-3.18B) – In reaction to FDA warning. Then things calm down. Jan>Jun 2019 (+$0.13B)
  • Gen X – Ave CU spent $237.87 (+$15.42); 2019 Mid-Yr Food spending = $8.38B, Up $0.55B (+7.0%)
    • Another reaction to the FDA warning – buy even more costly food. Jul>Dec 18 (+$0.49B); In Jan>Jun 19 (+0.06B)
  • Millennial/Gen Z – Ave CU spent $177.13 (-$0.03); 2019 Mid-Yr Food Spending = $6.52B, Up $0.67B (+11.4%)
    • Jul>Dec 18 (+$0.19B); Jan>Jun 19 (+$0.48B). More CUs generate more $pending.
      • Millennial Only – Ave CU spent $192.35; 2019 Mid-Yr Pet Food Spending = $6.33B
      • Gen Z Only – Ave CU spent $49.08; 2019 Mid-Yr Pet Food Spending = $0.19B
  • Silent/Greatest – Ave CU spent $128.95 (-28.46); 2018 Mid-Yr Food spending = $2.09B, Down $0.62B (-22.9%)
    • It appears that they reacted to the FDA warning, but not until 2019. Jul>Dec 18 (-0.01B); Jan>Jun 19 (-$0.61B)

Only Gen X CUs spent more on food. The Boomers and oldest group were negatively impacted by the FDA warning. The younger groups increased spending, but the Millennial/Gen Z group did it because of more CUs.  Now, Supplies.

  • Boomers still have the largest share but Supplies spending skews younger – Gen X, Millennials & Gen Z control 58%.
  • The spending drop skews older and is widespread, including all groups older than Millennials.
  • Overall – Ave CU spent $134.40 (-$17.06); 2019 Mid-Yr Supplies spending = $17.71B, Down $2.10B (-10.6%)
    • Supplies spending grew for 24 months. That ended with new tariffs. Jul>Dec 18 (-$0.01B); Jan>Jun 19 (-$2.09B)
  • Baby Boomers – Ave CU spent $141.49 (-$16.60); 2019 Mid-Yr Supplies spending = $6.12B, Down $1.38B (-18.4%)
    • The drop was strong and consistent over both halves. Jul>Dec 18 (-$0.64B); Jan>Jun 19 (-$0.74B)
  • Gen X – Ave CU spent $168.76 (-$19.83); 2019 Mid-Yr Supplies spending = $6.56B, Down $0.54B (-8.2%)
    • Increased “tariff” prices affects even the wealthiest group. Jul>Dec 2018 (+$0.26B); Jan>Jun 19 (-$0.80B)
  • Millennials/Gen Z – Ave CU spent $118.09 (-$3.12); 2019 Mid-Yr Supplies spending = $4.25B, Up $0.16B (+3.9%)
    • Overall lift from more CUs. Tariffs “hit home” in the 1st half of 2019. Jul>Dec 18 (+$0.48B); Jan>Jun 19 (-$0.32B)
      • Millennials Only – Ave CU spent $127.21; 2019 Mid-Yr Supplies spending = $4.11B
      • Gen Z Only – Ave CU spent $37.94; 2019 Mid-Yr Supplies spending = $0.14B
  • Silent/Greatest – Ave CU spent $78.41 (-14.53); 2019 Mid-Yr Supplies spending = $1.32B, Down $0.34B (-20.0%)
    • The drop began in the 2nd half of 2018 then accelerated in 2019. Jul>Dec 18 (-$0.12B); Jan>Jun 19 (-$0.22B).

In the 2nd half of 2016, Supplies began 24 months of growth which resulted in a $5B (33%) spending increase. Gen X and Boomers fueled 73% of the growth but the Millennials also stepped up in the last 12 months with a $0.94B increase. A big factor in this lift was pricing. Prices deflated for 22 months so Supplies were a great value for everyone. That changed in 2018 as new tariffs were added, effective in September. In anticipation, prices began moving up in the Spring. Supplies spending flattened in the 2nd half of 2018 then plummeted $2B in the 1st half of 2019. The price increase affected all generations as CU spending on Supplies fell for every group.

In the final chart we will compare each generation’s share of spending on Total Products, Pet Food and Pet Supplies to their share of CU’s and see “Who is earning their share?” Then we will review their actual performance numbers.

Performance = Share of Spending/Share of CU’s;    100+% indicates you are “earning your share”

If a share of market is outlined, then performance exceeds 100%.    

  • Silent/Greatest Generation Performance – Pet Products: 57.1%; Pet Food:56.4%;Pet Supplies:58.3%
    • This group is all over 73 yrs old. Pet ownership is more difficult after age 75 and this is reflected in the low share of Pet Products spending. However, the desire and the commitment are still there. Their performance is very consistent between Food and Supplies, but both will drop as they age.
  • Baby Boomers Performance – Pet Products: 117.8%;Pet Food: 125.5%; Pet Supplies: 105.3%
    • The Boomers truly led the way in building the pet industry and they are still at it. They are earning their share and are the spending leader in both Food and Supplies. With the FDA warning and the Supplies Tariffs, their overall performance is down sharp[y from last year. Ultimately this will fade even more as they age. They will undoubtedly lead in Food for a number of years, but Gen X may outperform them in Supplies by year end.
  • Gen X Performance – Pet Products: 114.0%; Pet Food:117.1%; Pet Supplies: 125.6%
    • The Gen Xers are next in line and next in performance to the Boomers. They significantly outperform the Boomers on supplies and their Food performance is again above 100%. Gen Xers range in age from 39 to 54. They already make and spend the most money. As they grow older, their children will start to move away from home and their focus will increasingly turn to their Pet Children. Expect their overall performance to continue above the 110% level and to surpass the Boomers in the not too distant future.
  • Millennials Performance – Pet Products: 91.4%; Pet Food: 89.4%; Pet Supplies: 94.6%
    • The Millennials are widely touted as the future of the industry. This is ultimately true, but the future is still a ways off. The Millennials are currently 23 to 38 years old. They have a lot of pets, but their responsibilities are growing, and they are still a little short on income. There is no doubt that are deeply committed to their pets as they took over the #2 spot in Pet Products spending as a share of total spending. They now only trail the Boomers. They are 16 years away from occupying the highest income age group. Plus, they are having children later so the spending lift from children leaving will also undoubtedly be delayed. With all things considered, they may be 15 years away from Pet Spending dominance.
  • Gen Z Performance – Pet Products: 25.5%; Pet Food: 23.8%; Pet Supplies:28.2% They’re Just getting started!

A Final Word – In the 2018 mid-year update, Pet Products Spending was up $5.3B. The increase was driven by the Boomers (48%) and Millennials (38%). Millennials were the most consistent with spending lifts in both halves for Food and Supplies. Mid-Yr 2019 was quite different. The 2018 FDA grain free warning drove Food spending down $2.46B while added tariffs on Supplies raised prices, resulting in a $2.1B drop in spending. The Boomers owned the biggest share of both decreases but the oldest group also contributed -$1B. On the plus side, in Food the younger groups were both up – a total of $1.2B. In Supplies all groups but Millennial/Gen Z spent less. One thing didn’t change from 2018. The Millennials were the most consistently positive. They were the only group to spend more on both Food and Supplies.


Retail Channel Monthly $ Update – May Final & June Advance

Time for our monthly update on U.S. retail sales by channel. The current COVID-19 crisis has caused turmoil in the Retail Marketplace. Consumer spending behavior has changed and continues to evolve. In this report we will track the changes and migration between channels. We will do that with data from two reports provided by the U.S. Census Bureau.

The Reports are the Monthly Retail Sales Report and the Advance Retail Sales Report. Both are derived from sales data gathered from retailers across the U.S. and are published monthly at the same time. The Advance Report has a smaller sample size so it can be published quickly – approximately 2 weeks after month end. The Monthly Final Report includes data from all respondents, so it takes longer to compile the data – about 6 weeks. Although the sample size for the Advance report is smaller, the results over the years have proven it to be statistically accurate with the final monthly reports. The biggest difference is that the full sample in the Final report allows us to “drill” a little deeper into the retail channels.

This means to get the full picture in our monthly channel update we need to look at the latest release of both reports. We will begin with the Final Retail Report from May and then move to the Advance Retail Report for June. This will also allow us to better track the consumers’ evolving spending behavior in terms of channel migration.

Both reports include the following:

  • Total Retail, Restaurants, Auto, Gas Stations and Relevant Retail (removing Restaurants, Auto and Gas)
  • Individual Channel Data – This will be more detailed in the “Final” reports and we fill focus on Pet Relevant Channels

The information will be presented in detailed charts to facilitate visual comparison between groups/channels of:

  • Current Month change – % & $ vs previous month
  • Current Month change – % & $ vs same month in 2019
  • Current YTD change – % & $ vs 2019
  • Monthly and Year To Date $ will also be shown for each group/channel

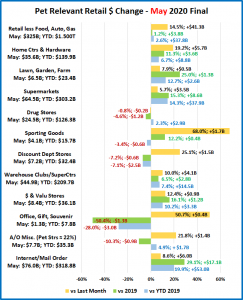
We’ll start with the May Final report. The Retail Market was beginning to recover after hitting bottom in April. First, we will look at some major retail groups. (Note: The Data in all graphs is Actual, Not Seasonally Adjusted)

The final total is $2B more than the Advance report projected a month ago. Although Relevant Retail was $2B less than expected, the Auto segment was $3B better. Restaurants also were $1B more than the early numbers but Gas Stations’ $ were the same. $ales were up vs April across the board but down for all but the Relevant Retail group vs 2019 and YTD.

The Spring Lift usually begins in late March and peaks in May as consumers focus on the outdoors. Closures and “staying at home” pushed that back. Things began to open up in May, but except for Relevant Retail, $ were down vs 2019.

Now, let’s see how some Key Pet Relevant channels were doing in May.

  • Overall – Strong recovery from April as all channels, but Drug Stores had increases, 7 of 11 with double digit %.
  • Building Material Stores – This group typically has their biggest annual lift in Spring. This is unchanged and even amplified. Farm Stores are doing especially well with spectacular increases vs 2019. Although Sporting Goods stores are not included in this group, they have a similar Spring lift pattern. You can see that consumers really opened up to sports/recreation activities in May.
  • Food & Drug – Supermarket sales continue with strong growth. Drug Stores also had a March sales rush on essentials that ended in April and the decline continued into May as sales for both months were down vs 2019.
  • General Merchandise Stores – Sales in $ Stores and Clubs/SuperCtrs show continued strength with $ Stores showing the most growth. Some Discount Department stores were closed and shopping in others was often limited to essentials. You can see that they began to recover in May but are still down vs 2019.
  • Office, Gift and Souvenir Stores – Most of these stores were closed. In May they began to slowly open up.
  • Internet/Mail Order – “Stay at home” has further accelerated this channel’s growth. This will likely continue as the crisis has introduced many new consumers to online shopping and the behavior is likely to become habitual.
  • A/O Miscellaneous – This is a group of small to midsized specialty retailers – chains and independents. It includes Florists, Art Stores and Pet Stores. Pet Stores account for 22 to 24% of this group’s total sales. Pet Stores were generally deemed essential, but most stores were not. The others began reopening in May so there was a big lift from April. They were up 21% through February which is why they still have 4.9% YTD increase.

After a disastrous April, May saw the beginning of a slow recovery. As businesses began to re-open the numbers started to move in the right direction. Driven by the Internet, Supermarkets, SuperCtrs/Clubs/$ Stores and Hdwe/Farm the Relevant Retail Segment turned positive in all measurements. June brought even more widespread re-openings. Let’s see how the situation is progressing. Here are the Advance numbers for June.

April was the biggest spending drop in history. May was $97B better but still the second worst decrease in history, -$40B from 2019. In June, monthly sales turned positive for the first time since February as Total Retail was up $12B vs 2019.

Total Retail – Total Retail spending increased $12B, +2.3% vs 2019. It was the smallest increase since June 2019 but more importantly, the first since February. Sales through February 2020 were up $60B, +6.6% versus 2019. Then came COVID-19. Hopefully, we bottomed out at -$113B in May. We are still down -$100B YTD and -$170B from February.

Restaurants – Spending increased $6B over April but was still down $18B vs 2019. The year started out good, up $9B (+8.1%) through February. Then mandates forced many restaurants to close. Delivery and curbside pickup couldn’t make up the difference. Even the gradual re-opening in May and June was not enough as spending is now down $86B YTD.

Automobile & Gas Stations – If you can’t go out, except for necessities, then your car becomes less of a focus in your life. Buying a car was definitely less of a priority. Auto Dealers, both new and used, have been combating this with some fantastic deals and a lot of advertising. In June they turned the corner as sales were up $10B versus 2019. In terms of Gas Stations, May is traditionally the beginning of the vacation travel season but not in 2020. Although sales increased in May and June, they are still down -$42B YTD. People are still not driving as much, whether for commuting or road trips.

Relevant Retail – Less Auto, Gas and Restaurants – Many non-essential businesses began to shutter their doors in March but there was also a rash of binge/panic buying for “necessities” and a big lift in groceries as consumers focused on home cooking which drove spending up $19B. Then came April. With a full month of closures and an end in binge buying, spending dropped $34B from March. In May, the overall market began a slow reopening so spending began to move in the right direction. Nonstore, Grocery and SuperCenters/Clubs & $ Stores continued their growth. The spring lift in the Hardware/Farm channel got even stronger and Sporting Goods stores got on  board. In June, these big drivers couldn’t quite match their May numbers, but the openings became more widespread and the Relevant Retail group now has posted positive numbers versus last month, last year and year to date for 2 consecutive months.

Now let’s look at what is happening in the individual retail channels across America. In June, consumer spending in the relevant retail market grew even more positive versus 2019. Let’s see where the $ came from. These groups are less defined than in the Final Monthly reports and we will look across the whole market, not just pet relevant outlets.


The increase over May was driven by re-openings. The increase vs 2019 and YTD came from essential businesses.

Observations

After a full month of stay at home and widespread closures there was surge in May. Things truly opened up in June which fueled an increase over May. However, the essential channels are responsible for the lift vs 2019.

  • Nonstore Retailers – Even more consumers are online shopping.
  • Food & Beverage, especially Grocery– Restaurant $ are still down so consumers continue to eat & drink at home.
  • Sporting Gds/Hobby/Books – Stores re-opened and consumers began to return to outside recreational activities.
  • Bldg Materials/Garden/Farm – A bigger than usual Spring lift continues as consumers focus “on their home”.
  • SuperCtrs/Club/Value/$ Strs – Sales slowed in April, but they came back strong in May and it continued in June. This group turned the whole Gen Mdse channel positive. It clearly shows that value is still a consumer priority.

Regarding the Individual Large Channels

General Merchandise Stores – Regular Department stores began reopening and Discount Department stores held their ground, so this cut the losses for Department Stores. Club/SuperCtr/$ stores provided the big positive force. In April consumers dialed back their panic buying and spending on discretionary items was also down significantly. In May and now June we saw consumer spending return to a more normal pattern in the big and small stores that promise value.

Food and Beverage, plus Health & Personal Care Stores – The Grocery segment is still driven by increased Food sales due to a slow restart by restaurants, up 10.5%, +$6B. Sales in the Health, Personal Care group are up slightly from May but remain down overall. Many Personal Care stores are now slowly reopening but Drug Stores sales are essentially flat.

Clothing and Accessories; Electronic & Appliances; Home Furnishings – More and stores are reopening, producing a spectacular increase in sales over May. However, June $ were still down from 2019. They all had the same pattern, with Clothing Stores being the most extreme. Their sales were up 84% from May but still down 24% vs 2019 and 39% YTD. These channels have a long way to go to recover.

Building Material, Farm & Garden & Hardware – This channel has its biggest spending lift in the Spring. The shelter in place rules caused many consumers to turn their focus to their needs at home, including house and yard repair and improvement. This has accelerated and extended their Spring lift. Sales are up across the board, including +9.9% YTD.

Sporting Goods, Hobby and Book Stores – Book and Hobby stores which had been closed are now open. Sporting Goods stores had generally been open but organized sports were on hold, parks closed, and non-essential travel was discouraged. In May things began to open up and this expanded in June. Consumers again sought outdoor recreation. Sales doubled from April to May and grew 31% in June. June $ even beat 2019 by 22%, but YTD they are still down 6%.

All Miscellaneous Stores – This group is mostly small to medium specialty stores – both chains and independents. While Pet Stores are essential, most other stores in this group are not. The closures hit this group particularly hard. May sales were up 27% from April as the reopening began and grew 12% in June. However, they were still down 5% vs June 2019 and are down 7% YTD. In February they were up $2.6B, +14.1% YTD. Now they are down -$4.7B – a big turnaround.

NonStore Retailers – 90% of the volume of this group comes from Internet/Mail Order/TV businesses. The COVID-19 crisis has only accelerated the ongoing movement to online retail. Compared to 2019, NonStore was up 16.3% in March, 22.5% in April, 25.3% in May and 30.3% in June. Since April they have been the leader in all sales measurements either in $ or % increase. As you can see, their lead is growing. Also, their YTD sales are up 18.4%, exceeding their 12.9% annual increase in 2019. This early year lift bodes well for 2020 as much of their annual increase is usually driven by Christmas.

Note: Almost without exception, online sales by brick ‘n mortar retailers are recorded along with their store sales in their regular channel. Whether they are up or down, their online sales are included in the totals.

Recap – After a record drop in spending in April, the situation improved slightly in May, but it still was the 2nd biggest year over year monthly retail sales decline in history. Restaurants, Auto and Gas Stations all had big sales increases in May and now June, but they are still struggling. The Relevant Retail segment has provided the only true positive as sales are up in all measurements for 2 consecutive months. However, for many segments in this group there is still a long way to go. In June Total Retail turned positive for the first time since February and Relevant Retail appeared to be moving towards a more routine pattern – a new normal. However, we are now seeing a resurgence of the virus and retail restrictions are being re-implemented in many areas and are likely to become more widespread. This is going to be a long battle with no end in sight. We will continue to monitor the data and provide you with regular updates as the situation evolves.


The Impact of COVID-19 on Small Businesses – 6/27 Update

Small Businesses are at the core of our nation’s economy and the challenges they face are important to everyone. To better understand the impact of COVID -19 on these businesses and aid decision makers in serving their urgent needs, the U.S. Census Bureau directly reached out to small businesses. For the Survey, the Census Bureau defined a small business as a single location business with employment between 1 and 499 and receipts of at least $1,000.

Consisting of 16 questions, this 5-minute survey reached close to 1 million businesses split across a 9-week rotation to reduce burden and lessen survey fatigue. The survey included small businesses in every area of the U.S. Economy. This initial survey began in the week ending 5/2/20 and was completed in the week ending 6/27/20 so we are able to track the evolution of the COVID-19 impact over 8 full weeks.

The results are first categorized by major, 2 digit NAICS code classification. Slightly more specific data (by 3 digit NAICS code) also became available so that we are able to more closely track elements which are relevant to the Pet Industry. Here are the 14 “pet relevant” groups for which we have compiled data:

  • National Avg: Covers All Major Areas with a few Exceptions like Agricultural Production and Religious Organizations
  • Product Related Groups:
    • 31-33: Manufacturers – All manufacturers
      • 311 – Food Manufacturers (Both Human & Animal)
    • 42: Wholesalers/Distributors – Wholesalers/Distributors of any type products
      • 424 – Distributors of Nondurable Goods (Includes food and nondurable supplies)
    • 44-45: Retail Trade – This includes everything from gas stations to Pet Stores (#453910). No restaurants
      • 444 – Building Materials/Hardware/Farm
      • 445 – Food & Beverage Stores
      • 452 – General Merchandise Stores
      • 453 – Miscellaneous Retailers (includes Pet Stores)
      • 454 – Nonstore Retailers
  • Services Related Groups:
    • 54: Professional, Scientific and Technical Services – Legal, Advertising Agencies, etc… and Vet Clinics (#541940)
    • 81: Other Services – Funeral Homes, Barber Shops, Auto Repair, etc … and Pet Care Services (#812910)
      • 812 – Laundry & Personal Care (includes Pet Care Services)

The data from each group has been bundled into 3 charts showing the group’s responses to 8 particularly relevant questions about the impact of COVID-19.

Here are the charts and the questions that will be answered on each:

Chart #1: Impact of Covid-19 on Your Business

  1. Overall, how has this business been affected by the COVID-19 pandemic?

Chart #2: Key Business Elements – Weekly Changes

  1. In the last week, did this business have a change in operating revenues?
  2. In the last week, did this business have disruptions in its supply chain?
  3. In the last week, did this business temporarily close any of its locations for at least one day?
  4. In the last week, did this business have a change in the number of paid employees?

Chart #3: Government Assistance & Your Outlook For The Future

  1. Since 3/13, has this business requested/received financial assistance from Paycheck Protection Program (PPP)?
  2. Since 3/13, has this business received any financial assistance from any Federal Program?
  3. In your opinion, how much time will pass before this business returns to its usual level of operations?

We are not going to review each group in this report. We will take a closer look at the Overall Retail Trade (NAICS 44-45) and 3 retail subchannels – Miscellaneous Retailers (includes Pet Stores), Nonstore Retailers and Hardware/Farm Stores. We also will review Personal Care Services which includes Pet Care. At the conclusion of the report we will make the data for all 14 groups available for you to download. You can then pick the ones that are most relevant to your particular business.

A word of caution: Remember, this data is only for the small businesses in any particular classification. It doesn’t include the big chains, which could be impacted differently because of their size, capabilities or resources.

Let’s get started with the Retail Trade

  • There is a big negative impact on the retail trade,76.0%. However, it is still faring better than the overall market which stands at 82.7% negative as of 6/27.
  • The negativity has moderated but the readings for all response groups have basically plateaued since 6/13.

  • Every measurement on this chart began moving in the right direction but most have plateaued since 6/13. In terms of revenue, 40% still showed a decrease which is still better than the national average, 42.6%. Retail outlets are also doing better than the Nation overall at generating increased $ – 29.1% to 19.7%.
  • Supply chain problems are high but stable. Much of the country was opened up in June so temporary closures only affected 15.3% of businesses – a big drop from 43.7% eight weeks earlier.
  • The employment situation has improved, especially in terms of businesses decreasing the number of employees. However, that situation has also become static, with the same number adding as cutting and 80% maintaining the status quo.

  • 97% of retail trade businesses that applied for PPP funds have received payment. In fact, 79% of all small retail businesses have received some form of government assistance.
  • In terms of outlook, although the number of businesses now expecting little or no effect by COVID-19 has grown significantly from 5.1% to 13.3%, this is a small segment. The most popular forecast (40.8%) is over 6 months for a return to normal. When you combine that with the 10.3% who believe that things will never be normal again you get over half, 51.3% who think that recovery will take considerable time. However. This is better than the overall national average of 53.6%

Now let’s drill a little deeper – Miscellaneous Stores, which includes Pet Stores

  • While Pet Stores were generally deemed “essential”, most stores in this group, like gift shops, art dealers and used furniture stores were not, which explains the high initial negative impact. It did moderate slightly in May but turned sour in mid-June.
  • After peaking at 16.7% on 6/6, the number of businesses reporting a positive or little no effect on their business fell to 13.2% by 6/27.

  • The change in revenue started in the right direction but has basically plateaued. Although businesses reporting decreased revenue have actually increased since 6/13.
  • Supply chain problems remain a big factor and they too have gotten worse since 6/13.
  • Closures have been cut in half but still affect almost 1/3 of the group (31.8%)
  • The employment situation has gotten significantly better but there are still twice as many businesses losing employees (14.9%) as those adding employees (7.4%).

  • The PPP funds have been distributed. 96% of businesses who applied have received funds. In fact, 81.5% of this group have received some form of federal aid.
  • This group’s projected recovery time has gotten worse since mid-June. Now 49.1% say that it will be over 6 months until a return to normal and 14.6% say normal will never return. That is 63.7% of these businesses.

Next, let’s look at Nonstore Retailers

  • Although the negative view is less than at the beginning, it is trending up. However, so is the positive view, The biggest decrease occurred in little/no effect which fell from 14.2% to 8.7% in the week of 6/27.

  • The revenue situation improved in May but has plateaued in June. 22-24% are posting increases. 35-37% report no change and about 40% are seeing decreased revenue.
  • Supply chain problems increased in mid-June but improved by 6/27, Closures improved in June but were up and down on a weekly basis.
  • The employment situation generally became more stable in June as hiring and layoffs both slowed. Although there was a little more turmoil in the week of  6/27.

  • 98% of businesses that requested PPP have received funds and 72% of the businesses in this group have received some form of government assistance.
  • Their overall projection for recovery grew worse in June. By 6/27 43.3% said it would take over 6 months and 9.7% said normal would never return. That’s 53% which is about equal to the National Average (53.6%) but worse than Total Retail (51.3%), which is somewhat surprising for a nonstore group.

Our final Retail Trade group is Hardware/Farm Stores

  • Except for an uptick in negativity during the week ending 6/6, their impression of the impact of COVID-19 on their business has steadily improved. By 6/27 their negativity score (55.6%) was the lowest of any retail group that we measured, including Food & Beverage Stores at 59.4%.

  • Their revenue began moving in the right direction and by 6/13 the number with increases exceeded the number with decreases. It has become relatively stable – about 33% up, 30% down and 37% with no change.
  • Supply chain problems are stable, but high at 56+%. Closures are down dramatically and were only 6.7% as of 6/27.
  • Hiring has slowed, after peaking during the week of 6/6 but still exceeds layoffs. 81.4% are now showing no change in the number of employees.

  • 99% of businesses that have applied for PPP have received their money and 75.4% of the group has received some form of federal assistance.
  • This group projects a speedier recovery than any other retail group. 38.3% expect a return to normal in 6 months or less but 26.6% say that there has been little or no effect on their business. That totals 64.9% which is much better than the National Average of 46.4% and 48.9% for Total Retail.

Finally, let’s look at the Personal Care Services Channel, which includes Pet Care Services

  • This segment was hugely impacted by closures but even opening up has not much improved their assessment of the situation. The negativity is still extraordinarily high at 91.5%. Although it has moderated slightly, almost 2/3 of the businesses, 65.2% still see the situation as extremely negative.

  • The revenue situation has gradually improved but 50.6% of businesses are still reporting a decrease in $ as of 6/27.
  • Supply chain disruptions are improving and are lower than many other channels. Closures have decreased by 54% since May 2nd but still affect 3 in 10 businesses (30.8%).
  • The employment situation is still negative – 7.8% hiring; 19.5% laying off, but it has reached its highest level of stability as 72.7% maintained the status quo in the week of 6/27.

  • 94% of businesses that applied for PPP have received funds and 84.4% of the group has received some form of federal assistance, which is better than the National Average, 77.0% and the Total Retail Trade, 78.7%.
  • Their outlook is rather bleak and almost the exact opposite of Hardware/Farm stores. 47.9% project over 6 months for a return to normal while 19.0% say normal will never return. That totals 66.9%, two thirds of all personal care outlets.

As you can see from our examples, the specifics can vary widely by business category. As the economy began re-opening the situation was generally improving. However, we have seen a resurgence in the virus. This is leading to reimplementation of some business restrictions and has produced an overall feeling of uncertainty among consumers. Until we have a stability in health, a return to normalcy in business will be greatly slowed. COVID-19 has had an especially negative impact on U.S. Small Businesses. Even small businesses in channels that are showing overall growth during the crisis, like Hardware/Farm and Nonstore, are having serious problems. The overall national growth in these channels is being driven by the “big guys”, like Home Depot and Amazon. The overall projection for a return to normal for small businesses is increasingly over 6 months, which would put it in 2021.

That concludes our analysis of this initial survey. As you can see the situation is far from over. Hopefully the Census bureau will conduct periodic future surveys so that we can fully monitor the progress of small businesses through this crisis.

Finally, as we said, more data is available for you. Files with the specific data/charts for all 14 business categories that we identified as relevant to the Pet Industry (including those used in this report) are available for download. Each file is a 1 page word document with 3 COVID-19 impact charts for a specific business category. There is no commentary – just data. Pick the ones that are most relevant for your business and share them with your associates. STAY SAFE!

National Average & Major Business Categories

National Avg Manufacturers Whlsrs/Distribs Retail Trade Science/Tech Other Services

More Defined Supply Chain Categories

Food Mfg Distrib Nondurables

Drilling Down into the Retail Trade

Bldg/Hdwe/Farm Food & Bvg Gen Mdse Strs Misc Stores Nonstore Retailers

Finally, Personal Care Services (includes Pet Care)


U.S. Pet Services Spending (Non-Vet) $8.81B (↑$0.95B): 2019 Mid-Year Update

The US BLS just released their Mid-Year Update of the Consumer Expenditure Survey covering the period 7/1/2018 to 6/30/2019. In our analysis of Pet Supplies Spending we saw a 24 month lift come to an end. Tariffs drove prices up and Spending turned sharply down across virtually every demographic segment in the 1st half of 2019 . Pet Food Spending also turned down, but in the 2nd half of 2018, in reaction to an FDA warning on grain free dog food. Now we turn our attention to Pet Services. The Mid-year numbers show that spending in this segment was $8.81B, up $0.945B (+12.0%) from the previous year. This segment is known for consistent, albeit small increments of growth. In 2018 that changed. The 1st half saw a $1.1B increase followed with an additional $0.85 lift in the 2nd half. This annual $1.95B increase was by far  the biggest $ increase in history. In the 1st half of 2019, Services spending plateaued, but at this unprecedented, elevated level. This deserves a closer look. First, we’ll review recent Services spending history since 2013.

Here are the 2019 Mid-Year Specifics:

Mid-Year 2019: $8.81B; ↑$0.945B (+12.0%) vs Mid-Yr 2018

Jul > Dec 2018: ↑$0.85B

Jan > Jun 2019: ↑$0.09B

Pet Services is by far the smallest industry segment. However, except for 2010 and 2011, the period immediately following the Great Recession, it had consistent annual growth from 2000 through 2016. Spending in Food and Supplies have been on a roller coaster ride during that period. Services Spending more than tripled from 2000 to 2016, with an average annual growth rate of 7.6%. Spending in the Services Segment is the most discretionary in the industry and is more strongly skewed towards higher income households. Prior to the great recession, the inflation rate averaged 3.9% with no negative impact. The recession affected every industry segment, including Services. Consumers became more value conscious, especially in terms of discretionary spending. Services saw a slight drop in spending in both 2010 and 2011, but then the inflation rate fell to the 2+% range and the segment returned to more “normal” spending behavior. In mid-2016 inflation dropped below 2% and continued down to 1.1% by the end of 2017. This was primarily due to increased competition from free standing businesses but also an increase in the number of Pet Stores and Veterinary Clinics offering pet services. While prices still went up slightly, there were deals to be had and consumers shopped for the best price. There was no decrease in purchase frequency. Consumers just paid less so spending fell slightly. In the 2nd half of 2017 spending turned up again. More Consumers began to take advantage of the value and convenience of the increased number of outlets offering Services. This deeper market penetration caused Services Spending to take off in 2018, up $1.95B, by far the biggest annual increase in history. Prices turned up again in the first half of 2019, increasing  2.8% from 2018. However, Services essentially “held their ground” as  spending inched up $0.09B. With an annual growth rate of 8.2% since 2000, Services have become more prominent in the Industry.

Let’s take a closer look at some spending demographics – Age and Income.

In the graphs that follow we will compare spending for the Mid-year 12 months ending 6/30/19 to the previous period ending 6/30/18. In our graphs we will also include the 2018 yearend $pending. This will also allow you to see the spending changes in the 2nd half of 2018 and the 1st half of 2019.

The first graph is for Income, the single most important factor in increased Pet Spending, especially in Services.

Here’s how you get the change for each half using the Over $70K group as an example:

Mid-yr Total Spending Change: $6.43B – $5.62B = Up $0.81B (Note green outline = increase; red outline = decrease)

  • 2nd half of 2018: Subtract Mid-18 ($5.62B) from Total 2018 ($6.31B) = Spending was up $0.69B in 2nd half of 2018.
  • 1st half of 2019: Subtract Total 2018 ($6.31B) from Mid-19 ($6.43B) = Spending was up $0.12B in 1st half of 2019.

  • Both the Over and Under $70K groups had a 12-month spending increase. However, Over $70K was responsible for 86% of the $0.94B national lift. The Under $70K group decreased spending in the 1st half of 2019 so their overall increase was produced solely by a lift in the 2nd half of 2018.
  • The individual groups over $70K all showed growth in both halves, but it was minimal in the 1st half of 2019. The Over $100K groups were responsible for 81% of the total Services increase.
  • The lower income, $30>50K group had a spending pattern similar to the highest income groups but their percentage increase was more. Spending was up 47%. The lift in this group was driven by Retirees (Avg Income: $42K) as they chose to fulfill their real need for Pet Services. This group is the only reason Under $70K registered an increase.
  • Spending in the Under $30K group was essentially flat. The lower middle income, $50>70K group had the biggest decrease and it came from a big drop in the 1st half of 2019, following a small lift at the end of 2018.
  • Income is the biggest factor in choosing the discretionary convenience of Pet Services. However, we can’t ignore “need” as was demonstrated by the retiree driven performance of the $30>50K group.

Now, Services’ Spending by Age Group.

  • The spending lift in both halves by the 65+ yr olds and the highest income 45>54 age group mirrors what see saw in the income category. Plus, their major lifts came in different halves.
  • The 55>64 yr old Boomers had the only overall decrease. It was minor and spending was flat in the 1st half of 2019.
  • All groups under 45 had the same pattern with a spending lift in the last half of 2018, followed by a drop in the first half of 2019. The size of the drop grew with age and spending. The 25>34 yr olds were flat. The others spent more.
  • It’s obvious that the biggest positive movement in Services Spending in the 1st half of 2019 came from oldest groups.

Now let’s look at what is happening in Pet Services spending at the start of 2019 across the whole range of demographics. In our final chart we will list the biggest $ moves, up and down by individual segments in 11 demographic categories. Remember, the lift in the 1st half of 2019 was $0.09B, much less than the $0.85B in the 2nd half of 2018.

The first thing that is readily apparent is that the $ changes from winners and losers in each category tend to cancel each other out. This is similar to a pattern that we saw in Food, which also had a minor increase in spending during the 1st half of 2019. The $0.09B increase in Pet Services came from 46 of 80 demographic segments (58%) spending more, just 2 more than the 44 in Pet Food.

The positive impact on Services spending in the 1st half of 2019 by older Americans is obvious from theses 6 winners:

  • 65+ Yrs
  • $30>49K
  • Retired
  • No Earner, Single
  • Homeowner w/o Mtge
  • Silent/Greatest Generations

Like the Food and Supplies segments, Single CUs also had a good start to 2019 in Services spending, winning in 3 demographic categories. However, for Services, the “driver” was No Earner, Singles.

It wasn’t all older groups as 3 “usual” winners came to the top – White, Not Hispanic, BA/BS Degree and Suburban.

On the “losing” side we see evidence of the slight downturn in spending by the younger groups in the performance of these segments:

  • 35>44 Yrs
  • Gen X
  • 3 People
  • Married, Oldest Child <6
  • Renter
  • Central City

We should also note that Gen X (-$0.06B) barely beat out Millennial/Gen Z (-0.057B) for the “losing” spot so the decline was basically universal in the youngest groups. 2 Earner CUs are also more common in these groups.

In 2018 the Services segment reached a new level of prominence in the Pet Industry. However, in 2019 growth seems to be slowing. How did we get here and what comes next?

We have noted that by 2017 the number of outlets offering Pet Services had radically increased. This created a highly competitive market and the inflation rate dropped to near record lows. Value conscious consumers saw that deals were available, and they took advantage of the situation. However, they didn’t increase the frequency of purchase. They just paid less. This drove overall Pet Services spending down in the 1st half of 2017. The segment started to recover in the 2nd half but not enough to prevent the first annual decrease in Pet Services spending since 2011. However, it was a start. In 2018, more consumers started to recognize the convenience offered by more outlets. The latest big food upgrade was also winding down. The result was that Services started a deeper penetration into the market, especially in the younger groups. The <45 groups spent $1.47B more on Services in 2018, 74% of the total $1.95B increase in the segment. As such, a slight downturn in 2019 is not unexpected. They may just have been value shopping. However, the oldest groups did seize the opportunity. They have a real need for Pet Services. Now they are convenient and more affordable.

Will this continue? What can we expect in the 2nd half of 2019? We can’t say for sure, but inflation could be a factor. In the 1st half of 2019 Services prices were up 2.9% vs 2018. This also may have contributed to the reduced spending by some segments. However, the rate slowed to +2.2% in the 2nd half. This is historically a more typical inflation rate for this segment. It probably signals a return to slow, consistent growth for Services. We’ll see when the full year spending data for 2019 is released in September.


Retail Channel Monthly $ Update – April Final & May Advance

Time for our monthly update on U.S. retail sales by channel. The current COVID-19 crisis has caused turmoil in the Retail Marketplace. Consumer spending behavior has changed and continues to evolve. In this report we will track the changes and migration between channels. We will do that with data from two reports provided by the U.S. Census Bureau.

The Reports are the Monthly Retail Sales Report and the Advance Retail Sales Report. Both are derived from sales data gathered from retailers across the U.S. and are published monthly at the same time. The Advance Report has a smaller sample size so it can be published quickly – approximately 2 weeks after month end. The Monthly Final Report includes data from all respondents, so it takes longer to compile the data – about 6 weeks. Although the sample size for the Advance report is smaller, the results over the years have proven it to be statistically accurate with the final monthly reports. The biggest difference is that the full sample in the Final report allows us to “drill” a little deeper into the retail channels.

This means to get the full picture in our monthly channel update we need to look at the latest release of both reports. We will begin with the Final Retail Report from April and then move to the Advance Retail Report for May. This will also allow us to better track the consumers’ evolving spending behavior in terms of channel migration.

Both reports include the following:

  • Total Retail, Restaurants, Auto, Gas Stations and Relevant Retail (removing Restaurants, Auto and Gas)
  • Individual Channel Data – This will be more detailed in the “Final” reports and we fill focus on Pet Relevant Channels

The information will be presented in detailed charts to facilitate visual comparison between groups/channels of:

  • Current Month change – % & $ vs previous month
  • Current Month change – % & $ vs same month in 2019
  • Current YTD change – % & $ vs 2019
  • Monthly and Year To Date $ will also be shown for each group/channel

We’ll start with the April Final report. This was the depth of the crisis (hopefully). The impact is very visible. First, we will look at some major retail groups. (Note: The Data in all graphs is Actual, Not Seasonally Adjusted)

It is slightly better ($8B) than the Advance report projected a month ago. Although Restaurant $ales were $2B less than expected, the “Relevant Retail” segment was $10B better. Gas Stations also were $1B more than the early numbers but The Auto Segment was “spot on”. However, It was still by far the worst year over year monthly performance in history.

In a “normal” April we are generally into the Spring Lift as consumers begin to turn to outside activities. However, the widespread closures and “stay at home” guidelines generally ended that behavior.

Now, let’s see how some Key Pet Relevant channels were doing in April.

  • Overall – Any binge spending ended in April as only Internet and Hardware/Farm had a March to April increase.
  • Building Material Stores – This group typically has their biggest annual lift in Spring. It appears that this is unchanged. Farm Stores did especially well with spectacular increases in all measurements. Although Sporting Goods stores are not included in this group, they have a similar Spring lift pattern. However, the results are totally different. You truly see the impact of the sports/recreation “shut down”.
  • Food & Drug – Although the March binge buying is over, Supermarket sales continue with strong growth. Drug Stores also had a March sales rush on essentials, but that clearly ended in April as sales are below April of 2019.
  • General Merchandise Stores – Although the March binge buying is over, sales in $ Stores, Clubs/SuperCtrs are both up, with $ Stores showing the most growth. Most traditional Department stores were closed and shopping in many Discount Department stores was often limited to essentials. The result is that sales were down -44.5% vs April 2019.
  • Office, Gift and Souvenir Stores – Most of these stores are deemed non-essential. You see the result.
  • Internet/Mail Order – “Stay at home” has further accelerated this channel’s growth. This will likely continue as the crisis has introduced many new consumers to online shopping.
  • A/O Miscellaneous – This is a group of small to midsized specialty retailers – chains and independents. It includes Florists, Art Stores and Pet Stores. Pet Stores generally account for 22 to 24% of this group’s total sales. Although Pet Stores were generally deemed essential most stores were not. The group was up 21% YTD in February which is the only reason that they are still “hanging on” to a YTD increase.

April was certainly a terrible month for retail spending, the biggest Total Retail $ drop in history. The March binge/panic buying ended in April and we saw the huge negative impact of a full month of non-essential business closures. In May, a very slow reopening of the economy began. Let’s see how it is progressing. Here are the Advance numbers for May.

April was the biggest spending drop in history. May was $95B better but still $42B (-7.7%) below May of 2019. That  gives us an idea of how serious the current situation is and how long the recovery may take.

Total Retail – Total Retail spending fell $42B, -7.7% vs 2019, edging out March for the 2nd biggest drop in history. Remember, 2020 started off strong. Spending through February was up $60B, +6.6% versus 2019. Then came the COVID-19 crisis and now it is down -$116B – a $176B turnaround in just 3 months.

Restaurants – Spending increased $11B over April but was still down $26B vs 2019. The year started out good, up $9B (+8.1%) through February. Then social distancing began, and many restaurants closed. Delivery and curbside pickup couldn’t make up the difference as spending fell $78B in 3 months so this group is now down $69B YTD.

Automobile & Gas Stations – If you can’t go out, except for necessities, then your car becomes less of a focus in your life. Buying a car was definitely less of a priority. Auto Dealers, both new and used, tried to combat this with some fantastic deals and a lot of advertising. It appears to be helping but sales were still down $7B versus 2019. In terms of Gas Stations, May is traditionally the beginning of the vacation travel season but not in 2020. Prices are still down but people are still not driving as much as they used to, whether for commuting or road trips.

Relevant Retail – Less Auto, Gas and Restaurants – Many non-essential businesses began to shutter their doors in March but there was also a rash of binge/panic buying for “necessities” and a big lift in groceries as consumers focused on home cooking which drove spending up $19B. Then came April. With a full month of closures and an end in binge buying, spending dropped $34B, -10.7% from March and 16B, -5.2% vs April 2019. In May, the overall market began a slow reopening so spending began to move in the right direction. Nonstore and Grocery, along with SuperCenters/Clubs & $ Stores continued their growth. The spring lift in the Hardware/Farm channel got even stronger and the group which includes Sporting Goods, Hobby & Book Stores bounced back to beat their May 2019 numbers. The Relevant Retail group now has positive numbers in all measurements – vs last month, last year and year to date.

Now let’s look at what is happening in the individual retail channels across America. In May, consumer spending in the relevant retail market returned to positive numbers. Let’s see where the $ came from. These groups are less defined than in the Final Monthly reports and we will look across the whole market, not just pet relevant outlets.

Every group had a May sales increase over April, but performance was mixed when it came to vs 2019 and YTD. 

Observations

April was a full month of stay at home, widespread closures and reduced discretionary spending so it was an easy number to beat. However, only 7 of 13 groups had positive numbers for May 2020 vs 2019:

  • Nonstore Retailers – Even more consumers are online shopping.
  • Food & Beverage, especially Grocery– Restaurant $ are still down so consumers continue to eat & drink at home.
  • Sporting Gds/Hobby/Books – Stores reopened and consumers started to return to outside recreational activities.
  • Bldg Materials/Garden/Farm – A big Spring lift as consumers focus “on their home” even more than usual.
  • SuperCtrs/Club/Value/$ Strs – Sales slowed in April, but they came back strong in May and it was enough to turn the whole Gen Mdse channel positive. This group of stores offers great value which is still a consumer priority.

Regarding the Individual Large Channels

General Merchandise Stores – Some Regular Department stores began reopening and Discount Department stores held their ground, so this cut the losses for Department Stores. Club/SuperCtr/$ stores provided the big positive force. In April consumers dialed back their panic buying and spending on discretionary items was also down significantly. In May we saw consumer spending return to a more normal pattern in the big and small stores that promise value shopping.

Food and Beverage, plus Health & Personal Care Stores – The Grocery segment is still being driven by increased Food sales due to restaurant closures, up 14.3%, +$8B. Sales in the Health, Personal Care group are up minimally from April but remain down overall. Many Personal Care stores are slow to reopen and Drug Stores sales are essentially flat.

Clothing and Accessories; Electronic & Appliances; Home Furnishings – As stores reopen there was a spectacular increase in sales over April. However, May $ were still down big time from 2019. They all had the same pattern, with Clothing Stores being the most extreme. Their sales were up 209% from April but still down 63% vs 2019 and 43% YTD. These channels have a long way to go to recover.

Building Material, Farm & Garden & Hardware – This channel has its biggest spending lift in the Spring. The shelter in place rules caused many consumers to turn their focus to their needs at home, including house and yard repair and improvement. This has further accelerated the usual Spring lift. Sales are up across the board, including +6.7% YTD.

Sporting Goods, Hobby and Book Stores – Book and Hobby stores which had been closed started to reopen. Sporting Goods stores had generally been open but organized sports were on hold, parks closed, and non-essential travel was discouraged. In May things began to open up and consumers once again sought outdoor recreation. Sales literally doubled from April. The May Sales even beat 2019 by 6%. However, YTD they were still down 10%.

All Miscellaneous Stores – This group is mostly small to medium specialty stores – both chains and independents. While Pet Stores are essential, most other stores in this group are not. The closures hit this group particularly hard. May sales were up 27.3% from April as the reopening began but they are still down 24.3% vs May of 2019. In February they were up $2.6B, +14.3% YTD. In 3 months, this changed to down -$4.3B, -8.3%. That’s quite a negative turnaround.

NonStore Retailers – 90% of the volume of this group comes from Internet/Mail Order/TV businesses. The COVID-19 crisis has only accelerated the ongoing movement to online retail. Compared to 2019, NonStore was up 16.3% in March, 22.5% in April and 25.3% in May. Since April they have been the leader in all sales measurements regardless if it is in $ or % increase. Also, their YTD sales are up 16.6%, exceeding their 12.9% annual increase in 2019. This early year lift bodes well for 2020 as much of their annual increase is usually driven by Christmas Holiday spending, which is still to come.

Note: Almost without exception, online sales by brick ‘n mortar retailers are recorded along with their store sales in their regular channel. Whether they are up or down, their online sales are included in the totals.

Recap – Hopefully, April was the “bottom” in the COVID-19  impact on the American way of life and consumer spending. Although the situation began to improve slightly in May, it still beat out March to register the 2nd biggest year over year monthly retail sales decline in history. Restaurants, Auto and Gas Stations all had big sales increases over April, but they are still struggling. The Relevant Retail segment provided the only true positive as sales were up in all measurements. However, for many segments in this group there is still a long way to go. As the situation evolves, spending will no doubt move back to a more routine pattern – a new normal. No one knows how long that this will take and what long term impact the COVID-19 crisis will have on U.S. consumers’ spending behavior. We will continue to monitor the data and provide you with regular updates as the situation evolves.


The Impact of COVID-19 on Small Businesses – May Monthly Update

Small Businesses are at the core of our nation’s economy and the challenges they face are important to everyone. To better understand the impact of COVID -19 on these businesses, the U.S. Census Bureau began reaching out to small businesses in order to aid decision-makers in serving their urgent needs. For the Survey, the Census Bureau defined a small business as a single location business with employment between 1 and 499 and receipts of at least $1,000.

Consisting of 16 questions, this 5-minute survey reaches close to 1 million businesses split across a 9-week rotation to reduce burden and lessen survey fatigue. The survey is reaching out to small businesses in every area of the U.S. Economy. The first survey was conducted between 4/26/20 and 5/2/20. The most recent results are from the week ending 5/30/20 so we can now track the evolution of the COVID-19 impact across the whole month of May.

The results are first categorized by major, 2 digit NAICS code classification. Slightly more specific data (by 3 digit NAICS code) is now available so we are able to more closely track elements which are relevant to the Pet Industry. Here are the 14 “pet relevant” groups for which we have compiled data:

  • National Avg: Covers All Major Areas with a few Exceptions like Agricultural Production and Religious Organizations
  • Product Related Groups:
    • 31-33: Manufacturers – All manufacturers
      • 311 – Food Manufacturers (Both Human & Animal)
    • 42: Wholesalers/Distributors – Wholesalers/Distributors of any type products
      • 424 – Distributors of Nondurable Goods (Includes food and nondurable supplies)
    • 44-45: Retail Trade – This includes everything from gas stations to Pet Stores (#453910). No restaurants
      • 444 – Building Materials/Hardware/Farm
      • 445 – Food & Beverage Stores
      • 452 – General Merchandise Stores
      • 453 – Miscellaneous Retailers (includes Pet Stores)
      • 454 – Nonstore Retailers
    • Services Related Groups:
      • 54: Professional, Scientific and Technical Services – Legal, Advertising Agencies, etc… and Vet Clinics (#541940)
      • 81: Other Services – Funeral Homes, Barber Shops, Auto Repair, etc … and Pet Care Services (#812910)
        • 812 – Laundry & Personal Care (includes Pet Care Services)

The data from each group has been bundled into 3 charts showing the group’s responses to 8 particularly relevant questions about the impact of COVID-19.

Here are the charts and the questions that will be answered on each:

Chart #1: Impact of Covid-19 on Your Business

  1. Overall, how has this business been affected by the COVID-19 pandemic?

Chart #2: Key Business Elements – Weekly Changes

  1. In the last week, did this business have a change in operating revenues?
  2. In the last week, did this business have disruptions in its supply chain?
  3. In the last week, did this business temporarily close any of its locations for at least one day?
  4. In the last week, did this business have a change in the number of paid employees?

Chart #3: Government Assistance & Your Outlook For The Future

  1. Since 3/13, has this business requested/received financial assistance from Paycheck Protection Program (PPP)?
  2. Since 3/13, has this business received any financial assistance from any Federal Program?
  3. In your opinion, how much time will pass before this business returns to its usual level of operations?

We are not going to review each group in this report. We are going to take a closer look at the National Averages, Miscellaneous Retailers (includes Pet Stores) and Nonstore Retailers. At the conclusion of the report we will make the data for all 14 groups available for you to download. You can then pick the ones that are most relevant to your particular business.

A word of caution: Remember, this data is only for the small businesses in any particular classification. It doesn’t include the big chains, which could be impacted differently because of their size, capabilities or resources.

Let’s get started with the National Averages.

  • The perception of a negative impact remains high, 85+%, but it has become more moderate.
  • Not too many folks are seeing any positives, but the percentage seeing little or no effect has grown to 11.4%.

  • Every measurement on this chart is moving in the right direction. However, in terms of revenue businesses still have a very long way to go.
  • By the end of the month, more areas were reducing “lock downs” so the closures decreased, but still impacted over 1 in every 4 small business.
  • The employment situation also showed significant improvement. The gap between businesses adding and decreasing employees has narrowed.

  • Perhaps the most significant change is in the number of businesses receiving PPP funds. On May 2nd, 51% of businesses who had applied for PPP had received funds. By May 30th, this number had grown to 95%.
  • The other big change is that the projected time for recovery has increased, with 41.2% now saying a return to normal will take 6 months or more. Plus, 1 in every 10 businesses say that they will never return to “normal”.

Now, let’s look at MISCELLANEOUS STORES

  • While Pet Stores were generally deemed “essential”, most stores in this group, like gift shops, art dealers and used furniture stores were not, which explains the high initial negative impact. It did moderate slightly over the month.
  • The numbers are still very small, but the percentage of businesses expecting a positive outcome (5.7%) or little/no effect (7.4%) on their business are both increasing.

  • The change in revenue started in the right direction but plateaued at mid-month. In the last week it appears to be moving back on track.
  • Supply chain problems remain a big factor. While closures are down significantly, they still impact almost 4 in 10 businesses.
  • The number of businesses with a decreasing number of employees has been cut in half. However, it is still twice the number of companies adding employees.

  • The PPP funds really rolled out in May to this group. On May 2nd, only 41% had received any $. By May 30th, that number had grown to 93%. In fact, 78% of all these businesses received some type of federal aid.
  • This group also sees a longer recovery time, with 44.5% saying that it will be 6 months or more until a return to normal. This is actually a little more optimistic than their feelings on May 23rd when a full 62.5% thought that a return to normal would take 6 months or more (46.1%) or actually never happen (16.4%).

Finally, let’s look at NONSTORE RETAILERS

  • Although the percentage dropped sharply in the last week of May, a large majority of businesses still see COVID-19 as a negative impact on their business. 12.1% said that the effect would be positive.

  • The revenue situation is improving rapidly. Almost 1 in 4 businesses saw an increase in revenue, but 42.5% are still reporting declining $ales.
  • Supply chain problems and closures are improving but 23.8% with closures is still high for businesses with no retail outlets.
  • The employment situation totally turned around in May. As of May 30, more companies are adding employees (9.0%) than are losing them (6.9%).

  • The PPP was delivered in May. By 5/30, 96% of the businesses who applied for funds had received payment.
  • Their overall projection for recovery is a little better than average. 6 months or longer still has the largest number (31.8%) but 60% of this group say that there was no impact on their business by COVID-19 or that recovery will occur within 6 months.

As you can see from our examples, while the specifics may vary by business category and the situation is generally improving, COVID-19 has had a broad negative impact across the full spectrum of U.S. Small Businesses. Even small businesses in channels that are showing overall growth during the crisis, like Grocery, Hardware and Nonstore, are having serious problems. The overall national growth in these channels is being driven by the “big guys”, like Kroger, Home Depot and Amazon. The overall projection for a return to normal for small businesses is 6 or more months, which would put it in December 2020 or later.

That concludes our May update, but as we said, more data is available for you. Files with the specific data/charts for all 14 business categories that we identified as relevant to the Pet Industry (including those used in this report) are available for download. Each file is a 1 page word document with 3 COVID-19 impact charts for a specific business category. There is no commentary – just data. Pick the ones that are most relevant for your business and share them with your associates. STAY SAFE!

National Average & Major Business Categories

National Avg Manufacturers Whlsrs/Distribs Retail Trade Science/Tech Other Services

More Defined Supply Chain Categories

Food Mfg Distrib Nondurables

Drilling Down into the Retail Trade

Bldg/Hdwe/Farm Food & Bvg Gen Mdse Strs Misc Stores Nonstore Retailers

Finally, Personal Care Services (includes Pet Care)