2015 U.S. PET SPENDING by GENERATION – BOOMERS STILL DOMINATE!
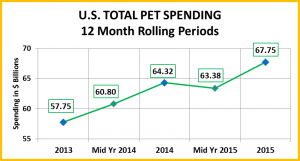
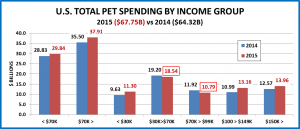
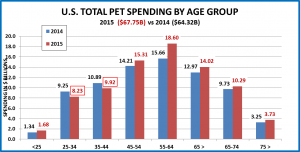
U.S. Consumers spent $7.2 Trillion dollars in 2015, up 400B (+5.9%) from 2014. Of this huge sum 0.944%, $67.75B was spent on our companion animals. Although overall the industry had a good year, the Pet Share of Total Spending actually fell very slightly from 0.948% in 2014.
In our recent posts, we have started to look at the key demographics behind “who” is spending the money. By looking deeper, all of the industry participants can better target their products and marketing efforts to maintain and gain retail sales…to keep the industry strong and growing.
In terms of demographics, nothing has a higher profile in the media and in our minds than comparing the actions between generations. How do the Millennials compare to the Baby Boomers? What about Generation X? These are valid questions and the Generation Demographic is the one measure that defines a very specific group of individuals for a lifetime. Emigration, immigration or death can change the mix and of course, marriage and divorce will affect the # of households. However, we can still track how aging, technological changes, economic events, in fact any change in society, affects the behavior of a specific set of individuals.
In this report we will compare the Pet Spending in 2015 vs 2014 by Generation. The “numbers” come from or are calculated from data in the US BLS Consumer Expenditure Survey. The Census Bureau handles the field work, gathering info from over 50,000 interviews and diaries. The US BLS then compiles the data into the final reports.
NOTE #1: In this report we use the term Consumer Unit (CU). This is often used interchangeably with Household. They are “close” in meaning. However, a CU indicates independent decision making on living expenditures. You can have more than one CU in a household – boarders, roommates…As a result, there are a few more CUs than H/Hs.
NOTE #2: In March of 2016, Millennials surpassed Baby Boomers in the number of individuals. However, this report deals with Financially Independent Consumer Units. The Millennials still have a lot of ground to make up!
Let’s get started by defining the generations….
- Millennials: Born 1981 to 1997; In 2015, age 18 to 34
- Gen X: Born 1965 to 1980; In 2015; age 35 to 50
- Baby Boomers: Born 1946 to 1964; In 2015, age 51 to 69
- Silent Generation: Born 1929 to 1945; In 2015, age 70 to 86
- Greatest Generation: Born before 1928; In 2015, age 87+
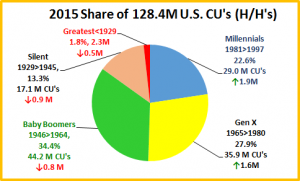
…and then looking at their share of the Total U.S. CU’s:
- Baby Boomers are still the largest number of CU’s at 44+M and 34.4% of the total.
- 3 Oldest Generations are losing CUs primarily due to death or movement to permanent care facilities.
- Millennials and even some Gen Xers, are establishing New CU’s as they gain financial independence.
- Immigration and unfortunately, divorce are also factors in the growing number of Gen X and Millennial CU’s.
Now let’s get to know the Generations a little better by looking at some key CU Characteristics.
- CU Size – CU’s with 2+ people spend more on their pets. The Millennials are already at the national average of 2.5, driven more by their older members. CU size peaks with the 35 to 50 year old Gen Xers and starts a general decline with the Boomers – who still are at 2+ people.
- # Children under 18 – Children are the primary reason for an increased number of people in CU’s. Millennials are just getting started with a family. The presence of young children (and the associated responsibilities and expenses) peaks with the Gen Xers who average 1+ per CU. The number of children drops precipitously starting with the Boomers. However, remember Children over 18 and grandchildren can be a part of the older CU’s.
- # Earners per CU – 2 earner CU’s also generally spend more on their pets. Gen X has the highest average at 1.7 per CU. However, both Millennials and Boomers average about 1.3 per CU. Retired people have also recently been a big pet spending factor so don’t count out the Silents and the older Boomers.
- Homeownership – 80+% of Pet Spending comes from homeowners. A mortgage is also a substantial financial responsibility. Once again the Millennials are just getting started and the bulk of their homeowners are from the 25 to 34 age group. Homeownership doubles for the Gen Xers and they reach the national average. The percentage of Home Owners continues to grow with the Boomers and peaks with the Silent Generation. The oldest Americans, for convenience or necessity, make a substantial move to renting.
- No Mortgage – A mortgage is a substantial financial responsibility over a long period. This weighs the heaviest on Gen Xers and Millennials. Boomers are the first to make a major dent in the Mortgage expense. However, the “real” reduction in this expense doesn’t occur until the 2 oldest generations.
Next we’ll compare them to the National Ave in Income, Spending, Pet Spending and Pet Share of Total $pending
CU National Averages: Income – $69,627; Total Spending – $55,978; Pet Spending – $528.17; Pet Share of Total Spending – 0.944%
- Income peaks with the Gen Xers then starts to decline, although the Boomers are still above average. The big decline starts with the Silents and continues with the Greatest. Both of these groups are 70+ and mostly retired.
- Total Spending also peaks with the Gen Xers and is 50% more than the Millennials. Boomer spending declines about 10% but is again above the average. For the oldest groups, the decline in spending is slower than the drop in income. The Millennial Spending is relatively high considering their income level.
- CU Pet Spending for the Gen Xers is 50% higher than the Millennials but this is not the peak and in fact, doesn’t quite meet the National Average (97%). The top award belongs to the Boomers, with a 43% increase over the Gen Xers and 39% above the National Average. Boomers are the only group spending more than the National average on their Pets. Once again, the spending drops off sharply with the Silents. However, they still spend 28% more than the Millennials. Pet Spending and ownership plummets with the Greatest Gen. (age 87+)
- Pet Share of Total Spending….
- Exceeds 1% with the Silent Generation and Peaks with the Boomers at 1.23%. The income of the Silent has dropped significantly, but so have their responsibilities in terms of children and mortgages. The Boomers have a similar story but their income is still high. Both are now more focused on their Pet “children”.
- Is lowest with the Greatest Generation. However, some have a lifetime commitment to their pet family.
- Is under 0.8% for both Millennials and Gen Xers. The Millennials are buying houses, starting families and careers while they are waiting for their income to “catch up”. There is definite “price pressure” in their decisions. The Gen Xers make and spend the most money. They are reaching the high point in responsibilities to their family and their career. Time and convenience are big issues. Also, even though the percentage of Pet Spending to their total expenditures is only 0.76%, their average CU spending is still the second highest and essentially equal to the national average.
It’s time to look at actual Dollars Spent. We’ll review the Generational spending on Total Pet and each industry segment in terms of share of sales as well as the 2015 performance compared to 2014 starting with Total Pet…
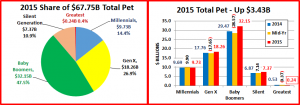
Ave CU Total Pet Spending: $528.17
- The most significant thing regarding “share” is the Boomers’ dominance. Not only do they have the biggest piece of the Pet Industry “pie”, it is 15% larger than #2, Gen X and #3, Millennials combined.
- It is also obvious that at 0.4%, the Greatest Generation is a welcome part of the industry but no longer a factor.
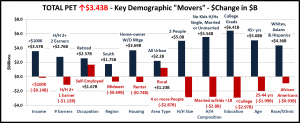
- In terms of 2015 Performance, the Boomers generated 78.1% of the total $3.43B increase. However, every generation, except the Greatest showed an increase so it looks pretty “good” overall. Let’s get specific.
- Boomers – Ave CU spent $733.08 (+$76.58);
- 2015 Pet spending = $32.15B, Up $2.68B (+9.1%)
- 2015 started off badly – Down $0.9B in the first half.
- Then came a huge $3.58B “comeback” in the 2nd half.
- Gen X – Ave CU spent $512.32 (-$9.02);
- 2015 Pet Spending = $18.26B, Up $0.5B (+2.8%)
- The 2015 $ increase came as a result of a 4.9% increase in CU’s.
- 1st half Down $0.11B; 2nd half Up $0.61B
- Silent Generation – Ave CU spent $433.60 (+$49.88);
- 2015 Pet Spending = $7.37B, Up $0.5B (+7.3%)
- Overcame a 9% drop in CU’s.
- Basically, equal increases in both halves.
- +$0.27B (1st) and +$0.23B (2nd)
- Millennials – Ave CU spent $337.30 (-$22.75);
- 2015 Pet Spending = $9.73B, Up $0.04B (+0.4%)
- Without a 7.3% increase in CU’s, spending is down!
- Sales in 1st half Up $0.21B; Down $0.17B in the 2nd
- Greatest Generation – Ave CU spent $107.04 (-$103.31);
- 2015 Pet Spending= $0.24B, Down $0.29B (-54.3%)
The Total Spending increase came from Boomers, Gen X and the Silent Generation (ages 35 to 70) Now Pet Food..
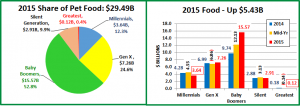
Ave CU Pet Food Spending: $230.06
- Baby Boomers spend more on Pet Food (and treats) than all other Generations combined.
- Gen X has 24% more CU’s than the Millennials but spent twice as much on Pet Food.
- Millennials spent over $0.6B less on Food in 2015.
- Boomers – Ave CU spent $355.98 (+$139.08);
- 2015 Food spending= $15.57B, Up $5.83B (+59.9%)
- Decision to upgrade Food drove both the Food and Industry increases.
- 1st half (+$2.39B); 2nd half (+$3.44B)
- Gen X – Ave CU spent $204.44 (-$0.44);
- 2015 Food spending= $7.26B, Up $0.27B (+3.8%)
- 2015 $ increase came solely from an 4.9% increase in CU’s.
- 1st half ( -$0.13B); 2nd half (+0.4B)
- Silent Generation – Ave CU spent $171.57 (+$11.30);
- 2015 Food spending $2.91B, Up $0.03B (+1.0%)
- 7% Increase in CU spending impacted by 4.9% drop in CU’s.
- 1st half (+0.25B); 2nd half (-0.22B)
- Millennials – Ave CU spent $126.57 (-$31.95);
- 2015 Food Spending $3.64B, Down $0.64B (-15.0%)
- Older members upgraded Food in late 2014, then pulled back in 2015.
- 1st half (+0.27B); 2nd half (-$0.91B)
- Greatest Generation – Ave CU spent $54.36 (-$16.60);
- 2015 Food spending= $0.12B, Down $0.06B (-31.8%)
2015 Increase driven by Baby Boomers with a little help from Gen X and Silents (Ages 35-70) Now on to Supplies..
Ave CU Pet Supplies Spending: $115.97
- Boomers still have the largest share but the “race” with Gen X is much closer – only a 30% lead.
- Millennials – Ave CU spent $111.19 (-$1.00);
- 2015 Supplies spending= $3.23B, Up $0.2B (+6.3%)
- Increase is from 7.9% more CU’s, but a rare bright spot for Supplies.
- 1st half (-0.18B); 2nd half (+0.38B)
- Baby Boomers – Ave CU spent $134.56 (-$13.70);
- 2015 Supplies spending= $5.94B, Down $0.73B (-10.9%)
- Gen X – Ave CU spent $127.47 (-$32.82);
- 2015 Supplies spending= $4.57B, Down $0.91B (-16.6%)
- Silent Generation – Ave CU spent $62.70 (-$31.51);
- 2015 Supplies spending= $1.07B, Down $0.63B (-36.7%)
- Greatest Generation – Ave CU spent $35.96 (-$5.68);
- 2015 Supplies spending= $0.08B, Down $0.04B (-28.9%)
Comment: CU spending was down in every group. The only “lift” was due to more Millennial CU’s. The trend was so pervasive that we can’t blame the increase in Food spending. We’ll see what happens in 2016. Next, Services…
Ave CU Pet Services Spending: $48.70
- Boomers have the largest share but the spending is evenly split between – age 50 and under /over 50.
- Gen X – Ave CU spent $59.23 (+$12.79);
- 2015 Services spending= $2.12B, Up $0.53B (+33.7%)
- The biggest $ increase of any group.
- 1st half ( +$0.29B); 2nd half (+$0.24B)
- Millennials – Ave CU spent $35.02 (+$8.64);
- 2015 Services spending $1.02B, Up $0.31B (+42.4%)
- A 42% increase – Millennials got “on board” with Services in 2015.
- 1st half (+0.08B); 2nd half (+$0.23B)
- Boomers – Ave CU spent $55.98 (-$3.49);
- 2015 Services spending= $2.47B, Down $0.21B (-7.6%)
- A small decrease, primarily in the first half of 2015.
- 1st half (-$0.17B); 2nd half (-$0.04B)
- Silent Generation – Ave CU spent $35.93 (-$0.79);
- 2015 Services spending $0.61B, Down $0.05B (-7.0%)
- Most of the decrease came from 4.9% fewer CU’s.
- 1st half (No Change); 2nd half (-0.05B)
- Greatest Generation – Ave CU spent $12.15 (-$0.82);
- 2015 Services spending= $0.03B, Down $0.01B (-22.9%)
The increase was completely driven by the Gen Xers and Millennials as they opted for the convenience that Pet Services brought to their hectic lives. The Over 50 crowd was down…slightly. The final segment is Veterinary…
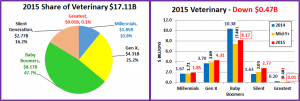
Ave CU Veterinary Services Spending: $133.44
- Although they lost share, Boomers are still very dominant in this industry segment
- Veterinary spending somewhat “mirrors” human medical spending. As we age, we become more conscious of the need for regular medical visits and usually require more services. We transfer this feeling to our companion animals. One result is that 64% of all Veterinary spending is done by the over 50 age group.
- Boomers – Ave CU spent $186.56 (-$45.32);
- 2015 Veterinary spending= $8.17B, Down $2.21B (-21.3%)
- Decision to upgrade Food undoubtedly contributed to the $3B first half drop in spending. A big comeback in the second half may indicate that many services were just delayed.
- 1st half (-$2.98B); 2nd half (+$0.77B)
- Silent Generation – Ave CU spent $163.40 (+$70.88);
- 2015 Veterinary spending $2.77B, Up $1.14B (+70.0%)
- A $1.1B increase shows a lifetime commitment by these 70+ yr olds.
- 1st half (+0.38B); 2nd half (+$0.76B)
- Gen X – Ave CU spent $121.19 (+$11.45);
- 2015 Veterinary spending= $4.31B, Up $0.61B (+16.4%)
- Consistent, strong increase – a good sign for Gen Xers as Pet Parents.
- 1st half ( +$0.19B); 2nd half (+0.42B)
- Millennials – Ave CU spent $64.51 (+$1.55);
- 2015 Veterinary Spending $1.85B, Up $0.18B (+11.0%)
- An indication of a growing commitment to their Pet family.
- 1st half (+0.04B); 2nd half (+$0.14B)
- Greatest Generation– Ave CU spent $4.57 (-$80.22);
- 2015 Veterinary spending= $0.01B, Down $0.19B (-94.8%)
Gen X, Millennials and the Silents all had strong increases, but they couldn’t overcome the $2.2B drop in Boomers’ spending. It appears that the Veterinary segment paid a price for the Boomers’ decision to upgrade their Pet Food.
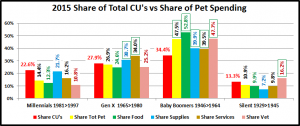
One last chart to compare the share of spending to the share of total CU’s. How did the generations perform?
- The Boomers “earned their space” in every Industry segment. Gen X was close in all but only made it in Supplies & Services. The Silents performed well in Vet. Millennials…close in Supplies, but are still getting “up to speed”.
- Note: The older 2 generations’ best performance was in the “need” segments – Food and Veterinary. The 2 younger groups were at their best in the more “discretionary” segments – Supplies and Services. Curious…???
Comments
The Greatest Generation – They aren’t called the “Greatest” for no reason. They literally helped change the world. However, with their youngest member now 87 years old, their time as Pet Parents is inexorably coming to an end.
The Silent Generation – At 70+ years old, their lifetime commitment to their companion animals remains strong. This is immediately apparent when one sees their $1 billion dollar increase in Veterinary spending and the fact that they spend over 1% of their total expenditures on their pets – second only to the Baby Boomers.
Baby Boomers – They have been the consumer group most responsible for the spectacular growth of the Pet Industry. They were the first “Pet Parents” and that commitment remains as strong today as it was over 30 years ago. They are the leading spenders in every segment, especially those most associated with the wellbeing of our companion animals – Food and Veterinary. Even today, they are still making the informed, expensive decisions to do what is best for their pet family. In 2015 they made the choice to “upgrade” their Pet Food. The cost…over $5B. Admittedly, their spending in other segments suffered somewhat, but may already be bouncing back. Amazing!
Gen X – They currently make and spend the most money overall and their Pet Spending per CU is close to or above the national average in all segments. The next five years will be critical. Their children will begin to “leave the nest”, which usually results in additional focus and spending on their pet family, which is still at home. We’ll see.
Millennials – Their every move is subject to speculation. Everyone is concerned about the future and there is no doubt that they are the future. We tend to lump all Millennials together. However, life, including spending behavior, progresses in stages. A large percentage of this group is still in the earliest stages of “building” their lives. We need to provide them with the information, support and products to fulfill their wants and needs. Then…be patient. Count on the extraordinary appeal and allure of companion animals. In a phrase, “Bet on Pets!”
I welcome your questions and comments!


