U.S. PET SPENDING: COMPARING GENERATIONS – “BOOMERS” WIN!
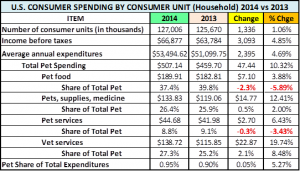
U.S. Consumers spent $6.8 Trillion dollars in 2014. Of this huge sum 0.95%, $64.3B was on our companion animals. In our recent posts, we have started to look at the key demographics behind “who” is spending the money. By looking deeper, all of the industry participants can better target their products and marketing efforts to maintain and gain retail sales…keep the industry strong and growing.
In terms of demographics, nothing has a higher profile in the media than comparing the actions between generations. How do the Millennials compare to the Baby Boomers? What’s happening with Generation X? These are valid questions and the Generation Demographic is the one measure that defines a very specific group of individuals for a lifetime. Emigration, immigration or death can change the mix and of course, marriage and divorce will affect the number of households. However, we can still track how aging, technological changes, economic events, in fact any change in society affects the behavior of a specific group of individuals.
The USBLS which provides us with a variety of helpful business reports, including the CPI and the Consumer Expenditure Survey, just announced an addition to the CE Survey – spending by Generation. The first report is for 2014. It is still officially in the experimental stage, as they fine tune the details. The “official” inclusion in the CE is currently scheduled for 2016. The published version of this CE Report includes over 150 line item details – (2 Pet – Total & Supplies). The “prepublished” version is much more detailed, with over 1500 items including all Pet Industry Segments. Obviously, we looked at the “prepublished” version.
Unfortunately, the data had to be sorted by birth year so it can’t be compared to previous years, which were sorted by age. However, this new report provides an immediate “snapshot” of purchases for an incredibly topical demographic that will become even more valuable as time goes by and we can track changes.
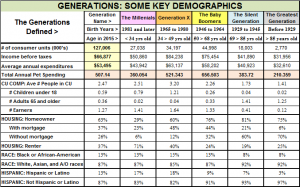
Before we get into the specifics of Pet Spending, let’s look at a few key overall Generational demographics:
Observations
- # of CU’s (H/H’s) – Baby Boomers are by far the largest group. The Millennials will be adding H/H’s as more of them become independent adults but all the others will inevitably decline.
- CU Composition – Other CE reports show that households with children and 2 Earners are both important demographic groups in regard to Pet Spending. Both peak with Gen X. The 2 earner households are relatively strong from Gen X through the Boomers but the “with children H/H” fades with the aging Boomers.
- Housing – Home owners, especially those with mortgages, buy the largest share of Pet Products and Services among the Housing demographic groups. The Millennials are still renting. Home ownership doubles with Gen X but reaches a peak, in fact a plateau, with the Boomers and Older Generations. 75% of Americans over 85 are homeowners and 70% of them have no mortgage!
- Race/Hispanic – The data presented from this particular survey is very simplistic. In terms of Hispanics, you can clearly see the radical increase in Gen X due to changes in Immigration rules in 1965 and a significantly higher birthrate for this group. In regard to African Americans, a huge migration from the South began in 1940, first driven by job opportunities relating to WWII. The effect of improved economics and an increased birthrate shows up in the Baby Boomers. The Racial and Hispanic demographics are relevant to the Pet Industry as African Americans and individuals of Hispanic descent spend an average of 60+% less per household on their pets than White, non-Hispanics. Income is a factor but such a large disparity also indicates significantly fewer “Pet” H/H’s. This is a situation which should be researched further.
- Spending – Let’s start the discussion. Here is a summary of 2014 U.S. Pet Spending:
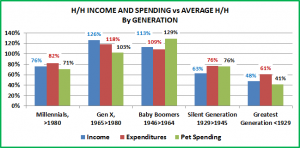
The chart below shows how each generation compares to the U.S. Consumer Unit (H/H) average in terms of gross income, annual expenditures and pet spending.
Observations
- Note: You will see similarities to our recent post on Age Groups. However, it’s not an exact match as the Age Groups fall into 10 year increments while Generations range from 16 to 19 years.
- Income: Gross Income peaks with Gen X but is still strong with the Boomers. The previous generations are into retirement and the Millennials are still building.
- Expenditures: Gen X and the Boomers are pushing the National average up. However, the expenditures of both the earlier and later generations are significant contributions in relation to their lower incomes.
- Pet Expenditures: The “Pet” Boomers are obviously the biggest spenders. However, you can see the importance of companion animals across the generations, even after age 85.
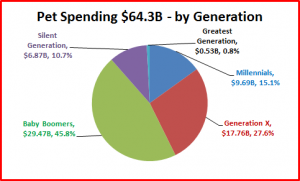
Let’s translate averages into total Pet $. Here’s how much each Generation spent on their Pets in 2014.
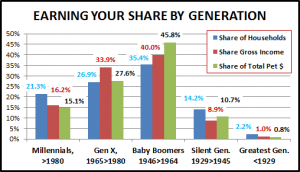
Now, let’s put each group’s spending into perspective with their…
- Share of Households (127 Million Total)
- Share of Gross Income ($8.5 Trillion Total)
- Share of Pet Spending ($64.3 Billion Total)
Observations
- The Baby Boomers are still the major market for the Pet Industry. They lead the pack in all categories…number of H/H’s, gross income and they spend it on their Pets.
- Generation X is the only other group “earning their share” of Pet Spending vs number of H/H’s.
- The Pet Spending of Millennials is lagging, considering their numbers, but is actually pretty good in relation to their income.
- While their share of Pet spending is not equal to their H/H numbers, the contribution of the older generations is excellent considering their significantly reduced income.
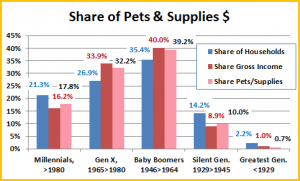
Let’s look a little deeper…at spending by Industry Segment. First: Food & Supplies…Comments will follow the graphs.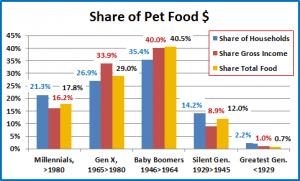
Food and Supplies Observations
- Both these segments are very similar to the Total Pet Spending Chart.
- Food – Spending in this “necessity” segment shows a commitment across all groups. The most encouraging observation is the fact that the Millennials share is higher than their share of Total Pet. They are adding pets to their “families”.
- Supplies – The Supply Segment does have more “discretionary” spending items and the group with the highest income, Gen X, buys more….but still not as much as the Boomers.
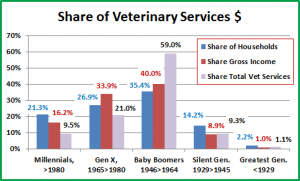
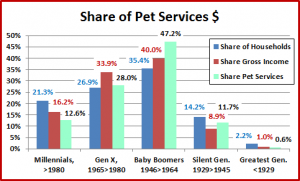
Now, The Service Segments
Veterinary and Pet Services Observations
- Veterinary – A “need” segment, increasing prices have become a major factor to everyone but… Boomers, who spend an incredible 59% of the total. However, 80% of the spending comes from them and Gen X which represents 62% of the households but 74% of the total U.S. income.
- Services – Convenience, Need & Cost. Once again, Baby Boomers and Gen X are the leaders with 75%. However, there is a bit of an “uptick” in the “retired” Silent Generation.
Overview By Generation
- The Greatest Generation – (Born: <1929) – With the youngest members 85 years old, pet ownership and spending have significantly declined in this group. However, they still spend 0.65% of all their annual H/H expenditures on their pets.
- The Silent Generation – (Born: 1929>1945) This Group is over 70 years old. Their income and expenditures have fallen but not their commitment to their pets. Their share of spending in every Pet Segment exceeds their share of income. In fact, 0.94% of their H/H spending is on their pets. (National ave is 0.95%)
- Baby Boomers – (1946>1964) Accounting for 45% of all U.S. Pet Spending, this group could be called the Pet Boomers as they have largely driven the spectacular growth of the Pet Industry. They lead the way in every Industry Segment, including a spectacular 59% of Total Veterinary Spending. Boomers spend 1.19% of their total household spending on their Pets. However, they are starting to retire and income will fall. Based upon what we have seen from the Silent Generation, the Boomers will continue to spend a significant percentage of their income on their Pets but their overall market share will inevitably begin to fall.
- Generation X – This group has the second largest share of Pet Spending $ at 26.7%. However, they have 24% fewer households and spend Pet $ at a 21% slower rate than the Boomers. Their Total Pet Spending is $12B (40%) less than the Boomers….Now, the good news. They are just approaching the “prime” pet spending age (55>64). Their Pet Spending should steadily increase for at least the next 15 years. Because they are a significantly smaller group, they will probably not match the dominance of the Boomers but they are on track to take over the #1 position.
- Millennials (Born: 1980>) – They are justifiably getting a lot of media attention because they are the future of the consumer market. Guess right on their needs and wants and your future success is assured. Guess wrong and… The final birth year has not yet been set. My vote would be for 1999. That would make their span the same as the Boomers and start the next generation with the start of a new century. They still have “growing up” to do before they all become independent adults. Their Pet Spending is not yet equal to their share of households but there are encouraging signs. Their annual H/H spending on Food is 83% of the national average and their share of the Total Food expenditures is greater than their share of Total Gross Income. Pets are a current and growing commitment. Their spending on the Service segments is well below average but cost is definitely a factor….And, remember they don’t even start to reach the peak age for pet spending for over 20 years.
Some Final Thoughts
The Baby Boomers truly are the major source for the current and past success of the Pet Industry. Gen X and The Millennials seemed to be well positioned to ultimately take their turn at #1. However, it is critically important to transition the Boomers into retirement. Income will become an issue so we need to encourage their spending with …products designed to meet the needs of Senior Pet Parents…Senior discounts. This Demographic view also shows that a commitment to pets spans all the current generations…a lifetime commitment.
One question is sure to come up. “Just what is the term of years for each Generation?” The years used by the USBLS come from PEW Research, a well-respected, non-partisan “fact tank”. I have read their rationale and it makes sense, but there is no shortage of opinions on this issue.
As we said, this report is still in the process of being revised and finalized. The USBLS has mentioned the possibility of making the data available by individual birth year. This would be a huge amount of data but one could build reports to exactly match up with other generational research efforts.
I look forward to their next report. Hopefully, we will then be able to begin to track movement in the spending of the Generations.
A detailed Appendix on Pet Spending by Generation is available through the link below. Just click on the button to download and save the file as a PDF. If you would like this in Excel format, send me an e-mail request.
[button link=”https://petbusinessprofessor.com/wp-content/uploads/2015/12/PetSpendingByGeneration.pdf” type=”icon” newwindow=”yes”] Download Data (PDF)[/button]

