Retail Channel Migration in the U.S. – Consumers are on the move!
We are all familiar with the reality of migration in the world around us. Massive flocks of birds fly south for the winter. Huge herds of herbivores migrate across the plains of Africa. Much of the population of North America came as a result of migration from other parts of the world. Why? The reason is ultimately the same – both people and animals were seeking survival, opportunity…a better way.
On a smaller stage, consumers exercise the same behavior in the “Retail World”. They “migrate” between retail channels to find a better answer for their “consumer needs”. Thankfully, it is generally not a matter of survival but rather:
- Value = Quality + Price (*Note: In some cases value can be filling an emotional need. This could even be a matter of “prestige” or fad and is often short-lived)
- Convenience – In today’s hectic world any product or type of outlet that makes life or shopping easier has a strong appeal.
- Selection. – Regardless of product category, Americans want choices.
The change can also be the result of technological advances. There is no doubt that computers, the internet and ultimately smart phones have literally changed the environment that we live in and have radically affected consumer behavior.
As I researched this article, I was stunned by the changes in my lifetime.
- Department stores were “it” when I was young. Sears, Macy’s, J.C. Penny’s and regional chains like Marshall Fields – This is where America shopped. In 1977 Department stores accounted for 10.7% of all retail sales in the U.S. – including Auto, restaurants and gas stations – everything. They had the highest per store volume – $8.7M – of any retail activity. In 2013, their share of retail was less than the $ Stores – incredible.
- Speaking of $ stores, 50 years ago there were 5 and 10¢ Stores. Ben Franklin, W.T. Grant, Woolworths – this is where I bought comic books and greeting cards. Remember Walmart started out as a Ben Franklin store and morphed into…
- I also remember in the 1970’s there were over 60,000 independent drug stores. Then came the rise of regional chains which became consolidated into a few national chains. In between, someone got the idea of putting a pharmacy in supermarkets…and clubs…and SuperCenters (another brilliant idea). The result is that there are about 3 national drug chains and still 20,000 independent stores. However, the indies are all in markets with a population of under 20,000.
You get the idea. We’ll take a look at the migration of the U.S. consumer between channels. We won’t go back 50 years – just to 1992. The data is courtesy of the U.S. Census Bureau.
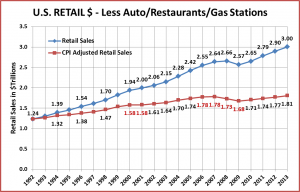
First, let’s look at the whole retail pie, before we see how it is sliced up! The Total U.S. Retail market in 2013 was over $5 Trillion. For this study, I have cut out certain segments which don’t relate to most consumer products, especially Pet Food and Supplies. I have removed Auto Vehicle Dealers and Parts stores, Restaurants and Gas Stations. The result is still huge – $3 Trillion in 2013 and is conducive to more valid comparisons. I also put in a line which is adjusted for price changes – up 64.7% since 1992.
- Total Growth 1992 to 2013
- Up $1.76 Trillion (+141.9%)
- Average Annual growth rate = +4.3%
- Real Growth 1992 to 2013 (Adjusted for price changes – CPI)
- Up $.57 Trillion (+46.0%)
- Average Annual growth rate = +1.8%
You can see that more than half of the growth comes from increased prices. The buying power of the 2013 Dollar was 60.7% of the 1992 Dollar.
The Adjusted “line” gives a “behind the scenes” picture, especially regarding the major recession. Total Retail sales didn’t drop until 2009. However, you can see that the problem started 2 years earlier when the amount purchased in 2007 was just equal to 2006. Consumers actually started buying less in 2008, not 2009.
In terms of recovery, the “real” recovery didn’t occur until 2013, when we finally got back to the level of purchases made in 2006 and 2007. This took 6 years…not 2 years, which is the time frame for full retail $.
We also had a flat spot in 2001, when price adjusted sales just matched 2000. Thankfully, sales started a slow rise again in 2002.
Now that we have the overall picture, let’s take a look at the individual channels.
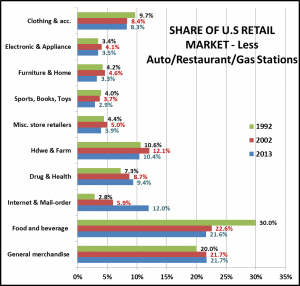
The chart below shows 10 key channels and their share of the U.S. Retail Market in 1992, 2002 and 2013. The data is available annually but we have pared it down to make it a little more digestible and still show any migrating trends.
Note: Channels can actually increase sales but lose market share because they are not keeping up with the overall marketplace. Share seems to be the best way to look at the competition for the U.S. Retail $.
There will be observations about each of the channels in the chart. However, consider the top 3…
- In 1992 – Grocery, Gen Merchandise, Hdwe & Farm
- In 2002 – Grocery, Gen Merchandise, Hdwe & Farm – The same order, but a battle for #1.
- In 2012 – Gen Merchandise, Grocery, Internet/Mail-order- GM edges out Groc for #1; Internet/Mail comes out of nowhere and knocks out Hdwe & Farm to win the “bronze”.
Now let’s look at the trends in the individual channels.
TRENDS IN KEY U.S. RETAIL CHANNELS 1992 > 2013
- Clothing and Accessory Stores – They have lost 14% in market share in a slow decline since 1992. This has flattened out and they have actually gained some traction since the recession. This is being driven by the Value Clothing Stores like T.J. Maxx, Marshall’s and Ross. They actually have dipped their toes into Pet on a limited basis.
- Electronic and Appliance Stores – This channel reached its peak in the years surrounding the Millennium. Many of their products are now being poached by different channels. The recent bankruptcy of Radio Shack does not bode well for this segment.
- Furniture & Home Furnishings – After 10 years of market share gains, this channel lost momentum and sales turned sharply downward during the recession. Current market share is being maintained due to home products stores like Home Goods, Bed Bath & Beyond, etc.
- Sporting Goods, Hobby, Book & Toy – Overall, this channel is headed down. Technological changes have seriously hurt books stores. Toys retailers have seen their products commoditized and deflating prices have caused consumers to migrate to other channels – SuperCenters, Discount/Value Stores and the internet. Sporting Goods stores are the only bright spot. They account for 83% of the sales in this channel and have actually increased their small market share by 16% since 1992.
- Miscellaneous Stores – This is a mixed bag which includes gift, office supply and Pet Stores. Pet represents about 20% of the total outlets. This Channel actually reached its peak market share in 1997 and has been falling ever since. Sales and share both turned sharply down since the recession. We take a closer look at Pet Stores in a separate report on the specific migration of Pet Products.
- Hardware & Farm Stores – This Channel had steady growth until 2005 when sales flattened out, then turned down during the recession. The Farm segment has shown recent strength and has stopped the downward slide of the whole channel.
- Drug and Health – This channel had steady growth until it reached its peak in 2009, at the depth of the recession. It then fell slightly and has essentially flattened out. About 60% of this channel’s sales come from Rx sales so it is much more dependent on 1 commodity than other channels.
- Internet & Mail-order – A true success story. Steady growth in sales and share, year after year. Driven by the internet, this channel has taken market share from most segments with its combination of value and selection. Grocery is probably the least affected as food is not a major category…yet. It has been especially hard on “specialty” retailers in a myriad of product categories.
- Food & Beverage – This channel is almost all grocery with Supermarkets the vast majority of the business. This channel has been #1 since they began these surveys…until 2013, when it was edged out by General Merchandise stores. The drop since 1992 has been precipitous – 31.3%. Where did all these consumers go? The only other channel which gained that much was the internet…and they didn’t go there. The answer is they went to other Supermarkets – SuperCenter/Club stores are general merchandise stores which include a full service Supermarket.
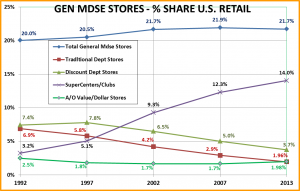
- General Merchandise – This segment is now the largest channel in the U.S. Retail Market…yet is remarkably steady – flat in share since 2002 – up only 8.5% since 1992. This is a more complicated situation and requires a closer look.
Let’s take a look “inside” the General Merchandise Channel to specifically see what’s happening.
- Traditional Department Stores – This channel has consistently lost market share every year, 71% since 1992…and an astounding 88% since 1977. In 2013, their share dropped below the $/Value Stores. This would have been beyond comprehension back in 1977.
- Value Dollar Stores – This segment began as the 5 & 10¢ Stores then a few years ago morphed into the current Value Store Concepts. They have a small market share – about 2%, but it has started to grow, up 17% since 2007. Most of this gain has occurred since the recession as consumers look for value in a store with a convenient “footprint”.
- Discount Department Stores – This is the channel that started the Department Stores on their decades long fall. They actually reached their peak in 1995 and have been dropping ever since. Their market share has dropped more than 50% since 1997.
- SuperCenters/Clubs – Both of these stores combine a Supermarket with a Discount Store. They offer Value and in the case of SuperCenters, a large selection. Consumers must shop for groceries and bundling this with a wide array of general merchandise items has resulted in a 337% increase in market share. Where did the Supermarket business go – right here. Of note, these stores peaked in market share in 2009 and have remained flat or down slightly – about 0.1%, for 4 years.
Overall – This channel has only 1 success story. SuperCenter/Clubs gained 10.8 points in market share since 1992. The other segments are down 9.1 pts. The Value/Dollar Stores have turned upward since 2007…but overall the net gain in the channel is only 1.7 pts in market share.
Summary
Like the natural world, the U.S. Retail market is a complex environment with every retailer competing for the same nourishment – the consumer $. Here is a brief summary of our analysis of the migration of the consumer within the U.S. retail market over the past 20+ years and the current situation.
The biggest channels are:
- General Merchandise
- Grocery
- Internet/Mail-order
The ranking may change but these should remain the top 3 for the foreseeable future.
In terms of retail segments, the big consumer winners since 1992 are:
- The Internet/mail-order – Still moving up – driven by internet – no signs of the growth slowing.
- SuperCenters/Clubs – Big but has stopped gaining ground since 2009.
The “small” winners, at least in the current market, are listed below. With the exception of Drug Stores, the others are usually the only positive segment in channels which are trending down.
- Drug Stores – have gained through the years but have limited range in product mix.
- Farm Stores – have shown recent strength and is the largest of these small segments.
- Value/$ stores – the only Gen Mdse store segment actually gaining market share.
- Sporting Goods stores – small market share but gaining…slowly.
- Home Goods stores – the only + in the Furniture/Home channel
- Value Clothing stores – a positive in the sixth largest channel.
Up and then down – Hot product categories generated a “wealth” of “big box” specialty stores in Electronics, Media, Books, Office, Toys, Home, Pet… Technological changes and the allure of Super Centers and the internet have lessened their consumer appeal and in some cases virtually killed these outlets. Big Box Retailers require high levels of consumer store traffic to prosper…or even to survive.
Admittedly, this is a somewhat oversimplified view. There are still individual losers in winning segments and winning retailers in fading segments. We can identify the trends but it comes down to how well the retailer fulfills the consumers’ needs – Value, Convenience and Selection. The great recession has caused Value to come to the forefront. At the same time, technological changes – the internet and smart phones – have made the consumers more knowledgeable and given them a new shopping option.
Sometimes the consumer migration between channels has an even larger impact on society. Consider:
- Indoor shopping malls had become a major gathering place. They were invariably “anchored” by department stores. With department stores fading, whole malls are shutting down.
- Perhaps the single smartest “recent” decision in U.S. Retail was the commitment to build Super Centers. However, grocery items have incredibly low margins. Expanding discount stores to accommodate a huge amount of low margin items required the retailers to push the general merchandise suppliers for radical price reductions. These reductions were often not possible with U.S. manufacturing costs so they looked first to Mexico and ultimately to the Far East in order to stay on the shelf – a big impact on the whole world.
Consumer migration is ongoing and always evolving. Retailers must recognize the “drivers” and be prepared to adapt to better meet consumer needs.
In our next post: we’ll look at the retail migration of U.S. Pet Parents.


