2022 U.S. Pet Spending by Generation – Gen X Stays on Top!
In 2022 Americans spent $102.71B on our companion animals, 1.05% of $9.79T in total expenditures. Pet Spending was up $2.73B (+2.7%), much less than the $16.23B in 2021. In 2020 Consumers focused on the necessary segments – Food and Veterinary, including a Food buying binge. The discretionary segments, Supplies and Services, suffered until 2021 when Food $ fell but all other segments had record increases. In 2022, Supplies & Veterinary $ fell but Food spending grew by 12.5% and Services set a new record. This mixed performance produced the small 2.7% lift in Total Pet $.
In this report we will compare Pet Spending in 2022 vs 2021 for the most popular demographic measurement – by Generation. We will also include historical data going back to 2019 when Gen Z first had enough CUs to be recognized as a separate segment. All data comes from the US BLS Consumer Expenditure Survey.
We’ll start by defining the generations and looking at their share of U.S. Consumer Units (CUs are basically Households)
GENERATIONS DEFINED
Gen Z: Born after 1996
In 2022, Age 25 or less
Millennials: Born 1981 to 1996
In 2022, Age 26 to 41
Gen X: Born 1965 to 1980
In 2022, Age 42 to 57
Baby Boomers: Born 1946 to 1964
In 2022 Age 58 to 76
Silent/Greatest: Born before 1946
In 2022, Age 77+

- Baby Boomers still have the largest number of CU’s at 43.5M and 32.4% of the total. They had a slight decrease in 2022 and generally have been losing ground. In fact, they have 1.7M fewer CU’s than in 2016.
- The Oldest Generations will continue to lose CUs primarily due to death or movement to permanent care facilities.
- Gen X has the second most CUs and gained a little ground in 2022.
- Millennials have the largest number of individuals, but they rank only third in the number of CU’s.
- Gen Z gained 1.3M CUs as more of these youngsters established independent households.
Now let’s look at some key CU Characteristics (Note: Nationally, there were no changes from 2021.)
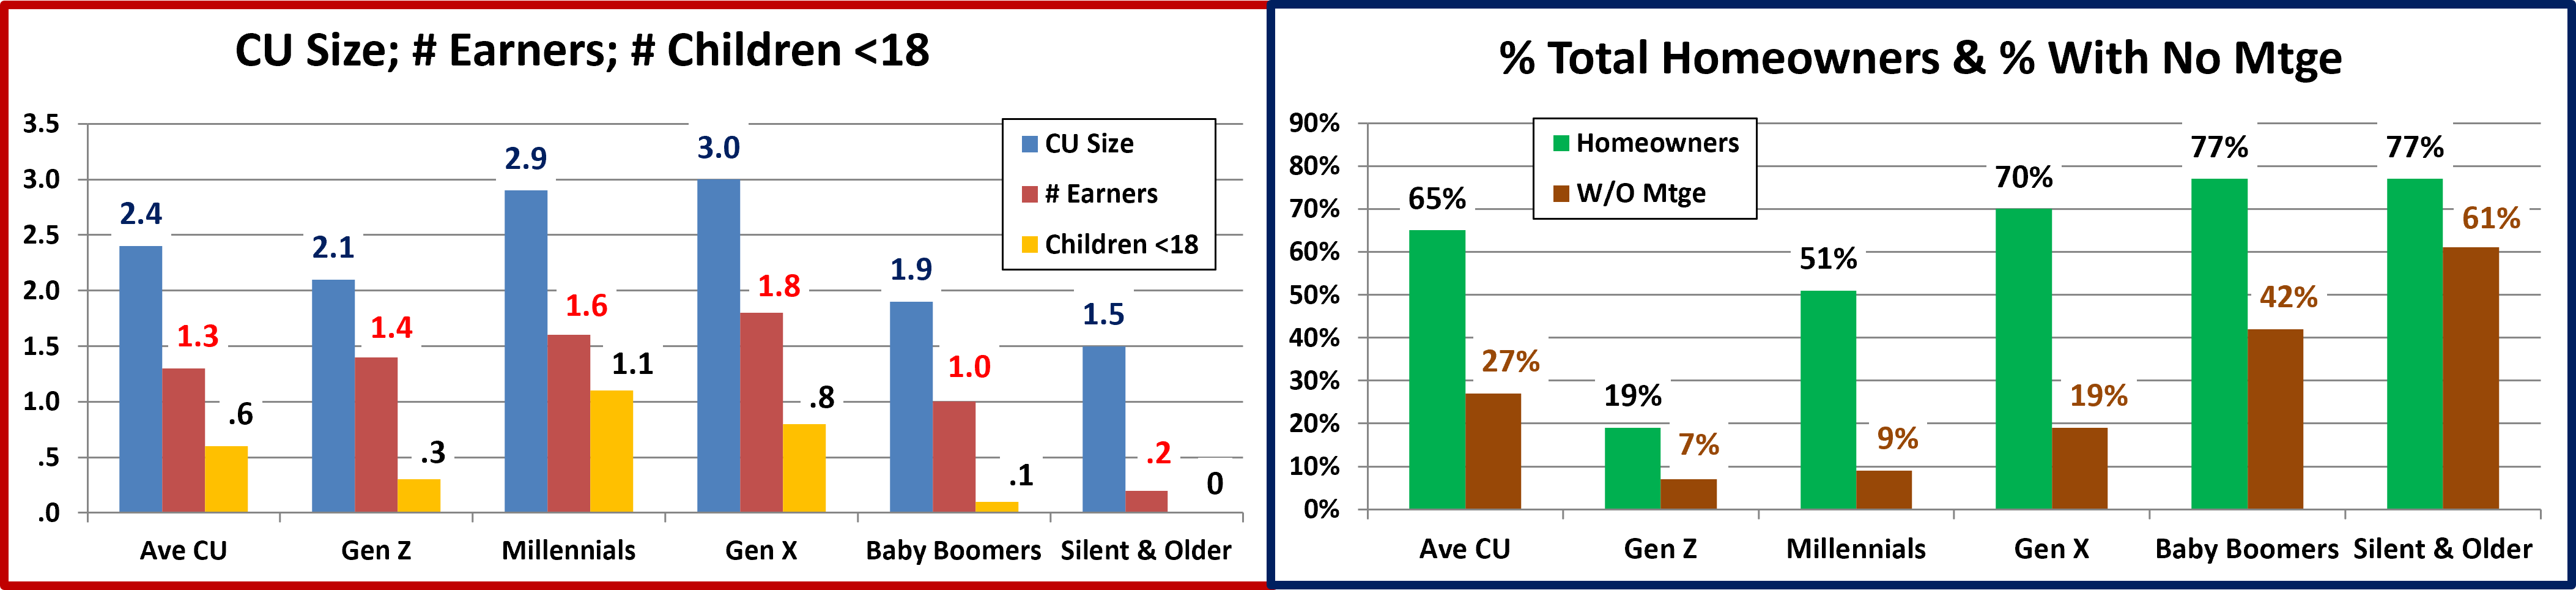
# Children: No Changes; CU size: Down for Boomers; # Earners: Millennials & Gen X up, Gen Z down; Homeownership: Up for Gen X & younger; No Mtge: Up for Gen X & Boomers but down for Gen Z & Silent/Greatest.
- CU Size – Nationally, CU size stayed at 2.4. It was 2.5 back in 2020. CUs with 2+ people still account for 69.0% of all U.S. CUs (down from 69.5% in 2021) and 80.8% of pet $ (up from 80.6%) There were fewer 2+ CUs but they spent more on their pets. Millennials and now Gen Z are actively building their households. However, CU size, with all the related responsibilities, still peaks with the Gen Xers and then starts dropping. The Boomers’ CUs fell below 2.0 for the 1st time but the CU size for all other groups was the same as 2021.
- # Children < 18 – 27.0% of U.S. CU’s have children, down from 27.1% and they generate 32.8% of Pet Spending, up slightly from 31.9%. The slight drop in CUs came from families with an oldest child under 6 and Single Parents. The increase in Total Pet Spending was more balanced. Married couples with an oldest child 6>17 spent $2.58B less. All other CUs, with or without children spent more. The net result was CUs with children spent $1.83B more while those without children only increased spending by $0.90B. Overall and in all generations, there was no change in the # of children per CU. Millennials are still the leader and the only generation to average more than 1 child per CU. Gen X is still #2, followed by Gen Z. Boomers fell from 0.2 to 0.1 in 2020. They should stay above zero for a few more years.
- # Earners – Pet spending is often tied to the number of earners in a CU. In 2022, only No Earner 2+ CUs and Single, 1 Earner CUs spent less on their pets. 2+ earner CUs still spent the most and had the biggest increase, +$2.77B. No Earners are usually older and retired. This includes the oldest Boomers and the Silent/Greatest generations.
- Homeownership – Owning and controlling your own space has always been a major factor in increased Pet Ownership and spending. In 2022 homeownership increased slightly to 65.09% from 64.72%. Gen Z, Millennials & Gen X had increases while the oldest groups were stable. The homeowners’ share of Total Pet Spending grew from 80.0% to 81.2%. The increase happened because Homeowners’ Pet Spending increased $3.46B (+4.3%), while Renters’ fell -$0.73B (-3.6%). We should also note that the percentage of homeowners w/no Mtge was unchanged overall and for Millennials. It grew slightly for Gen X & Boomers, but this was offset by small decreases from Gen Z and the Silent/Greatest generations.
- As expected, Gen Z are the most common renters in society. Homeownership by Millennials has moved up to 51% but it is still only 78% of the national average.
- Gen Xers have been above the national avg since 2018 and Homeownership continues to increase with age.
Next, we’ll compare the Generations to the National Avg.:
In Income, Total CU Spending, Total Pet Spending and the Pet Share of Total CU Spending
CU National Avg: Income – $94,003; Total CU Spending – $72,993; Total Pet Spending – $766.20; Pet Share – 1.05%
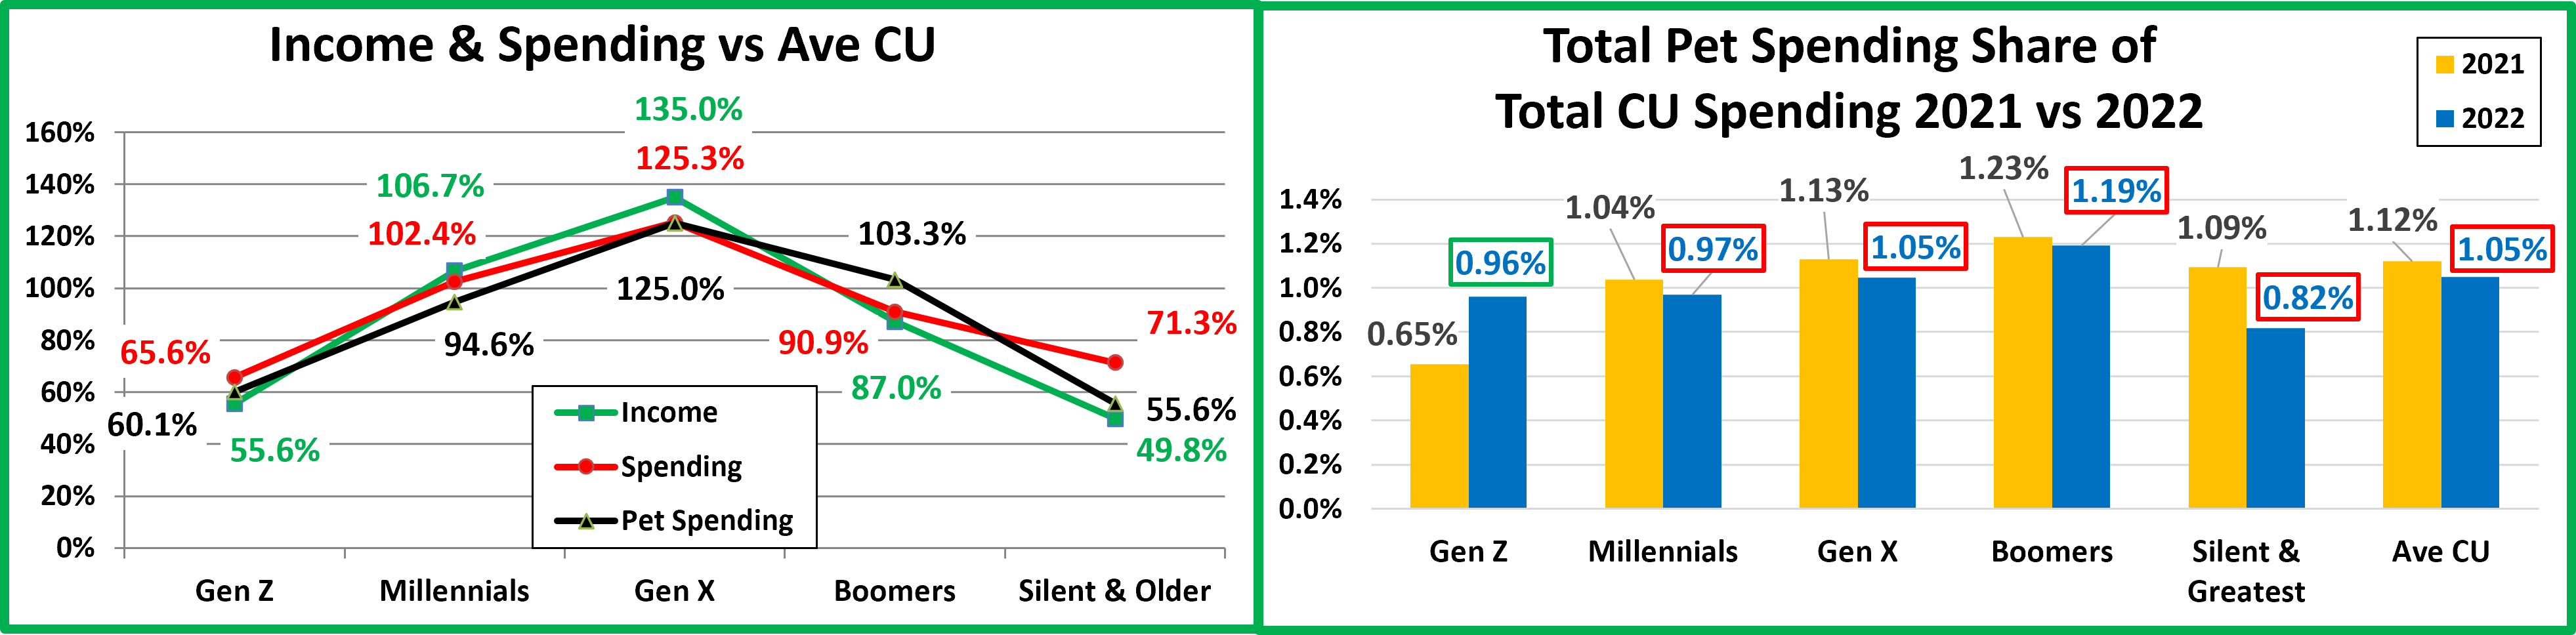
- Income – The Gen Xers are still at the top, but their lead fell slightly. Compared to the national average, the income of Boomers fell but the Silent/Greatest grew. Millennials’ income beat the national average in 2020 and continues to grow. The income of Gen Z passed that of the oldest Americans in 2021 and as expected, continues to grow.
- Total Spending – The Gen Xers make the most and spend the most but it’s not out of line with their income. The Millennials’ increase was slightly below the national lift but overall, it is still above the national average. Like their income, Boomers’ spending fell even further below the national average. Due to a big lift in spending in relation to income, the oldest group is once again deficit spending in relation to their after tax income. With an 8.7% increase in Income and an 8.3% increase in spending, the retail importance of Millennials continues to grow.
- Pet Spending – Again only 2 groups exceeded the national average and Gen X stayed firmly on top. Millennials are still 3rd, 24% below Gen X but only 8% below Boomers. The oldest group replaced Gen Z at the bottom.
- Pet Spending Share of Total Spending – The national number fell from 1.12% to 1.05%. The drop was driven by decreases from all groups but Gen Z. In 2020 Boomers were the only group to spend more than 1% of their total expenditures on their pets. In 2021 only Gen Z spent less than 1% of their total expenditures on their pets. In 2022, only Boomers and Gen X are above 1% but Millennials (0.97%) and Gen Z (0.96%) are very close.
Now, let’s look at Total Pet Spending by Generation in terms of market share as well as the actual annual $ spent for 2019 through 2022. The 2022 numbers are boxed in red (decrease) or green (increase) to note the change from 2021.
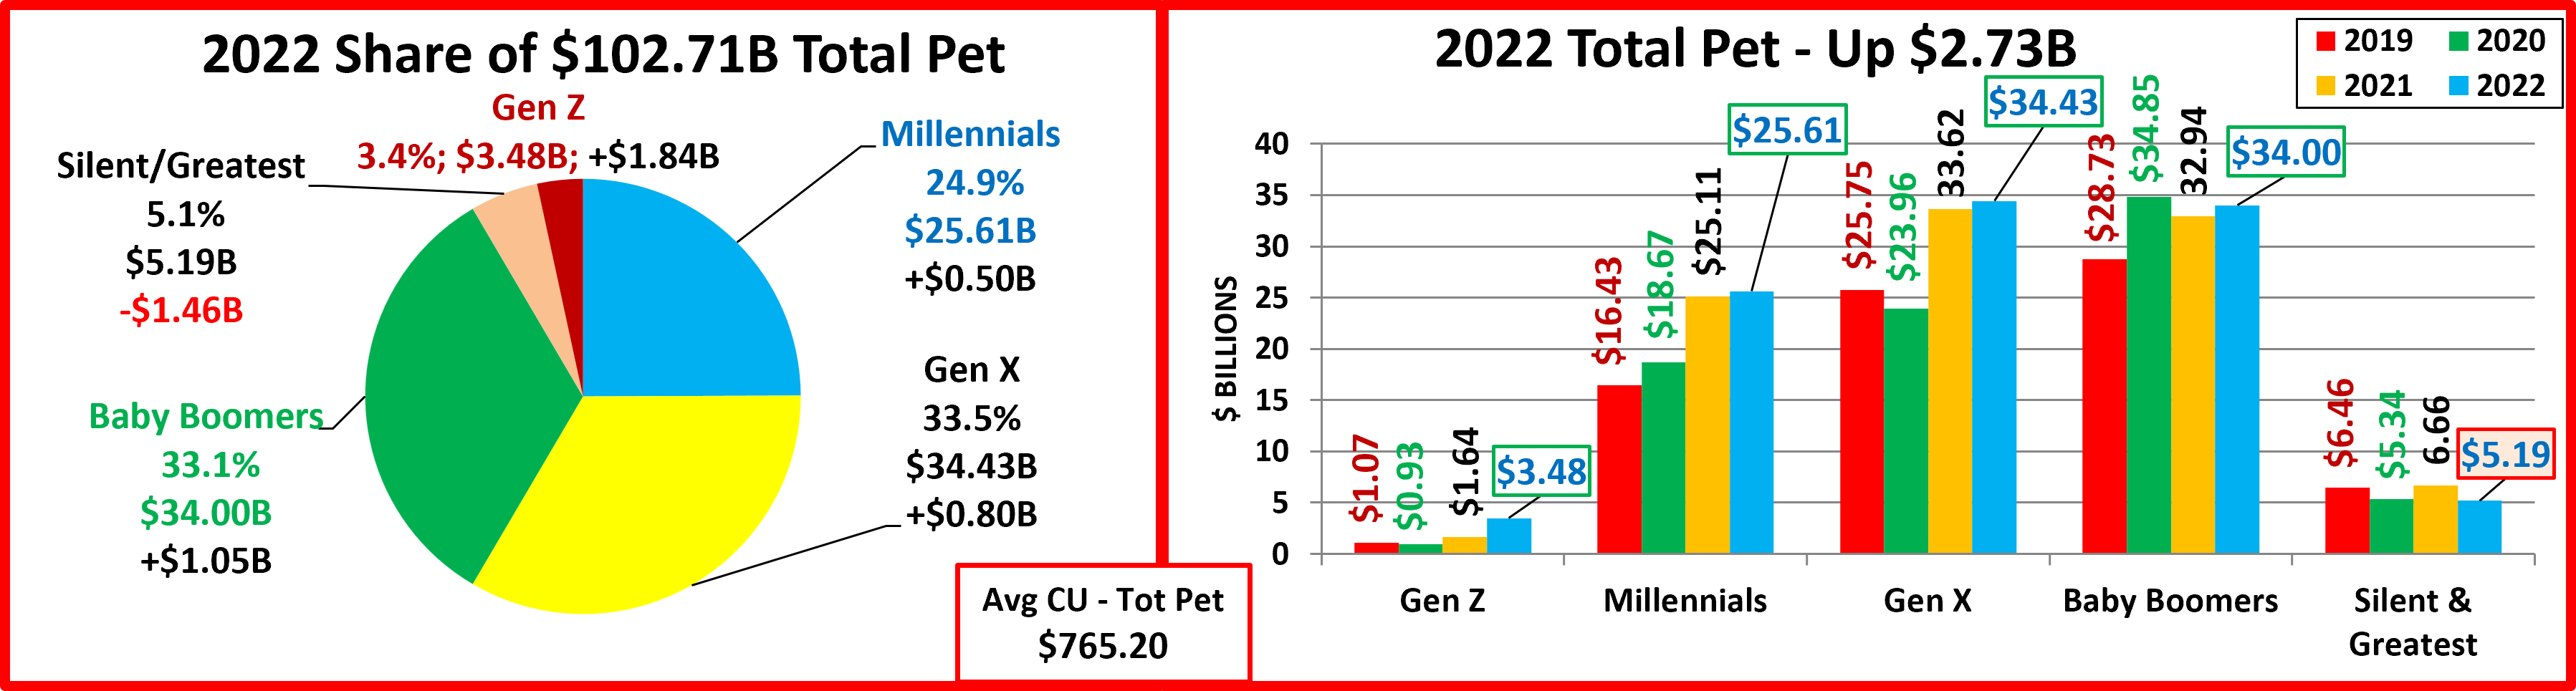
- Gen X kept the top spot in Pet Spending but they only lead Boomers by $0.43B, 1.3%, down from $0.68B, 2.1% in 21.
- There are a variety of spending patterns. Spending in the oldest group is low and had been slowly falling. It surged in 2021 then fell in 2022. Millennials are the only group with consistent annual growth. Gen X had also been growing every year… until 2020. However, they came back strong and moved to the top in 2021 & 2022. The Boomers have been on a rollercoaster ride because they have a strong reaction to trends and outside influences. In 2020 they were the primary group that panic bought Pet Food. In 2021 their spending fell due to a big drop in Food $. In 2022 it increased but is still below 2020. Interestingly, their pattern is the exact opposite of the oldest generation. Gen Z is just getting started. They’re the smallest group and spend the least but their spending more than doubled in 2022.
- In 2022, only the Silent/Greatest generations spent less. Gen Z & Boomers had the biggest lifts.
- Silent/Greatest: -$1.46B. Boomers: +1.05B. Gen X: +0.80B. Millennials: +$0.50B. Gen Z: +$1.84B.
- Gen X – Ave CU spent $957.44 (+$15.57); 2022 Total Pet Spending = $34.43B, Up $0.80B (+2.4%)
- 2019>2022: Up $8.68B Their annual Pet spending growth since 2015 had been strong and consistent until a drop in 2020. In 2021 and 2022 they were #1 in CU Pet spending and Total $. Their spending is up 34% from 2019.
- Boomers – Ave CU spent $791.26 (+$26.58); 2022 Total Pet spending = $34.00B, Up $1.05B (+3.2%)
- 2019>2022: Up $5.27B; They stayed on the roller coaster as spending turned up but it’s still -2.4% vs 2020.
- Millennials – Ave CU spent $724.99 (+$8.48); 2022 Total Pet Spending = $25.61B, Up $0.50B (+2.0%)
- 2019>2022: Up $9.18B; As the income and overall spending of Millennials grows, their pet spending has also grown every year. This younger group has the biggest increase in $ since 2019 of any group, $9.18B, +56%.
- Silent + Greatest – Ave CU spent $425.85 (-$62.65); 2022 Total Pet Spending = $5.19B, Down $1.46B (-22.0%)
- 2019>2022: Down $1.27B; Spending was down, and their CU count continues to fall, -9.5% from 2021 and -28% from 2019.
- Gen Z – Ave CU spent $460.26 (+$188.99); 2022 Total Pet Spending= $3.48B, Up $1.84 (+112.6%)
- 2019>2022: Up $2.41B; They’re just starting to build H/Hs but they “got on board” in Pet Parenting in 22 as Pet spending doubled.
Gen X held onto the top spot in Total Pet Spending, but all but the Silent/Greatest group spent more. Plus, spending took off for Gen Z. Unfortunately, with 8.9% inflation, all other groups really bought less Pet Products & Services in 2022.
Let’s look at the individual segments. First, Pet Food…
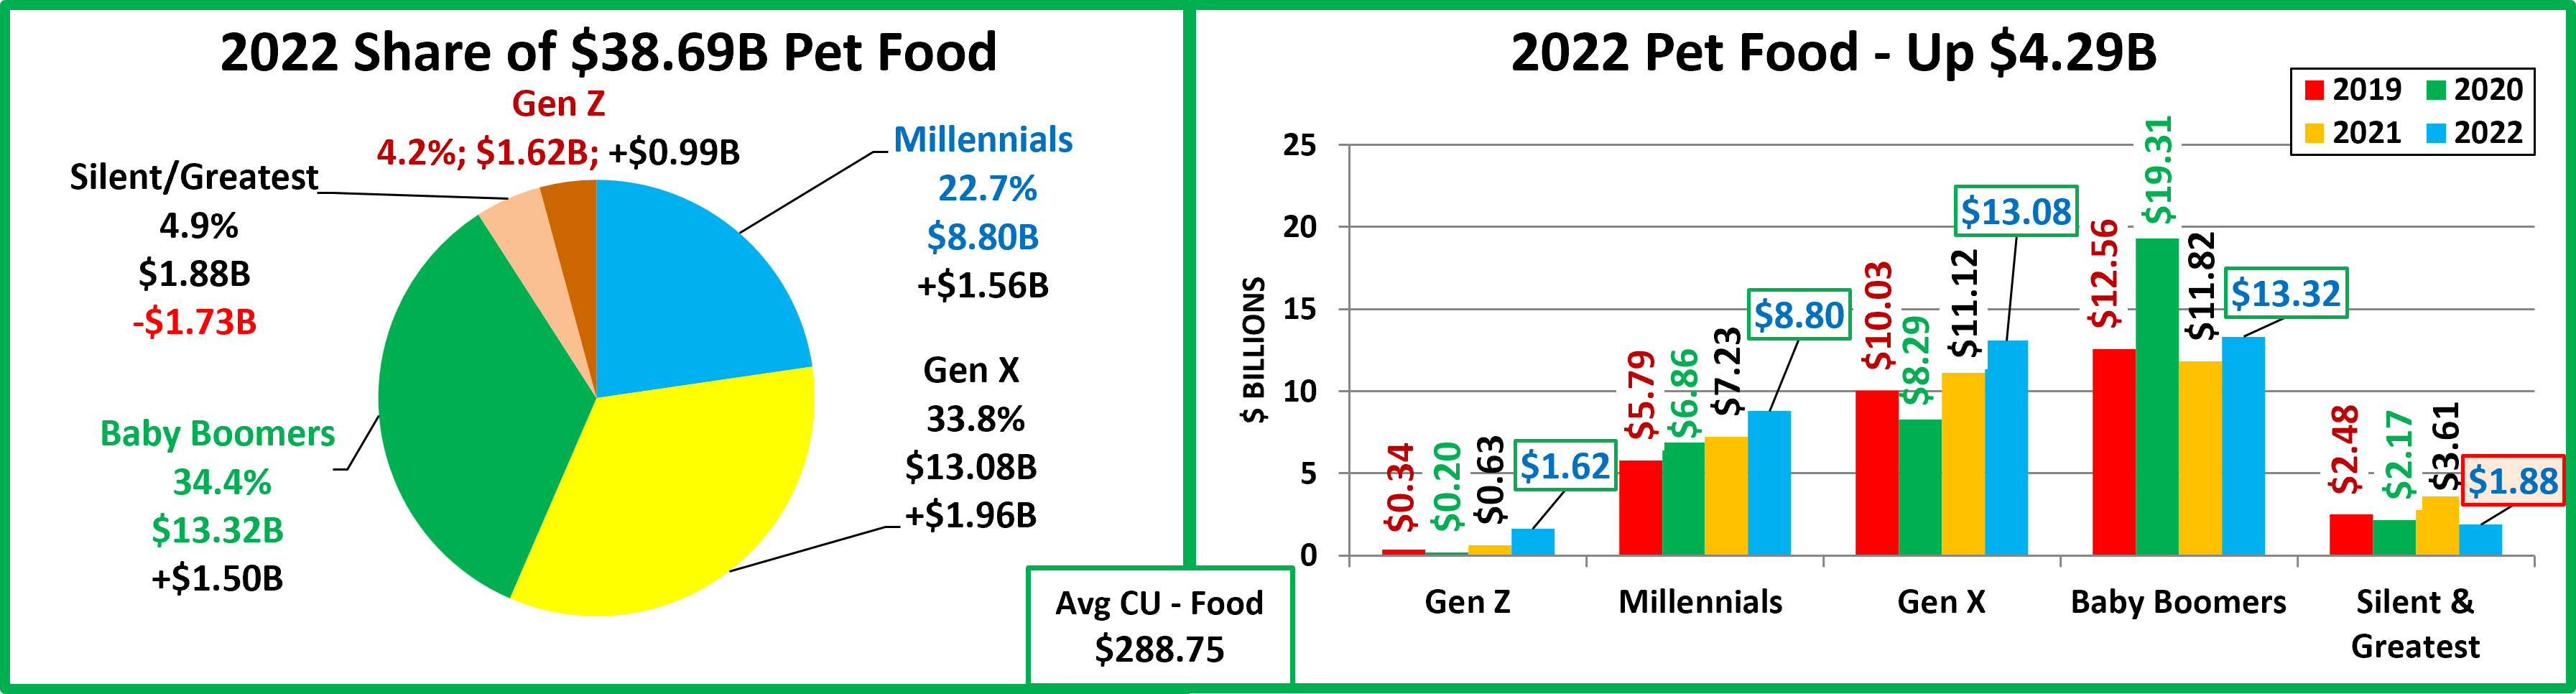
- The Silent/Greatest generations had the only decrease. The Boomer rollercoaster turned up again, but the younger groups have had more consistent growth. Gen Z more than doubled their spending in 2022.
- Since 2014, Millennials’ have led the way in food trends, and they are the only group with an annual increase every year since 2016.
- Boomers – Ave CU spent $315.56 (+35.11); 2022 Pet Food spending = $13.32, Up $1.50B (+12.7%)
- 2019>2022: Up $0.76B They are still #1 in Total Food $. They are below 2020 but finally passed their 2019 $.
- Gen X – Ave CU spent $367.21 (+$60.94); 2022 Pet Food spending = $13.08B, Up $1.96B (+17.6%)
- 2019>2022: Up $3.05B They reacted to the FDA warning by further upgrading their food. No pandemic panic buying. They value shopped. In 2021 and 2022 they spent more and became the leader in CU Pet Food Spending.
- Millennials – Ave CU spent $243.54 (+$37.42); 2022 Pet Food Spending = $8.80B, Up $1.56B (+21.6%)
- 2019>2022: Up $3.01B They are the only group with increased spending every year since 2016. Their income is growing as is a commitment to their pets. They often pioneer food upgrades and the pandemic had little impact.
- Silent/Greatest – Ave CU spent $154.12 (-$107.88); 2022 Pet Food spending = $1.88B, Down $1.73B (-47.9%)
- 2019>2022: Down $0.60B; CU count is falling, and high prices may have caused them to downgrade their food.
- Gen Z – Ave CU spent $206.03 (+$101.59); 2022 Pet Food spending = $1.62B, Up $0.99B (+158.6%)
- 2019>2022: Up $1.28B; Pets moved up in importance to these youngsters. Pet Food spending more than doubled
Pet Food Spending is driven by trends and outside influences like FDA warnings and COVID. 2022 was a more normal year. Even with 10.2% inflation, all but Silent/Greatest spent more $ and bought more food. Now, Supplies Spending.
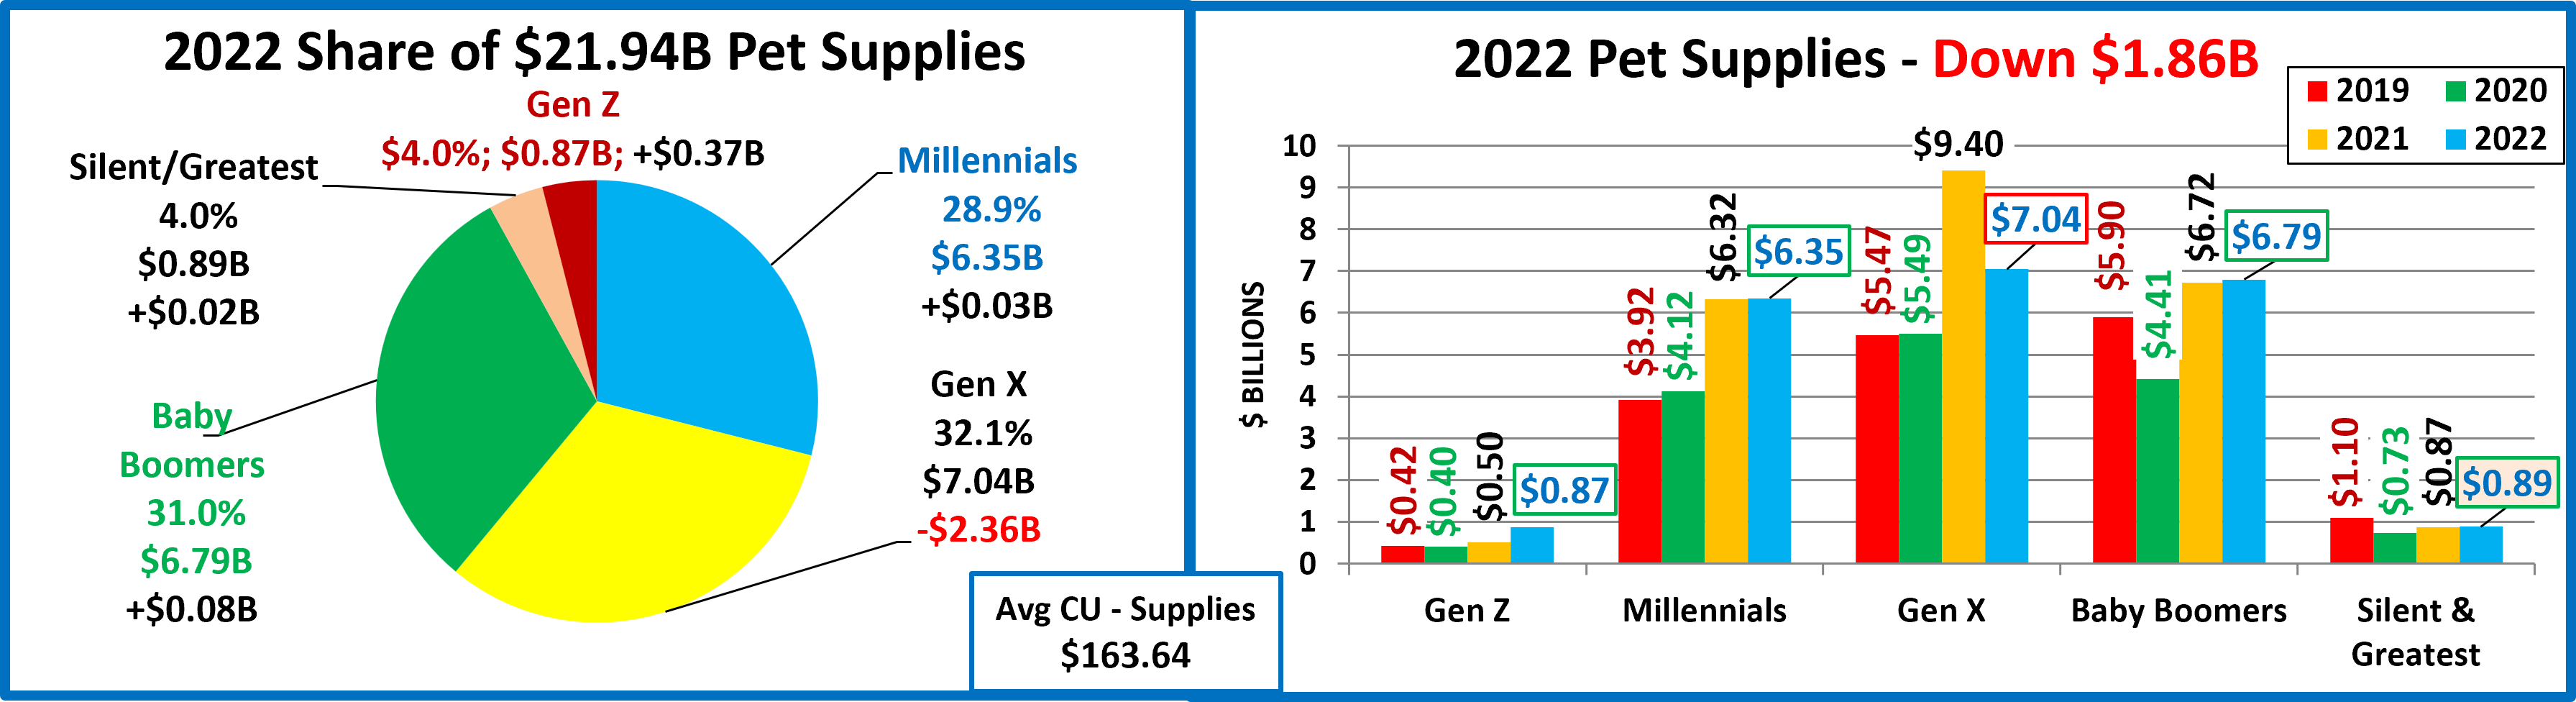
- Only Gen X spent less but they kept their position at the top of Pet Supplies spending. Supplies spending used to be more skewed towards the younger groups. It has become more balanced. The oldest and youngest generations essentially have the same share and there is a difference of less than 10% in the $ of the 3 biggest spenders.
- Gen X – Ave CU spent $194.64 (-$70.79); 2022 Pet Supplies spending = $7.04B, Down $2.36B (-25.1%)
- 2016>2021: Up $1.57B; Gen Xers are again the leader in Supplies spending. They were affected by tarifflation in 2019 but held their ground in 2020. In 2021 spending exploded, +71% so the drop in 2022 was not unexpected.
- Baby Boomers – Ave CU spent $156.31 (+$2.28); 2022 Pet Supplies spending = $6.79B, Up $0.08B (+1.1%)
- 2019>2022: Up $0.89B In 2020 they focused on Food! In 2021 they made it back to 2018 $ and then had a small lift in 2022.
- Millennials – Ave CU spent $181.77 (+$1.40); 2022 Pet Supplies spending = $6.35B, Up $0.03B (+0.5%)
- 2019>2022: Up $2.43B; Millennials earn their share of Supplies $. They were the least impacted by the tariffs in 2019 and spent more in 2020. Their spending then took off in 2021, with a 53% increase. It stayed there in 2022.
- Silent + Greatest – Ave CU spent $72.64 (+$8.37); 2022 Pet Supplies spending = $0.89B, Up $0.02B (+2.3%)
- 2016>2021: Down $0.21B; They’re losing CUs & were hit hard by COVID & inflation but had small lifts in 21 & 22.
- Gen Z – Ave CU spent $119.05 (+$36.10); 2022 Pet Supplies spending = $0.87B, Up $0.37B (+73.4%)
- 2019>2022: Up $0.45B; With a huge increase in Food, their big lift in Supplies is not surprising, Pets need both.
In 2019, tarifflation drove spending down in all groups. In 2020 Millennials and Gen X spent a little more while the older groups spent a lot less. In 2021 spending took off in all groups. In 2022, only Gen X spent less, -$2.36B. However, considering 7.7% inflation, only Gen Z really bought more Supplies.
Next, we’ll turn our attention to the Service Segments. First, Non-Veterinary Pet Services
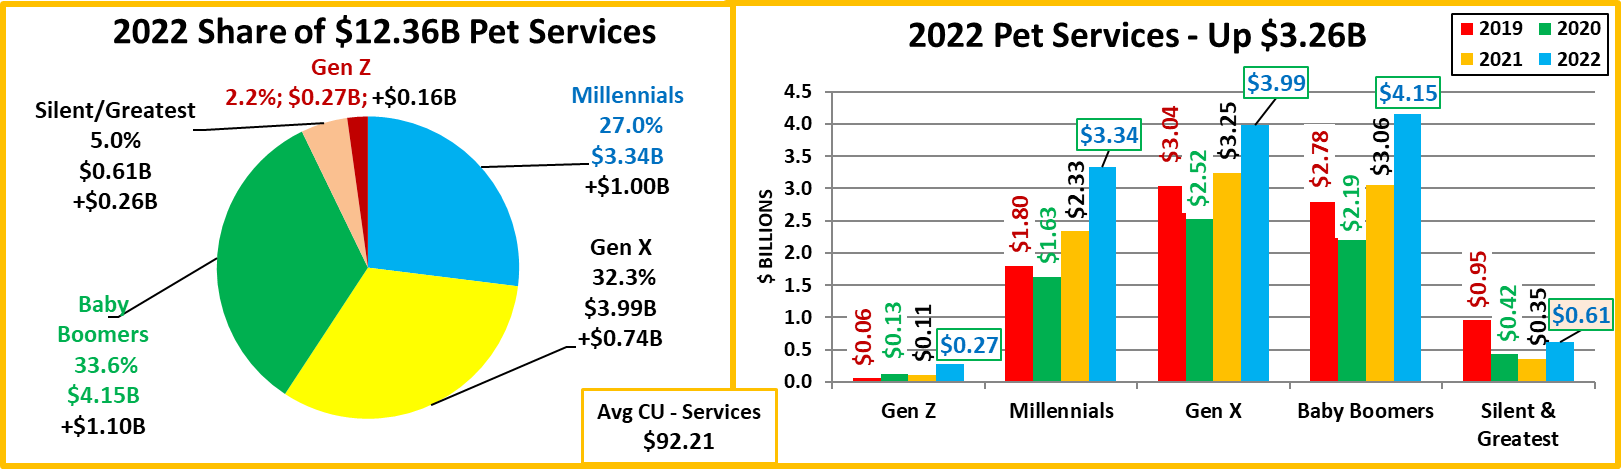
- All groups spent more. Baby Boomers had the biggest increase and became #1 in Services $.
- Baby Boomers – Ave CU spent $95.56 (+$25.50); 2022 Pet Services spending = $4.15B, Up $1.10B (+35.9%)
- 2019>2022: Up $1.37B; The biggest $ drop in 2020 and the biggest lifts in 2021 & 2022. They moved to the top.
- Gen X – Ave CU spent $110.26 (+$18.62); 2022 Pet Services spending = $3.99B, Up $0.74B (+22.9%)
- 2019>2022: Up $0.95B; In 2020 they had a big drop. In 2021 and 2022 they had the 2nd biggest lifts but fell to #2 in 2022.
- Millennials – Ave CU spent $95.50 (+$28.89); 2022 Pet Services spending = $3.34B, Up $1.00B (+43.0%)
- 2019>2022: Up $1.54B; In 2020 they had the smallest decrease of any group and with the 2021 & 2022 lifts, they are now 86% ahead of their 2019 spending.
- Silent + Greatest – Ave CU spent $50.25 (+$23.96); 2022 Pet Services spending = $0.61B, Up $0.26B (+73.1%)
- 2016>2021: Down $0.34B; They definitely have the need. In 2022, they found the money. Spending was +73%.
- Gen Z – Ave CU spent $37.35 (+$18.82); 2022 Pet Services spending = $0.27B, Up $0.16B (+143.5%)
- 2019>2022: Up $0.21B; They still have the smallest share of the $ but their spending more than doubled in 2022.
This segment had slow annual growth until 2017 which saw a small drop in spending due to an extremely competitive environment. In 2018, the increased number of outlets really hit home, and spending exploded. 2019 brought another small decrease as Gen Xers & Millennials looked for and found a better deal. 2020 brought pandemic restrictions and closures. Fueled by the Big 3, 2021 produced a record lift which they exceeded in 2022. However, Boomers are now #1.
Now, Veterinary Services
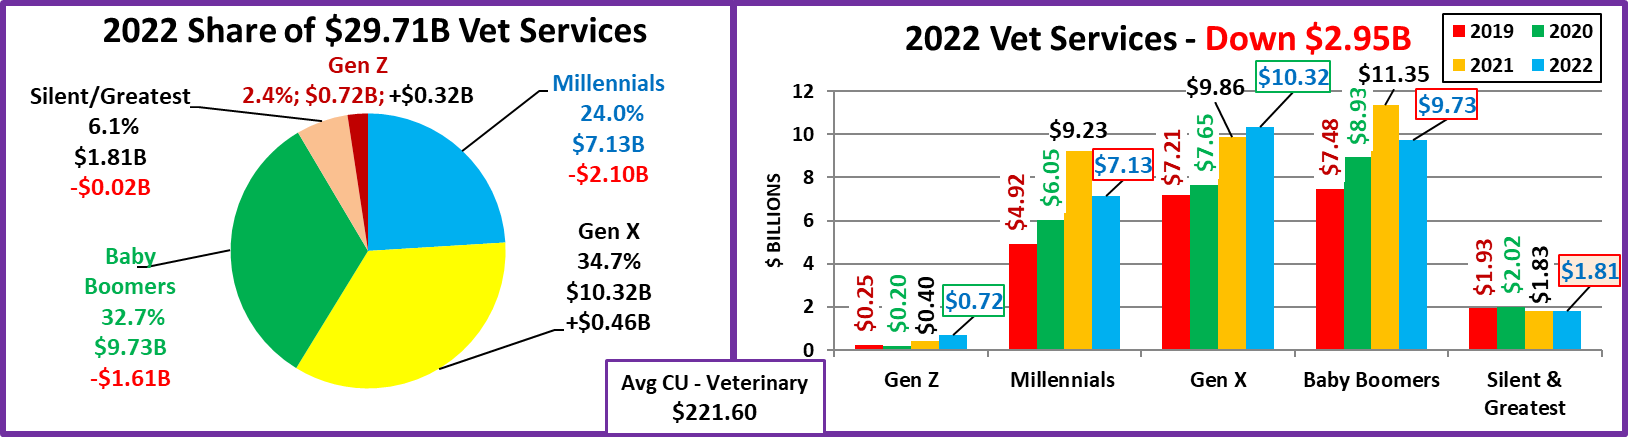
- Gen X & Gen Z had the only increases and Gen X moved to the top in both CU spending and total $.
- Except for the 2022 drop by Millennials, the younger groups have had a growing commitment to this Pet Parenting responsibility. The combined Veterinary $ of Millennials, Gen Z & Gen Xers is up 47% from 2019 but 95% from 2017.
- Gen X – Ave CU spent $285.33 (+$6.80); 2022 Veterinary spending= $10.32B, Up $0.46B (+4.6%)
- 2019>2022: Up $3.11B; They have been at the top of CU Veterinary spending since 2018. They are the only group with an annual increase in Veterinary $ every year since 2019 and in 2022 they moved to the top in Total $.
- Boomers – Ave CU spent $223.83 (-$36.31); 2022 Veterinary spending= $9.73B, Down $1.62B (-14.3%)
- 2016>2021: Up $2.25B; In 2020, Boomers focused on Food & Veterinary. In 2021 they had a big drop in Food but a big lift in Veterinary. They have been the perennial leader in Vet $ until the big drop in 2022 pushed them down to #2.
- Millennials – Ave CU spent $204.18 (-$59.23); 2022 Veterinary Spending $7.13B, Down $2.10B (-22.7%)
- 2019>2022: Up $2.21B; They had the biggest lift in 21 and the biggest drop in 22 but Veterinary is still a priority.
- Silent + Greatest – Ave CU spent $148.84 (+$12.90); 2022 Veterinary spending $1.81B, Down $0.02B (-0.9%)
- 2016>2021: Down $0.12B; Their pets’ health is still a priority. Spending fell only because of a decrease in CUs.
- Gen Z – Ave CU spent $97.84 (+$32.49); 2022 Veterinary spending = $0.72B, Up $0.32B (+80.9%)
- 2019>2022: Up $0.47B; Their growing commitment to Pets includes Vet Services as spending rose over 80%.
Veterinary spending continues to be important to the 3 younger groups. Gen X moved to the top in $ and along with Gen Z, had the only increases. However, with 8.8% inflation, Vet spending really fell 16.4% and only Gen Z bought more.
One last chart to compare the share of spending to the share of total CU’s to see who is “earning their share”.
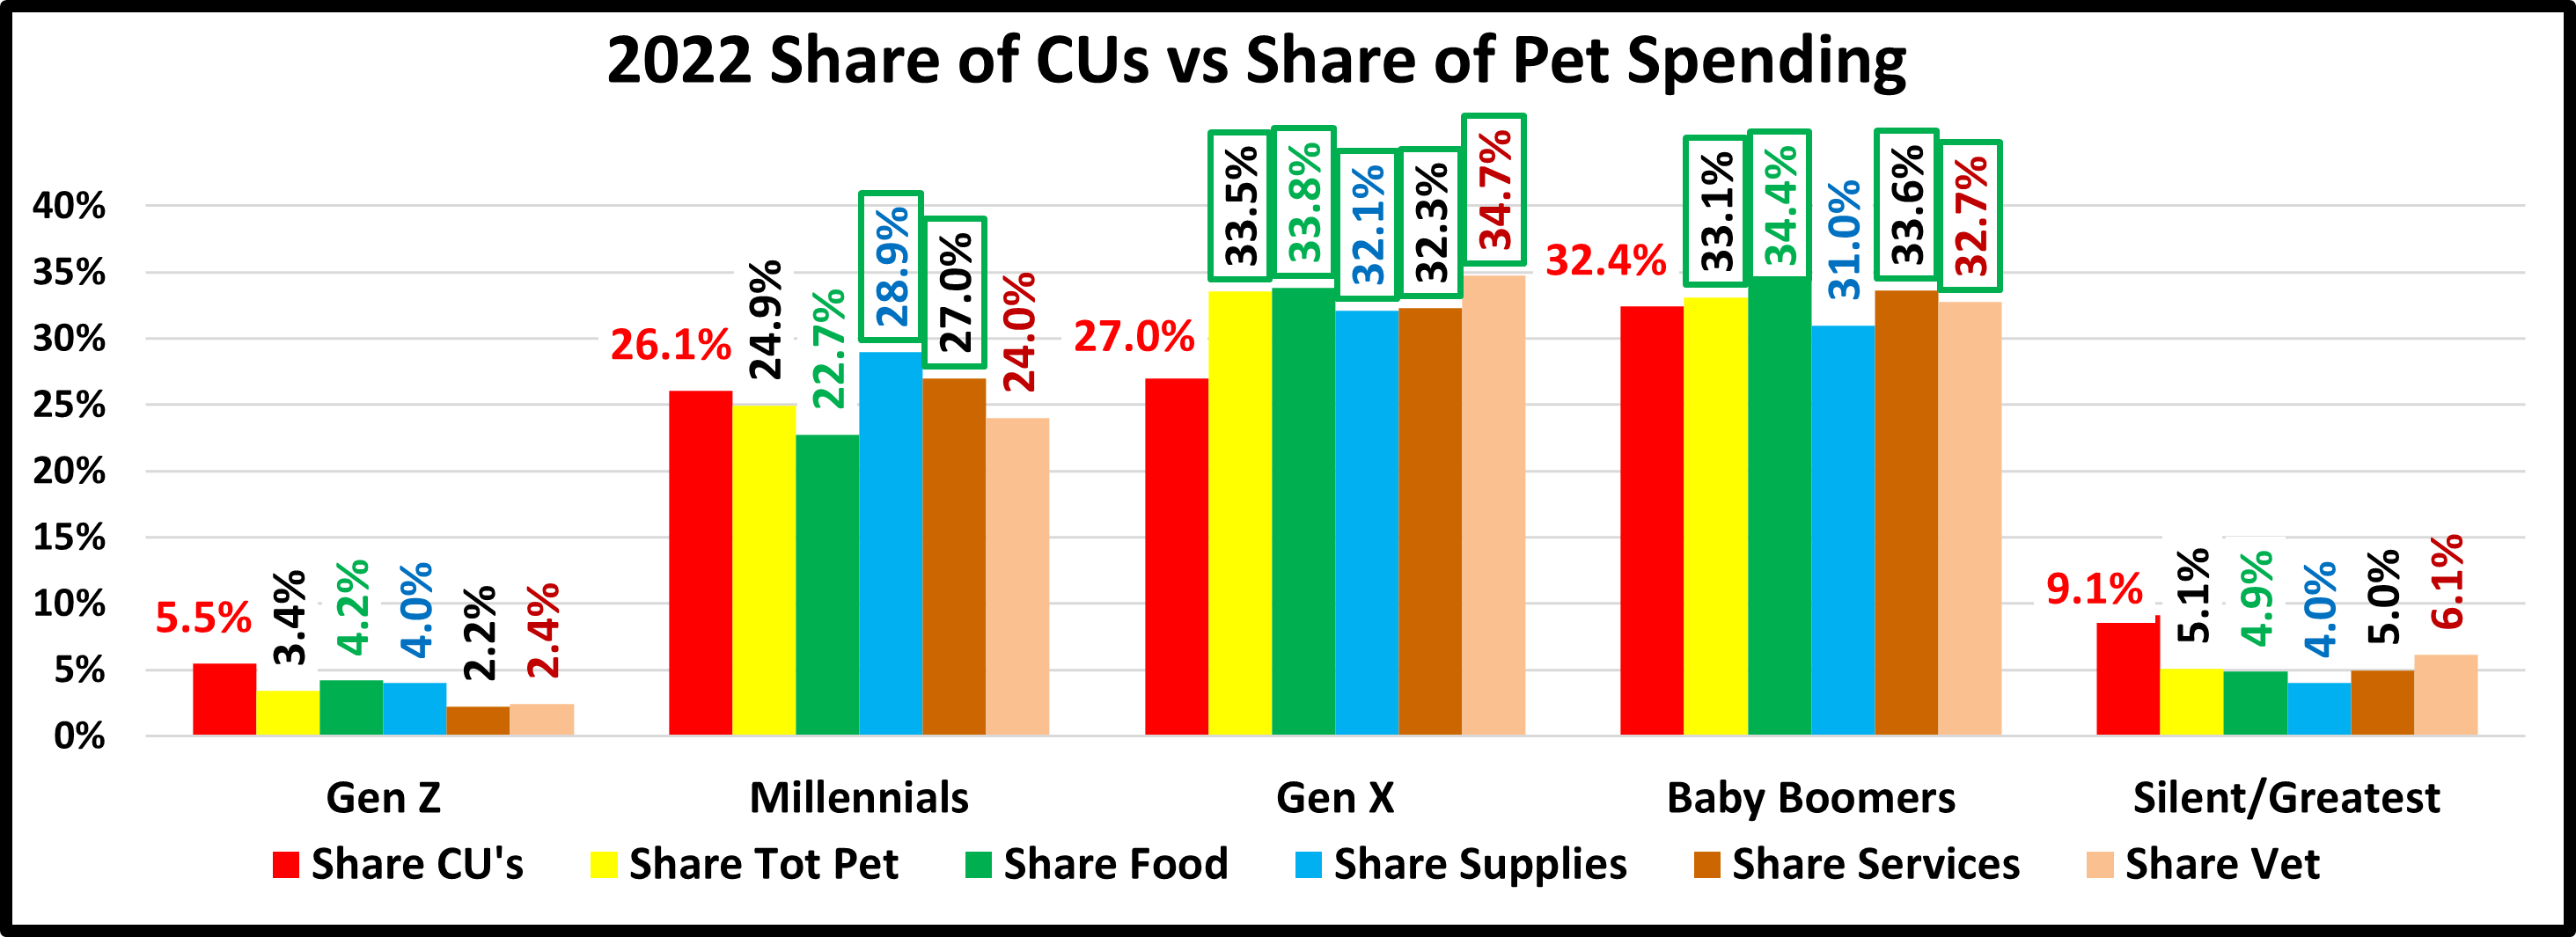
- Gen X Performance – Total: 124.2%; Food: 125.3%; Supplies: 118.9%; Services: 119.6%; Veterinary: 128.8%
- Gen Xers returned to the top spot in performance. They again earned their share in Total Pet and all industry segments. Except for the 2020 dip they increased their Total Pet Spending every year since 2016. In 2021 they had a big increase in every segment. In 2022 they had some spending dips but an overall increase as they stayed on top in Total Pet $. They are the performance leader in every segment. Gen Xers range in age from 42>57 so only the oldest are in their peak earning years. Expect their commitment and pet spending to continue to grow.
- Baby Boomers Performance – Total: 102.1%; Food: 106.2%; Supplies: 95.5%; Services: 103.6%; Veterinary: 101.0%
- Boomers led the way in building the industry but are no longer the “top dogs” in $. They earn their share in all but Supplies and are still the spending leader in Food & Services. They are also the most emotional Pet Parents, so their spending is subject to radical swings like 2020’s panic, binge buying of Pet Food. They should still be a major force in the Pet Industry for many more years, but the Gen Xers have now stepped up and the Millennials are also preparing to eventually take their turn at the top.
- Millennials Performance – Total: 95.7%; Food: 87.3%; Supplies: 111.1%; Services: 103.6%; Veterinary: 92.1%
- Millennials are now the only group to have increased their pet spending every year since 2016. Their spending is more evenly balanced, and their performance is stable at 95+% but their future as the Pet Parenting spending leaders is still a long way off. Their income, home ownership and pet spending are all increasing. They are educated and well connected. Indications are that they may lead the way in adopting new trends, especially in food. Their progress is good news, but in reality, their leadership is probably at least a decade away.
- Gen Z Performance – Total: 62.0%; Food: 76.6%; Supplies: 72.8%; Services: 40.5%; Veterinary: 44.2%
- They are just beginning so the numbers are low, but a strong year moved them past the oldest group.
- Silent/Greatest Performance – Total: 55.6%; Food: 53.5%; Supplies: 44.4%; Services: 54.5%; Veterinary: 67.2%
- Pet Parenting is more challenging in old age. Their overall performance fell from 66.1% in 2021 to 55.6% in 2022.
Baby Boomers are still the heart of the industry, but Gen Xers are the $ leaders. Expect Gen X’s growth to continue as they are pursued by Millennials. Both groups seem ready, willing and able to take their turn at the top. Pet Spending has become more balanced across the generations. This bodes well for the continued strong growth of the industry.

Trackbacks & Pingbacks
[…] Baby boomer pet owners spent US$13.32 billion on pet food in 2022, just edging out the US$13.08 billion spent by gen Xers — but the latter group’s spending registered the most growth from 2021. The data comes courtesy of the U.S. Bureau of Labor Statistics (BLS), compiled and analyzed by John Gibbons on PetBusinessProfessor.com. […]
Comments are closed.