2020 U.S. PET SERVICES SPENDING $6.89B…Down ↓$1.73B
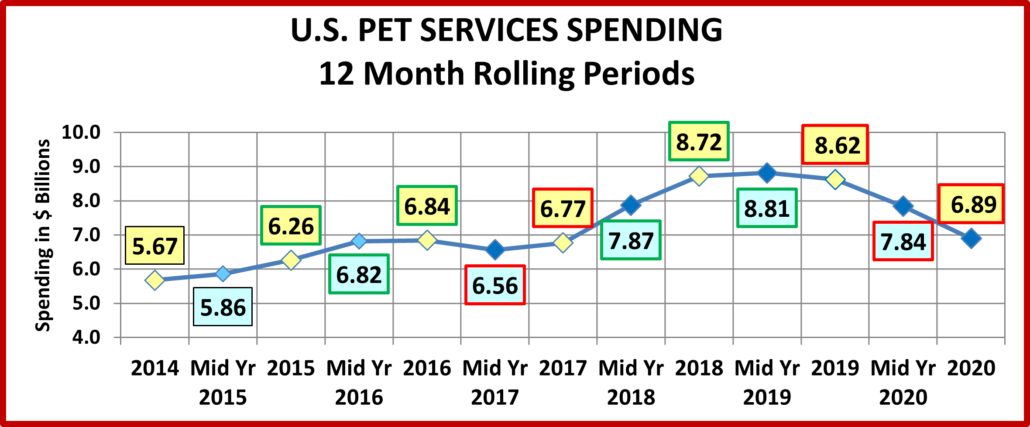
Except for a small decline in 2017, Non-Vet Pet Services has shown consistent growth in recent years. In 2018, that changed as spending grew a spectacular $1.95B to $8.72B. The number of outlets offering Pet Services has grown rapidly and consumers have opted for the convenience. However, prices were also strongly increasing. In the 2nd half of 2019 spending turned down and then plummeted in 2020 due to COVID. The final $ were $6.89B, down $1.73B (-20.1%). In this report we will drill down into the data to see what groups were most impacted. (Note: All numbers in this report come from or are calculated by using data from the US BLS Consumer Expenditure Surveys)
Services’ Spending per CU in 2020 was $52.53, down from $65.22 in 2019. (Note: A 2020 Pet CU (67%) Spent $97.34)
More specifically, the 20.1% decrease in Total Pet Services spending came as a result of:
- 0.8% less households
- Spending 3.40% less $
- 16.62% less often
The chart below gives a visual overview of recent spending on Pet Services
You can see that after the big lift in 2018, spending essentially flattened out in 2019, similar to the pattern in 2016-17. Increased availability and convenience of Services has radically driven up the spending on Services. This happened despite a return to a more normal inflation rate, +2.4%. However, inflation grew even stronger, +2.5%. By the 2nd half of 2019, it made an impact as spending declined for the 1st time in 18 months. The 2020 pandemic brought restrictions and closures which drove spending radically down. Now, let’s look at some specific demographics of 2020 Services spending.
First, by Income Group.
In 2018, all groups spent more. In 2019, only the middle income group, $70>150K, spent more. In 2020 they had the biggest decrease, and their spending is now below the level in 2015. The only increase came from the $30>70K group, which is the only group earning under $150K which spent more than they did in 2015. The 50/50 dividing line in $ for Services was $123K. That is down from $125K in 2019 but still by far the highest of any segment.
- <30K (25.4% of CU’s) – $19.66 per CU (-0.1%) – $0.66B, Down $0.05B (-6.7%) – This segment is getting smaller and money is tight, so Services spending is less of an option. Their Services $ fell even farther below 2015.
- $30>70K (31.1% of CU’s) – $35.95 per CU (+3.0%) – $1.47B, Up $0.01B (+0.9%) – In 2019 they had the biggest decrease. In 2020, they had the only increase and finished second in $ to the $150K> group.
- $70>100K (15.0% of CU’s) – $41.87 per CU (-35.6%) – $0.82B, Down $0.42B (-33.7%) – The spending of this middle income group had slowly but consistently grown since 2016. Then came the pandemic and the $ plummeted in 2020, falling even below the previous low point in 2016.
- $100>150K (14.4% of CU’s) – $62.88per CU (-42.0%) – $1.19B, Down $0.79B (-40.0%) – They had shown the strongest, most consistent growth since 2016. Then came 2020, when they had the biggest decrease, down 40.%.
- $150K> (14.1% of CU’s) – $149.07 per CU (-19.6%) – $2.76B, Down $0.49B (-15.0%) – They have moved steadily down since peaking in 2018. The pandemic drop in 2020 was -$0.49B, but they are still slightly above 2015 $.
Now, let’s look at spending by Age Group.
All age groups spent more on Services in 2018. In 2019, the groups under 45 spent less on Services while those 45 or older spent more. In the 2020 pandemic, everyone spent less but all stayed above 2015 $. Here are the specifics:
- 75> (11.2% of CU’s) – $23.09 per CU (-55.0%) – $0.34B – Down $0.42B (-55.1%) This group has the greatest need for pet services, but money is always an issue. In 2019 they had the biggest increase. In 2020 they basically gave it all back, with the biggest drops in spending and frequency. 0.2% fewer CU’s spent 28.5% less $, 37.1% less often.
- 65>74 (15.6% of CU’s) – $47.60 per CU (-25.0%) – $0.97B – Down $0.28B (-22.2%). This group is also very value conscious and growing in numbers. From 2016 to 2019 their spending was very stable. In 2020 it plunged by over 20% primarily due to a big decrease in frequency. 3.7% more CU’s spent 5.7% less $, 18.9% less often.
- 55>64 (19.1% of CU’s) $53.15 per CU (-23.4%) – $1.33B – Down $0.37B (-21.7%) After a big drop in 2017, they began to slowly increase Services spending. In 2019, they moved up to the #2 spot in Services spending. A big drop in frequency drove spending down in 2020 but they are still #2. 2.2% more CU’s spent 1.9% less $, 21.9% less often.
- 45>54 (17.2% of CU’s)- $75.38 per CU (-16.5%) – $1.70B – Down $0.31B (-15.2%) This highest income group was the leader in Services $ until 2016. They regained the top spot in 2019 and held on in 2020 despite a 20% drop in frequency which drove spending down -$0.31B. 1.5% more CU’s spent 5.2% more $, 20.6% less often.
- 35>44 (17.0% of CU’s) – $56.91 per CU (-18.8%) – $1.27B – Down $0.30B (-18.9%) Spending exploded in 2018 with a $1B increase pushing them to #1. In 2019 they spent $1.6B more on Veterinary and Food and cut back on Services and Supplies. In 2020 both their spending and frequency fell. 0.1% fewer CU’s spent 8.9% less $, 10.9% less often.
- 25>34 (16.0% of CU’s) – $52.85 per CU (-1.9%) – $1.11B – Down $0.03B (-3.0%) This group of Millennials “found” the Services segment in 2018 with a 36% increase in $. Their spending has slowly fallen since then. In 2020, their 3% decrease was primarily driven by a -9.7% drop in frequency. 1.2% less CU’s spent 8.6% more $, 9.7% less often.
- <25 (3.8% of CU’s) – $32.44 per CU (+24.6%) – $0.16B – Down $0.03B (-14.3%) After 2018 this group returned to being a very minor player. 31% fewer CUs is significant. 31.2% fewer CU’s spent 19.7% less $, 55.1% more often.
In 2019, when overall Services spending fell $0.1B, the over 45 age group spent $0.51B more. The situation was reversed in 2020 as they spent -$1.38B less, 79.8% of the total $1.73B drop in Services spending.
Finally, here are some key demographic “movers” that drove the big drop in Pet Services Spending in 2020. The segments that are outlined in black “flipped” from 1st to last or vice versa from 2018. The red outline stayed the same.
In 2018 the Services spending increase was very widespread with (88%) of all segments spending more. 6 of 12 demographic categories had no segments that spent less on Services in 2018. 2019 was very different and reflected the slight decrease in spending for the segment. All categories had segments that spent less on Services and 49 total segments (51%) had decreased Services $ from 2018. In 2020, the situation got markedly worse as 76 segments (79%) spent less and in 3 categories, no segments spent more.
You see from the graph that the biggest negatives were all substantially larger than the small increases. This speaks to the severity and widespread nature of the loss in $ in the segment. There was also considerable turmoil in Services spending. 3 groups maintained their position but 7 flipped from 1st to last or vice versa.
There was only 1 “usual” winner – Self-Employed, which have the highest income in their category. There were some winners that were definitely a surprise – Renters, Rural, $50>69K Income, Gen Z, High School Grads, Hispanic and Under 25 years old. That means that more than half of the winners were not expected.
In terms of “usual” losers, there really were none in 2020. The losing segments are where we find these usual winners:
- 2 People
- Married Couple Only
- Homeowner w/Mtge
- Managers & Professionals
- Suburban
- $100>149K
- College Degree
- 2 Earners
- White, Not Hispanic
This actually makes some sense. The drop in spending was largely due to restrictions and closures caused by the COVID Pandemic. This would most impact the groups that usually spent the most and would produce the biggest decreases.
In our earlier analysis, we didn’t see any truly distinct spending patterns. The only lift in any age or income group, and it was miniscule, was from the $30>69K income group. However, it is significant that they are the only income group under $150K that didn’t spent less in 2020 than they did in 2015. The 50/50 spending point moved down slightly from $125 to $123 but that is somewhat deceptive. The highest income group, $150K> actually gained ground. This group has 14.1% of CUs but did 40.1% of the Services spending in 2020. That’s up from 37.7% in 2019.
After the huge lift in spending in 2018, Services spending plateaued in 2019. There were a lot of ups and downs, but overall the segment remained essentially stable at its new elevated level of spending. That changed with the pandemic in 2020. Like many retail services segments, Pet Services outlets were deemed nonessential and subject to restrictions This resulted in a radically reduced frequency of visits and was the biggest reason behind the 20% drop in spending.
There is no doubt that the Covid pandemic with widespread closures and “staying at home” had a big impact on this most discretionary Pet Industry segment. However, in recent years, with the increasing humanization of our pets, Pet Services have become more important to Pet Parents and the Pet Industry. For Pet retail outlets, offering Services provides a key point of differentiation and a reason to shop in their store. You can’t get your dog groomed on the internet or even in a Mass Market retailer. We expect this segment to come back strong in 2022.


