Pet Product Sales In U.S. Retail Channels – The “migration of pet parents”
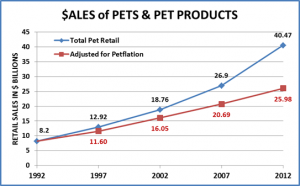
Pets, Pet Food and Supplies sales have shown tremendous retail growth since 1992. According the Economic Census just published by the U.S. Census Bureau, retail sales totaled $40.47 Billion in 2012 – up from $8.2 Billion in 1992. The spectacular growth was fueled by Americans’ growing love and commitment to their pets. Over 60% of U.S. Households have a pet – twice as many as have a child under 18.
While the love was growing in our hearts, the sales of pet products were growing at retail. It was not a simple journey –straight to the top. It involved expansion to a variety of different outlets and consumer migration between channels driven by their search for value, convenience and selection.
In this report we will use detailed data from the Economic Census which is published in 5 year increments.
Here is a visual look at the growth since 1992. I have also included a line on the graph which is adjusted for “petflation” and gives us a better indication of the actual increase in the amount of product sold.
- Total Growth 1992 to 2012
- Up $32.27 Billion (+394.8%)
- Average Annual Growth Rate = 8.3%
- Real Growth 1992 to 2012 (Adjusted for price changes – Pet Food & Supplies CPI)
- Up $17.78 Billion (+216.8%)
- Average Annual Growth Rate = 5.9%
NOTE: Most of the growth (71.1%) in Pets, Pet Food and Supplies has been real growth. Pet Products Prices increased 55.8% in 20 years compared to an increase of 64.7% in the Total U.S. CPI and a 62.4% increase in Total Pet Pricing in JUST the last 15 years.
Increased Pricing in Pet Products was an issue from 2007 to 2009 when prices jumped 17% in just two years, in the heart of the recession. In the overall Retail Market, consumers bought less and started searching strongly for value. This was a key waypoint in the migration of Pet Product consumers.
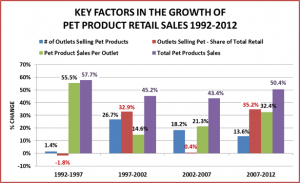
We’ll stay with the total market and look at some key factors that have affected the overall growth since 1992
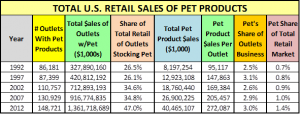 Here’s how each factor changed during the 4 – five year measurements since 1992.
1992 to 1997 – No growth in outlets or in retailers’ share of overall market. The big growth was increased store volume due to increased consumer product demand – which was filled by expanded departments and bigger pet stores.
1997 to 2002 – A 27% increase in number of outlets and a 15% increase in per store volume push sales up 45%. A huge increase in the representation of Pet in the overall market as it now is available in stores doing over 35% of total retail.
2002 to 2007 – Store count continues to grow – up 18% and the per/store volume goes up even faster – +21%. Sales are up 43%. The overall Retail Market Share of outlets selling products remains stable at 35%.
2007 to 2012 – Another 18,000 stores (+14%) and a huge increase in per store volume (+32.4%). Consumers have started shopping intensely for value since the recession…and they found it as sales increased 50%. It was also easier to find products in a store, as outlets doing 47% of the total U.S. Retail market stocked pet supplies in 2012.
1992 to 2012 – Sales Now $40 B; Up $32B (+394%)
- 148,000 “pet” outlets; Up 60,000 (+72.6%)
- Outlets stocking “pet” do 47% of U.S. Retail
- Pet Products do 3% of an outlet’s total sales
- Pet Products now 1.4% of total Retail; 0.7% in 1992
These facts sound like a fairy tale. There is obviously a lot of success to go around. Let’s see how the consumers decided to divide it up. We’ll take a look at the share of pet products sales by retail channel.
PET PRODUCTS SALES AND MARKET SHARE BY RETAIL CHANNEL
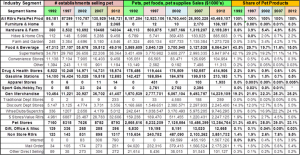
The following chart shows the shows in detail the number of outlets, total pet product sales and market share of the retail channels and segments stocking pet products from 1992 to 2012. Use it as a reference point. Additional graphs and observations will follow.
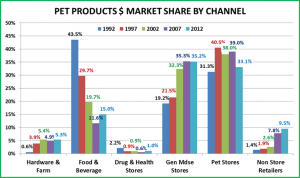
99.1% of Pet Products Sales are done by 6 major Retail Channels. Let’s look at their market share from 1992 to 2012.
Observations
Drug and Health Stores – This is the smallest of the 6 channels – in Pet Product sales. In overall retail sales, the drug channel has consistently grown in market share. As far as pet products are concerned, their market share dropped steadily from 1992 to 2007. They made a bit of a comeback in 2012, more than doubling their sales and almost doubling their market share. The result – their 2012 market share is still less than half of 1992. In terms of Pet Products, the sales are basically impulse or convenience purchases.
Hardware and Farm – Early growth came from the Farm Store segment. Hardware jumped on board in 2002 and pushed the market share up to 5.4%, capturing 40% of this channel’s pet business. Between Hardware and Farm, there have been some ups and downs, but overall the market share has been basically flat since 2002.
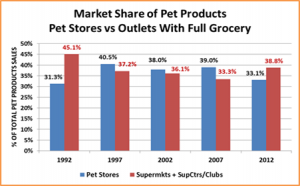
Food and Beverage – Supermarkets account for 98% of the business in this channel. In 1992 Supermarkets were the #1 Pet channel, with 42.1% of the business. They increased their business 9.5% in 1997. Unfortunately for them, overall “Pet” sales took off – up 55%. Their market share fell 30%. Sales stagnated in 2002 and actually dropped in 2007. Needless to say their market share continued to plummet – down 73% from the 1992 high. Where did the business go? – just about everywhere else, but primarily to General Merchandise Stores and Pet Stores. Then from 2007 to 2012 they executed a remarkable turnaround. The number of Supermarkets carrying pet products increased by over 70%. They more than doubled their pet sales and gained back 3.6 points in market share.
Nonstore Retailers – This channel includes both mail order and the internet. Their share of pet sales in this channel almost exactly mirrors their share of total retail market sales. However, the increases in pet have been truly astronomical. Sales in 2012 are 40 times what they were in 1992. Market share is up 745%. Since 2007 most of the growth is being fueled by the internet – sales have tripled. There seems to be no direction but up.
Pet Stores – In 1992 Pet Stores were the second largest retail channel selling pet products. The category caught fire. Big Box Pet Super Stores were developed and built to offer the consumer the wider selection that they sought. In 1997 Pet Stores moved into the #1 position with a 40.5% share of the business. The proliferation of Super Stores resulted in the closing of a number of smaller Independents so the number of stores and market share dipped slightly to 38.0% in 2002. They were still #1 but now they were being strongly pursued by General Merchandise Stores – not Supermarkets. More Super Stores, along with a continued high consumer demand, brought their market share back up to 39.0% in 2007. They had maintained the #1 status with a market share of 38 – 40% for over 10 years. Then…the recession happened and consumers became focused on value. Their store count was the same and sales grew but their market share fell 5.9 points (-15.1%). On the surface, it appears that the bulk of the business went to Grocery and Internet/Mail-order but almost every major channel and a few minor players got a piece of their lost share.
Minor Players – Although their combined market share is under 1%, the widespread appeal of Pets has brought in retailers from a variety of other “Specialty” channels – Home Goods (Furniture), Value Clothing Stores, Toys, Sporting Goods, Gift…to name a few. Although their selection is generally limited, they do broaden the consumer availability of certain pet product categories in the overall U.S. Retail Market. The success or failure of their venture into the Pet Products world is usually dependent upon the overall success of the individual retailer. If they are attracting consumers and their business is growing, then they may have some success with Pet. After all it appeals to 60+% of U.S. households.
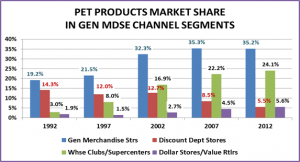
General Merchandise Stores – Currently the #1 Channel in Pet Products sales. It enjoyed strong to spectacular growth from 1992 to 2007. The number of outlets grew from 10K to 37K (+250%); sales grew $8B to $9.5B (+533%); market share grew from 19.1% to 35.3% (+83.9%). From 2007 to 2012, the number of outlets continued to grow and sales increased to $14.2B (+49.5%) but their market share actually fell 0.1%…Yet, they still took over the #1 position in Pet…by just matching the overall market increase. This is a large and complex channel and deserves a closer look.
Traditional Department Stores – Although they do 10% of this channel’s overall business, they are basically a nonentity in Pet Products. These stores have consistently loss market share as they have done little to meet the consumer’s changing “needs” – including failing to recognize and embrace the Pet Phenomenon in the U.S.
Discount Department Stores – This segment is the one that started the decline in traditional Department Stores. In terms of Pet Market Share, these stores were at their peak in 1992. The commitment to SuperCenters and the rise of Club Stores started their decline. Sales continued to increase until 2002 and there was even a little uptick in market share between 2002 and 2007. Since then, retail sales have basically been flat and the number of outlets has fallen. In 2012 they were surpassed by the Dollar/Value stores in Pet Products’ market share.
SuperCenters & Warehouse Club Stores – This segment has shown consistent, even spectacular growth and in every measuring period has surpassed even the impressive growth of the overall Pet Products market. They rank#2 behind Pet Stores in sales. While their overall Retail Market Share has flattened out, their Pet business has continued to go up.
$ Stores/Value Retailers – This channel was originally occupied by 5&10¢ Stores. They faded and were replaced by these Value Retailers. Since 1997, the store count and Pet Product sales have gone up dramatically. Their appeal and their share of the total market has grown markedly since the recession. In Pet, their store count is second only to Supermarkets and their sales and market share just passed Discount Department stores. Expect continued growth.
One Last Chart before the recap – Take a look at the chart below and think about this. In 1992 the largest share of Pet Products was bought by consumers where they shopped for groceries. In 2012, have we come full circle?
Summary
In the case of Pet Products consumers, “migration” is not truly the best description. Pets improve the health and quality of life of their “parents”. They bring hours of enjoyment. The love of Pets in America and in fact, worldwide is “contagious”. It has reached “epidemic” proportions with pets residing in over 60% of U.S. Households.
Why should the retail trade be immune? They too caught the “pet fever” early and it has spread – rapidly. In 1992, Pet Products were carried in 80,000 outlets doing 26% of the total U.S. Business. In 2012…it was 150,000…and 47%. Not only are Pet Products more widely available, but their importance has grown. In 1992 Pet Products represented 0.7% of Total U.S. Retail sales. In 2012 it was double…1.4%.
In terms of “big” migrations between channels over the period, there are really only two.
- The big move from Supermarkets to General Merchandise and Pet Stores which occurred from 1992 to 2007. (Note: Supermarkets bounced back in 2012, recapturing some of their lost share)
- The meteoric rise of internet/mail-order –recently driven primarily by the internet
Here’s the 2012 market share by Channel: (Arrows show if they are up ↑, down ↓and by how much in share from 2007)
- GM Strs – 35.2% ↓0.1
- Pet Stores – 33.1% ↓5.9
- Food & Bev (Groc) – 15% ↑3.4
- Internet/Mailorder – 9.5% ↑1.7
- Hdwe & Farm – 5.3% ↑0.4
- A/O Incl. Drug – 1.9% ↑0.5
From 2007-12, the only real loser was Pet Stores and their share was picked up primarily by Grocery and the Internet.
Now let’s look at the individual segments in terms of 2012: (Same rules as above)
- Pet Stores – 33.1% ↓5.9
- SuperCtrs/Club – 24.1% ↑1.9
- Supermkts – 14.7% ↑3.6
- $ Value Strs – 5.6% ↑1.1
- Disc Dept Strs – 5.5% ↓3.0
- Mail-order – 5.4% ↓0.4
- Internet – 3.9% ↑2.1
- Farm – 3.1% ↓1.1
- Hardware – 2.2% ↑1.5
- Drug – 1.0% ↑0.4
- Gas/Convenience – 0.8% ↓0.3
- Furniture/Home – 0.3% ↑0.3
As you can see, the story is a bit more complex. There are ups and downs within major channels. The big losers are Pet Stores and Discount Department stores. Their market share is being picked up by Supermarkets, the Internet, SuperCenters/Clubs and the $ Value Stores. The loss in Farm was picked up by Hardware, in the same Channel.
Value, Convenience and Selection – Sorry for the redundancy, but these are the drivers of the U.S. consumer…and since the recession, Value has moved strongly to the forefront.
Pet Super Stores grew rapidly because they offered an unparalleled, broad selection of products in a category that was exploding. They had sales and frequent buyer clubs, but quite frankly some of the highest gross margins in U.S. retail. When the recession hit, price became a big issue and many consumers looked elsewhere.
Where did they go? What commodity does the consumer shop for most often and as regular as clockwork – groceries. They went to the Super Centers and Supermarkets. Both of these channels are very competitive for value, have expanded their pet section and offer the convenience of getting your pet needs while doing your regular grocery shopping. Note: Club Stores don’t have the selection but they do have great everyday pricing and a full grocery section.
Want a bigger selection…. Go on line. No one can build a store big enough to stock the selection of products available on line…and with no brick and mortar overhead…you can get great value. Plus, you can shop for the best price and get what you want without ever leaving your easy chair…talk about convenient. The only downside is immediate need. However, they are working deals on same day and next day delivery, possibly even delivery by drones. This segment will grow.
Want your product now at a great price but don’t feel like fighting the crowds, $/Value Stores are the answer. Great everyday prices plus brand name “close outs” in a small footprint store that is easy to navigate. This segment has “caught on” with the U.S. consumer and is gaining market share in pet and in the overall retail market.
At this point, Pet Products have spread across the U.S. retail landscape. There is no wholesale mass migration. However, there is definite movement between channels and segments. Moreover, there are individual retail winners and losers in every segment. It is totally dependent upon how well they are filling the consumers’ needs, which we all know are….
In our final post in this series: we’ll look at sales in Pet Stores from 1987 to 2012.


