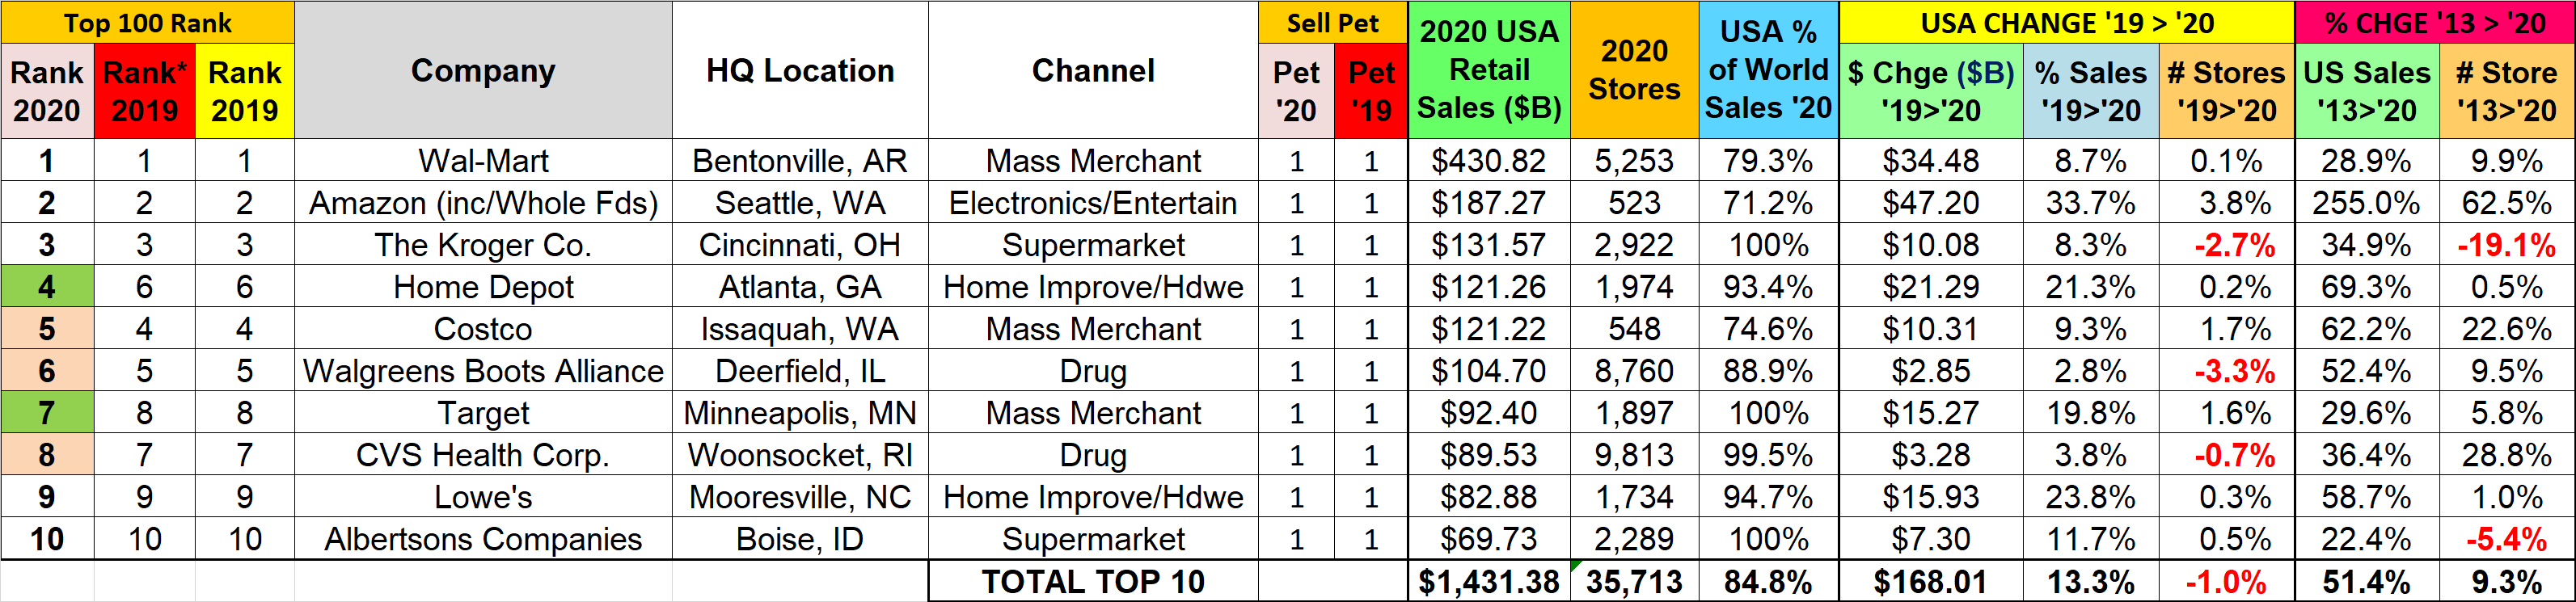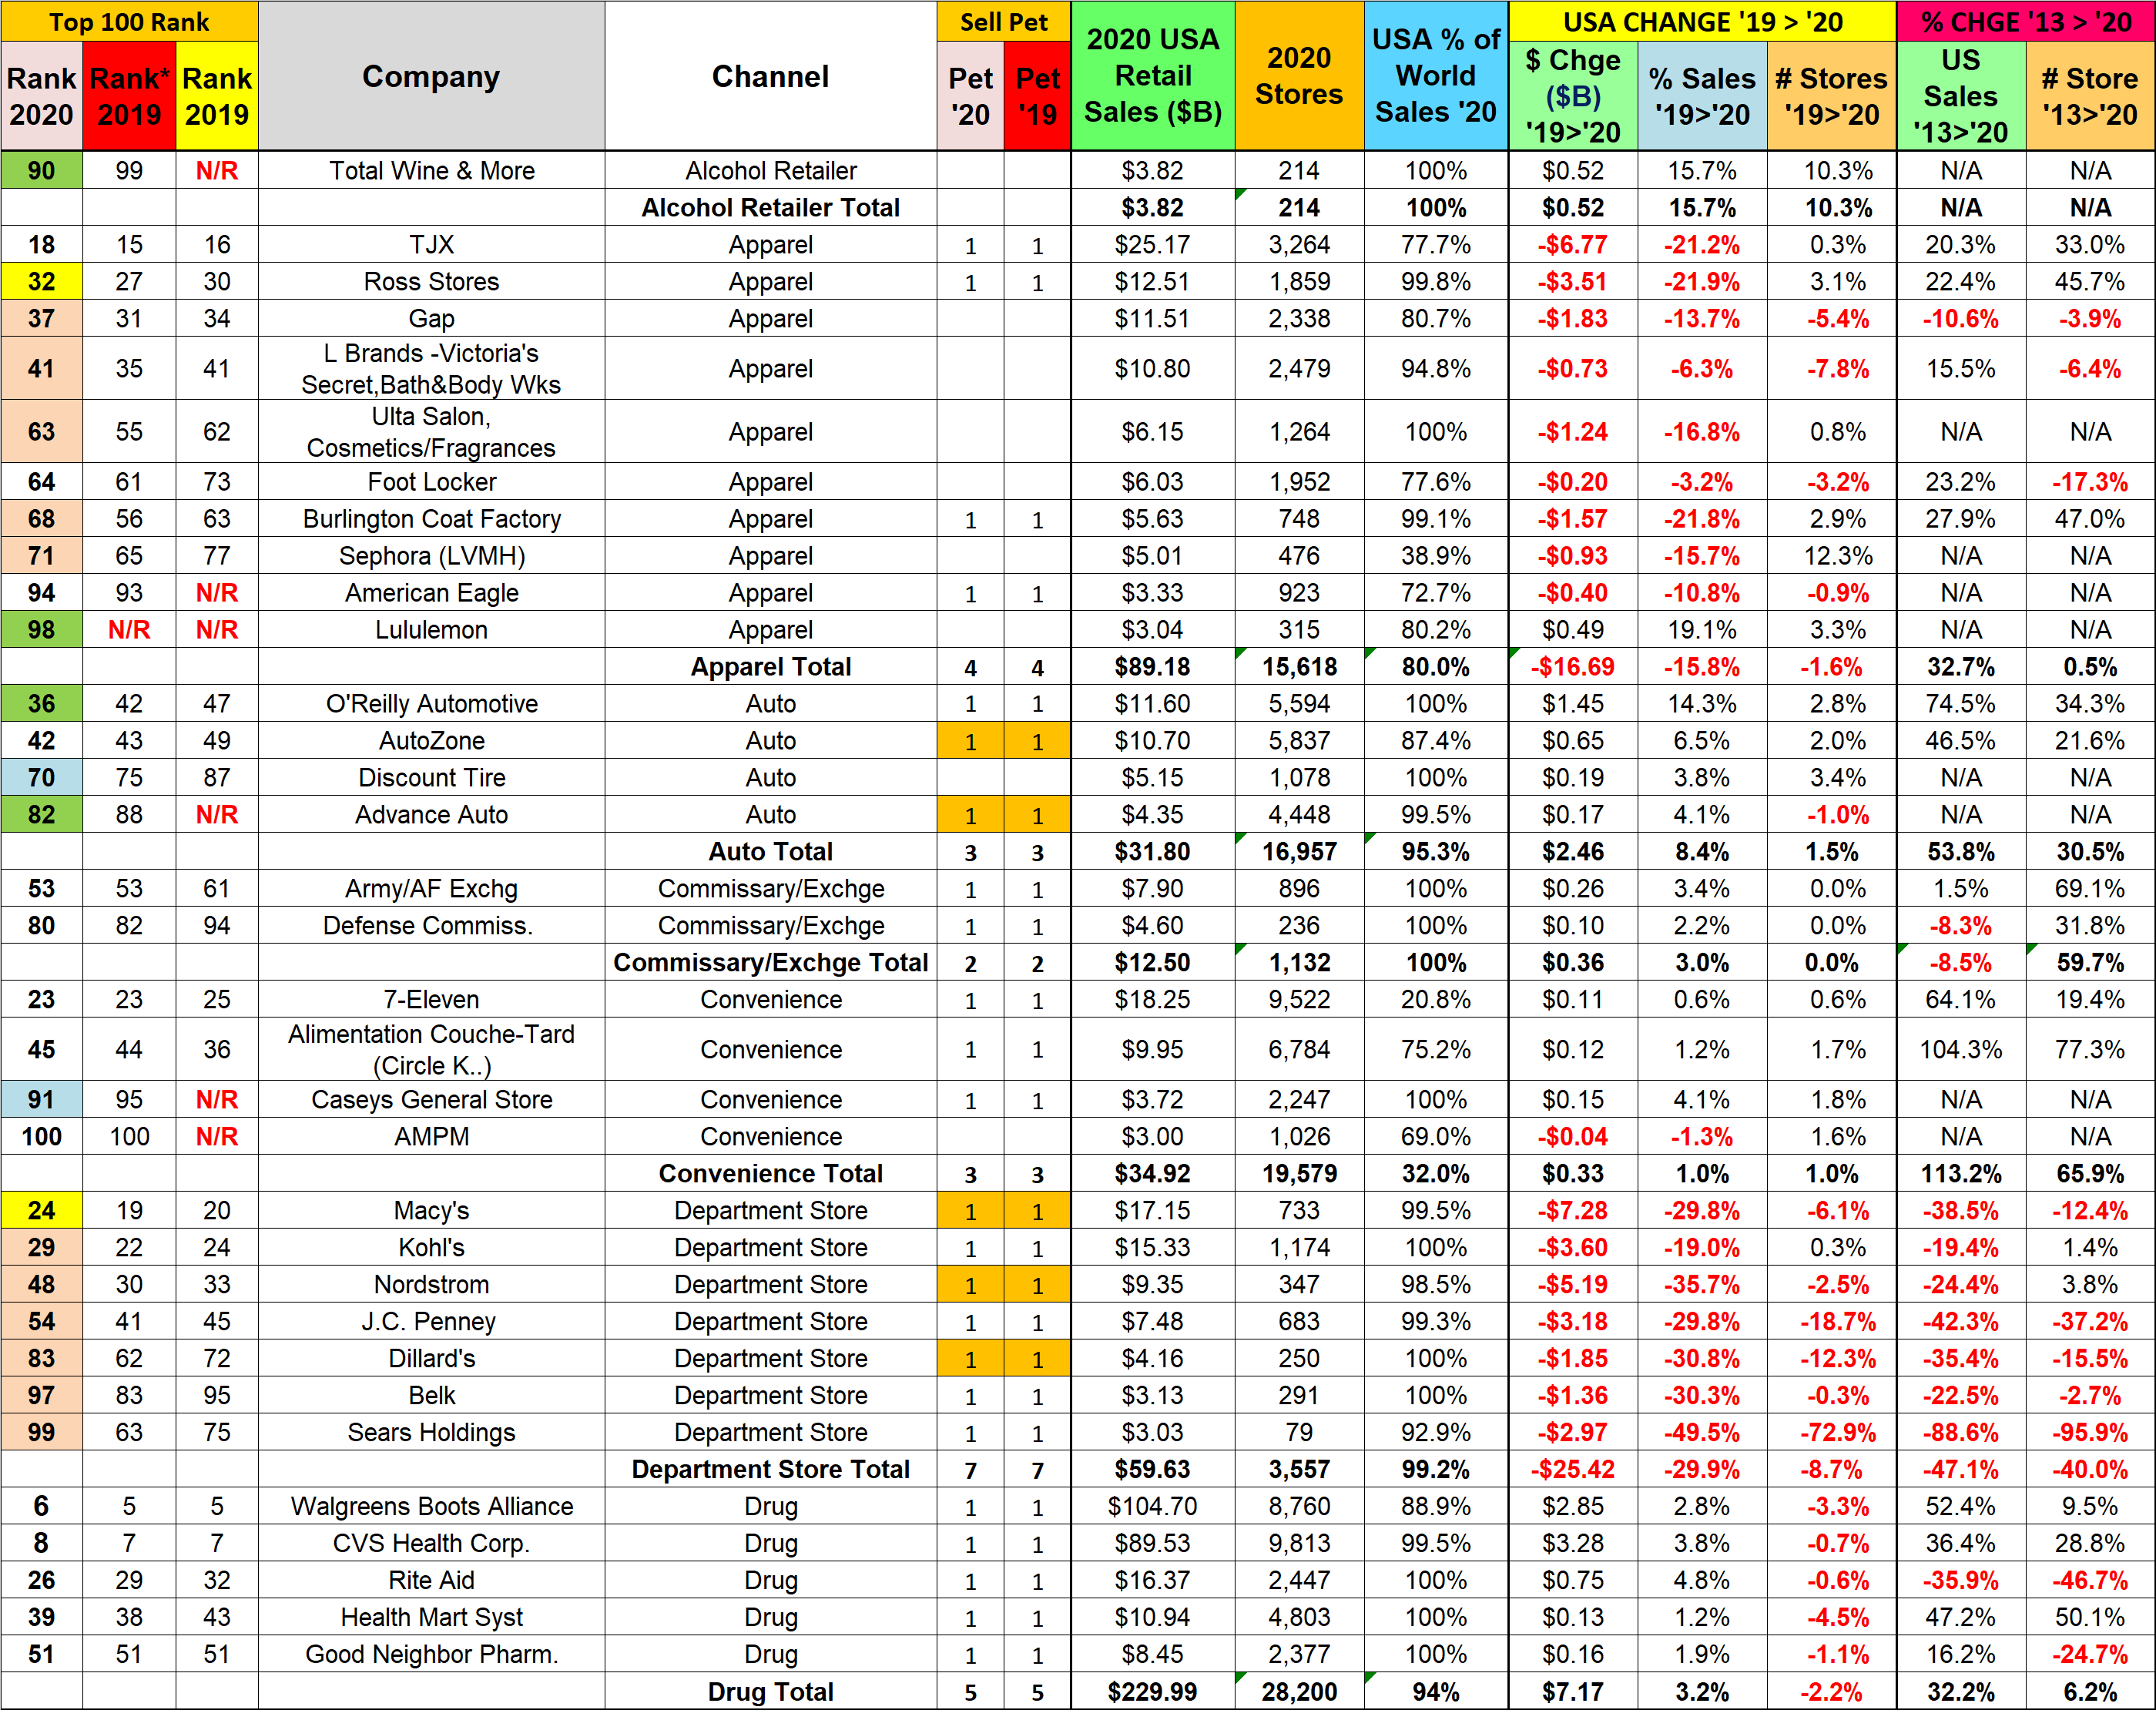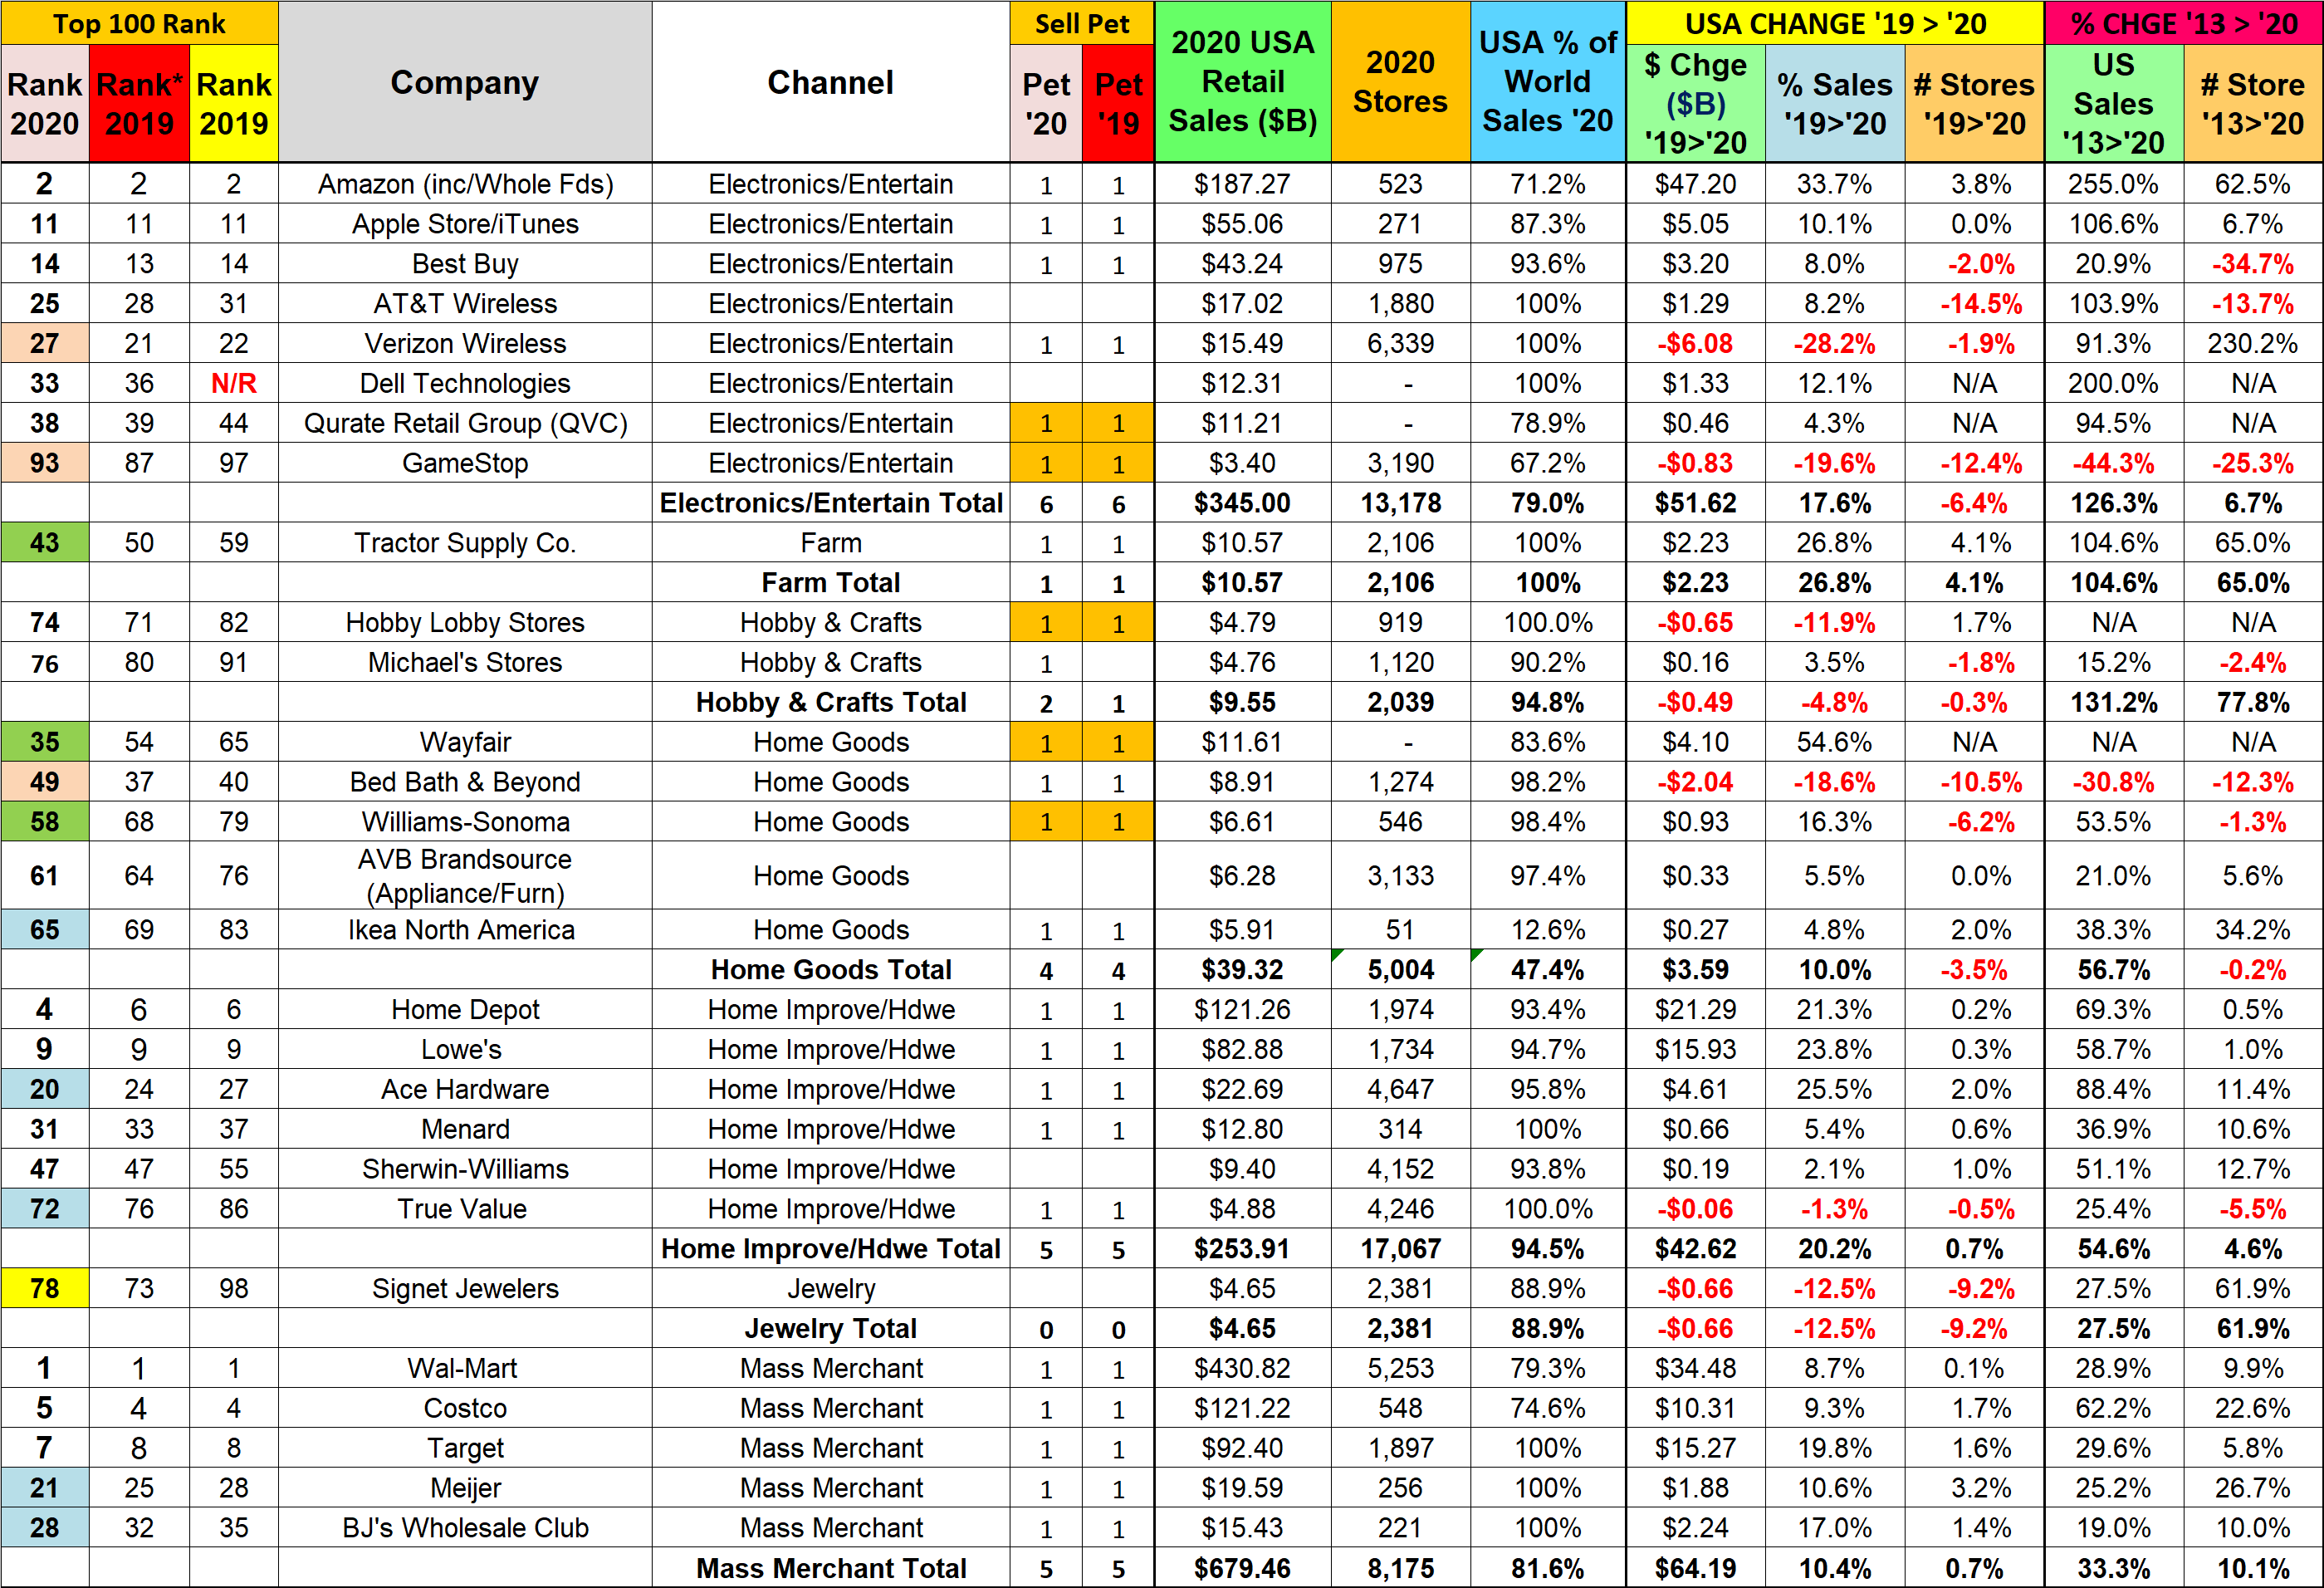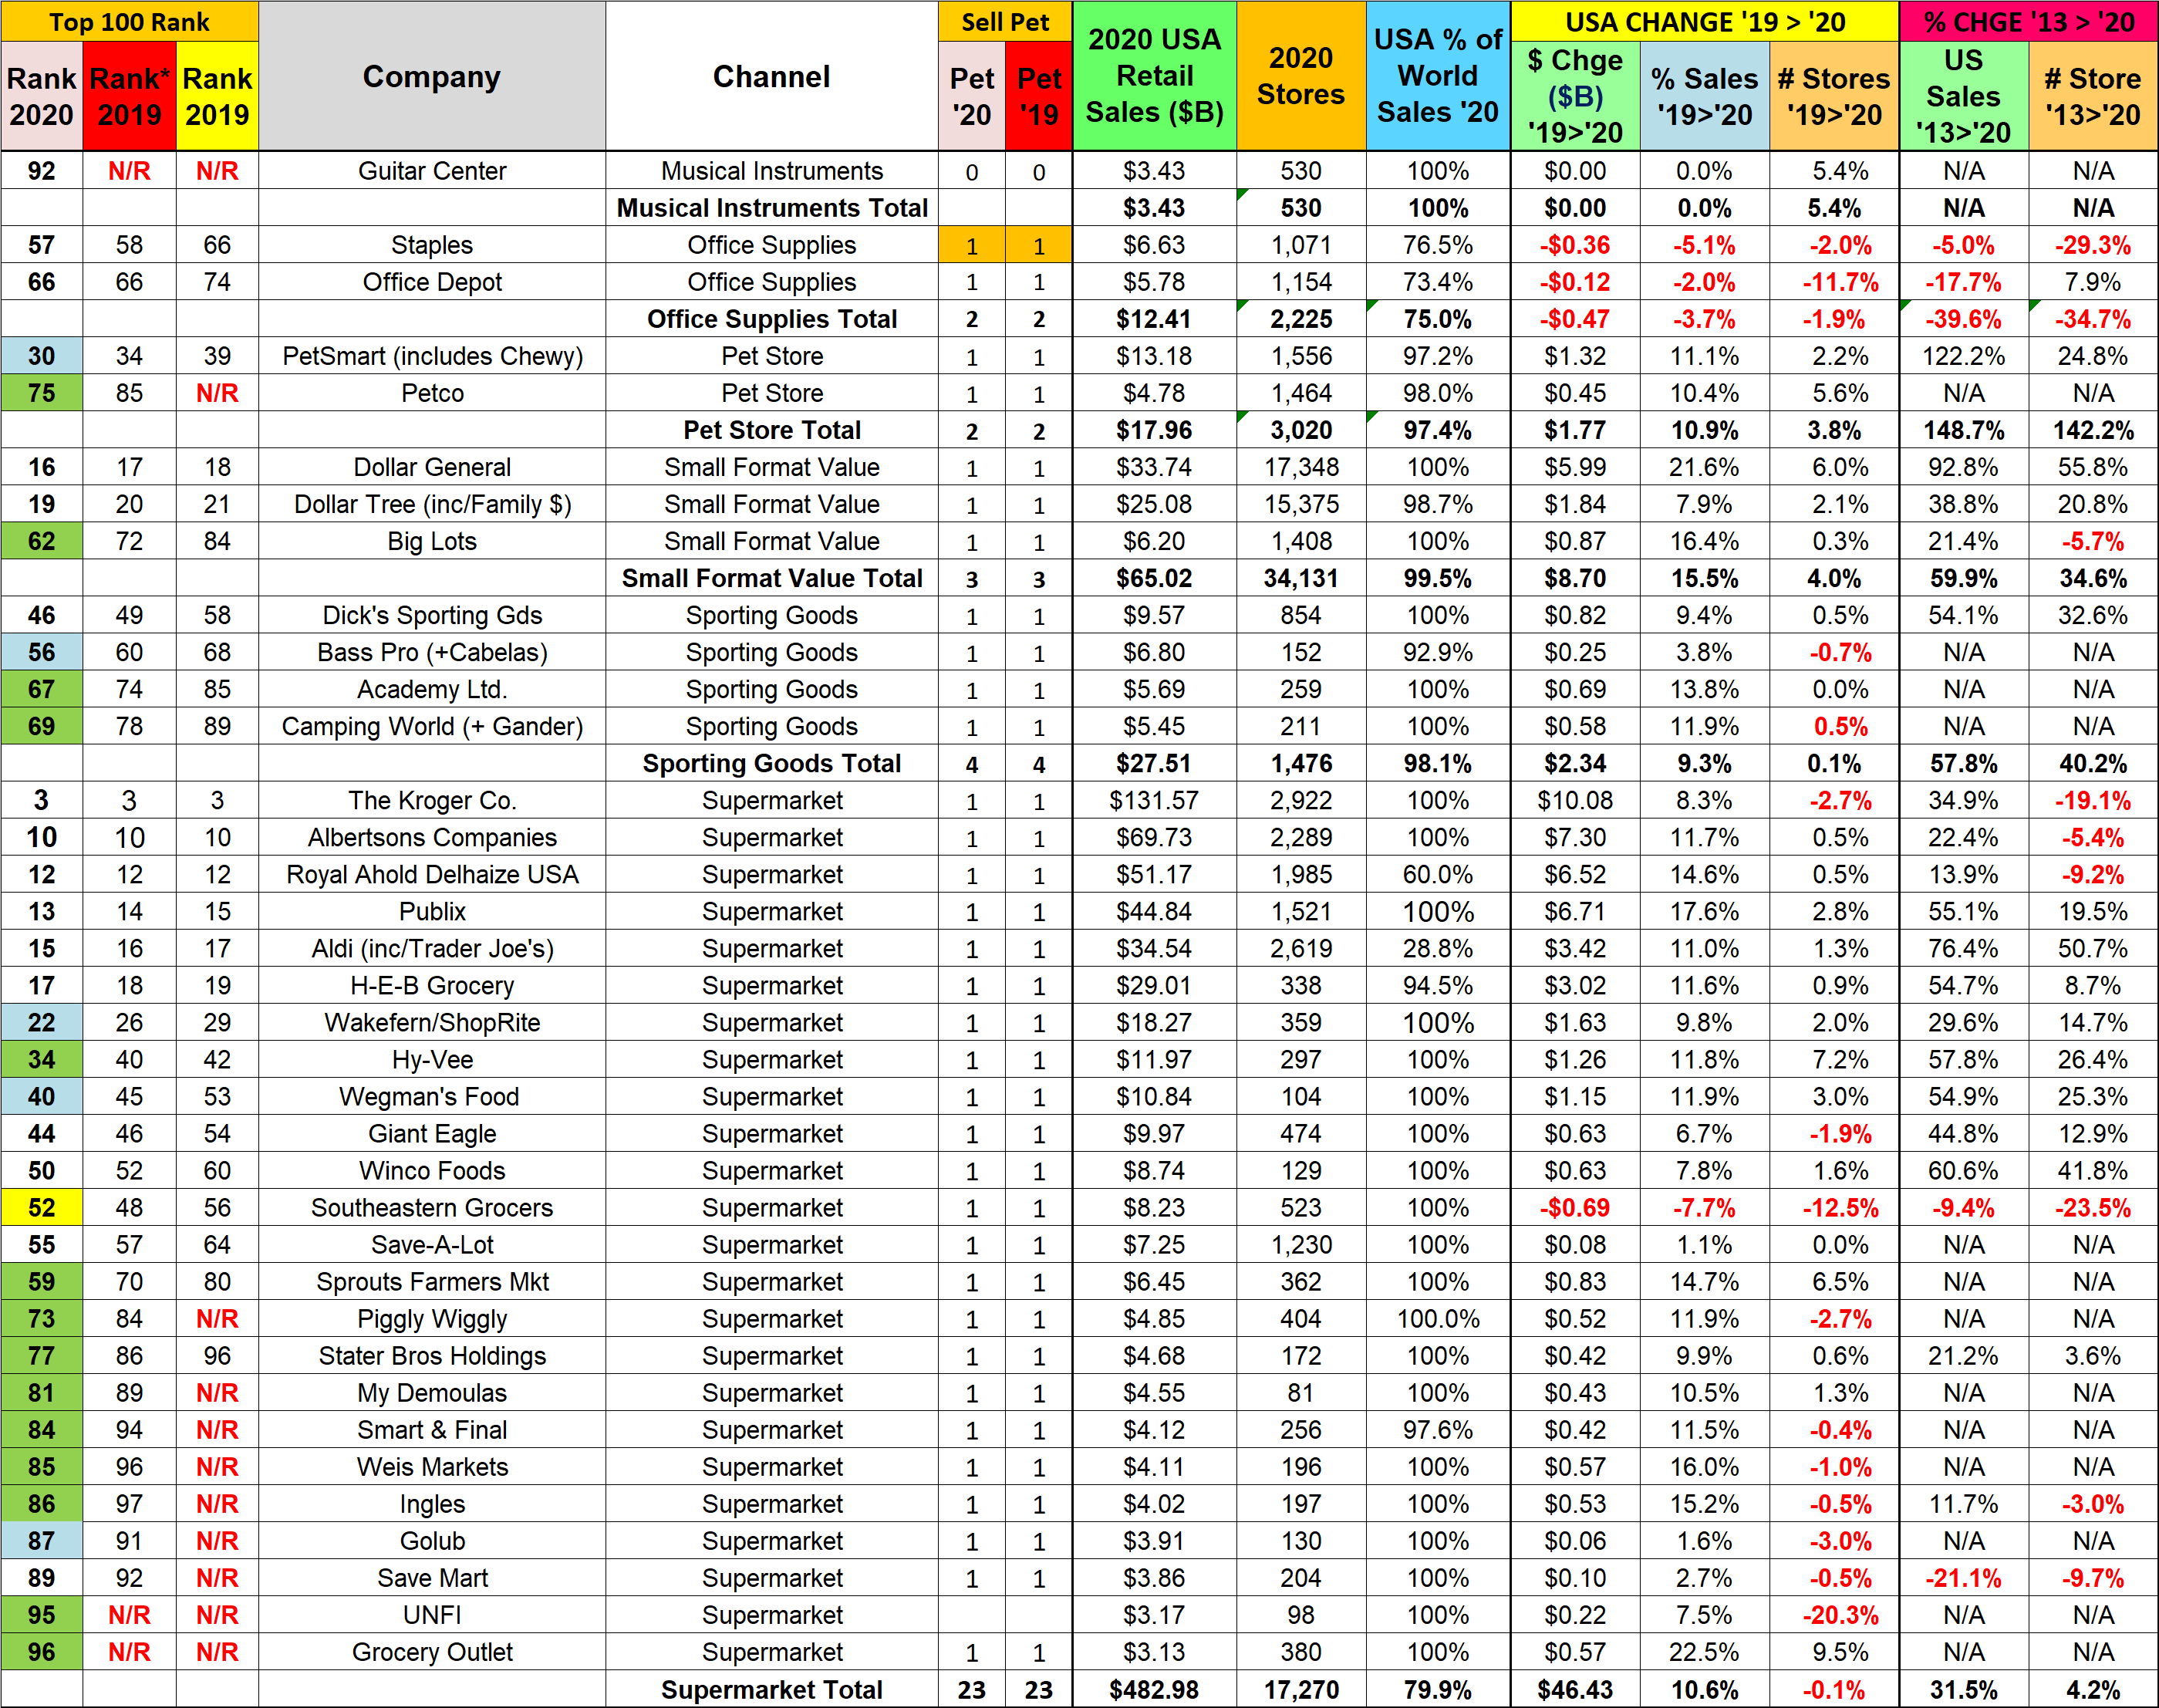
Retail Channel Monthly $ Update – February Final & March Advance
The pandemic started in March 2020. Since then, in the Retail sector, we have seen both record drops and record highs. The market has generally recovered but now we are being hit by extreme inflation. This can affect retail sales, so we’ll continue to track the retail market with data from two reports provided by the Census Bureau and factor in the CPI from US BLS.
The Census Bureau Reports are the Monthly and the Advance Retail Sales Reports. Both are derived from sales data gathered from retailers across the U.S. and are published monthly at the same time. The Advance Report has a smaller sample size so it can be published quickly – about 2 weeks after month end. The Monthly Final Report includes data from all respondents, so it takes longer to compile the data – about 6 weeks. Although the sample size for the Advance report is smaller, the results over the years have proven it to be statistically accurate with the final monthly reports. The biggest difference is that the full sample in the Final report allows us to “drill” a little deeper into the retail channels.
We begin with the Final Report for February and then move to the Advance Report for March. We’ll compare 2022 to 2021, 2020 and 2019. We will show both the actual and the “real” change in $ as we factor inflation into the data.
Both reports include the following:
- Total Retail, Restaurants, Auto, Gas Stations and Relevant Retail (removing Restaurants, Auto and Gas)
- Individual Channel Data – This will be more detailed in the “Final” reports, and we fill focus on Pet Relevant Channels
The information will be presented in detailed charts to facilitate visual comparison between groups/channels of:
- Current Month change – % & $ vs previous month
- Current Month change – % & $ vs same month in 2021, 2020 and 2019.
- Current YTD change – % & $ vs 2021, 2020 and 2019
- Monthly and Year To Date $ will also be shown for each group/channel
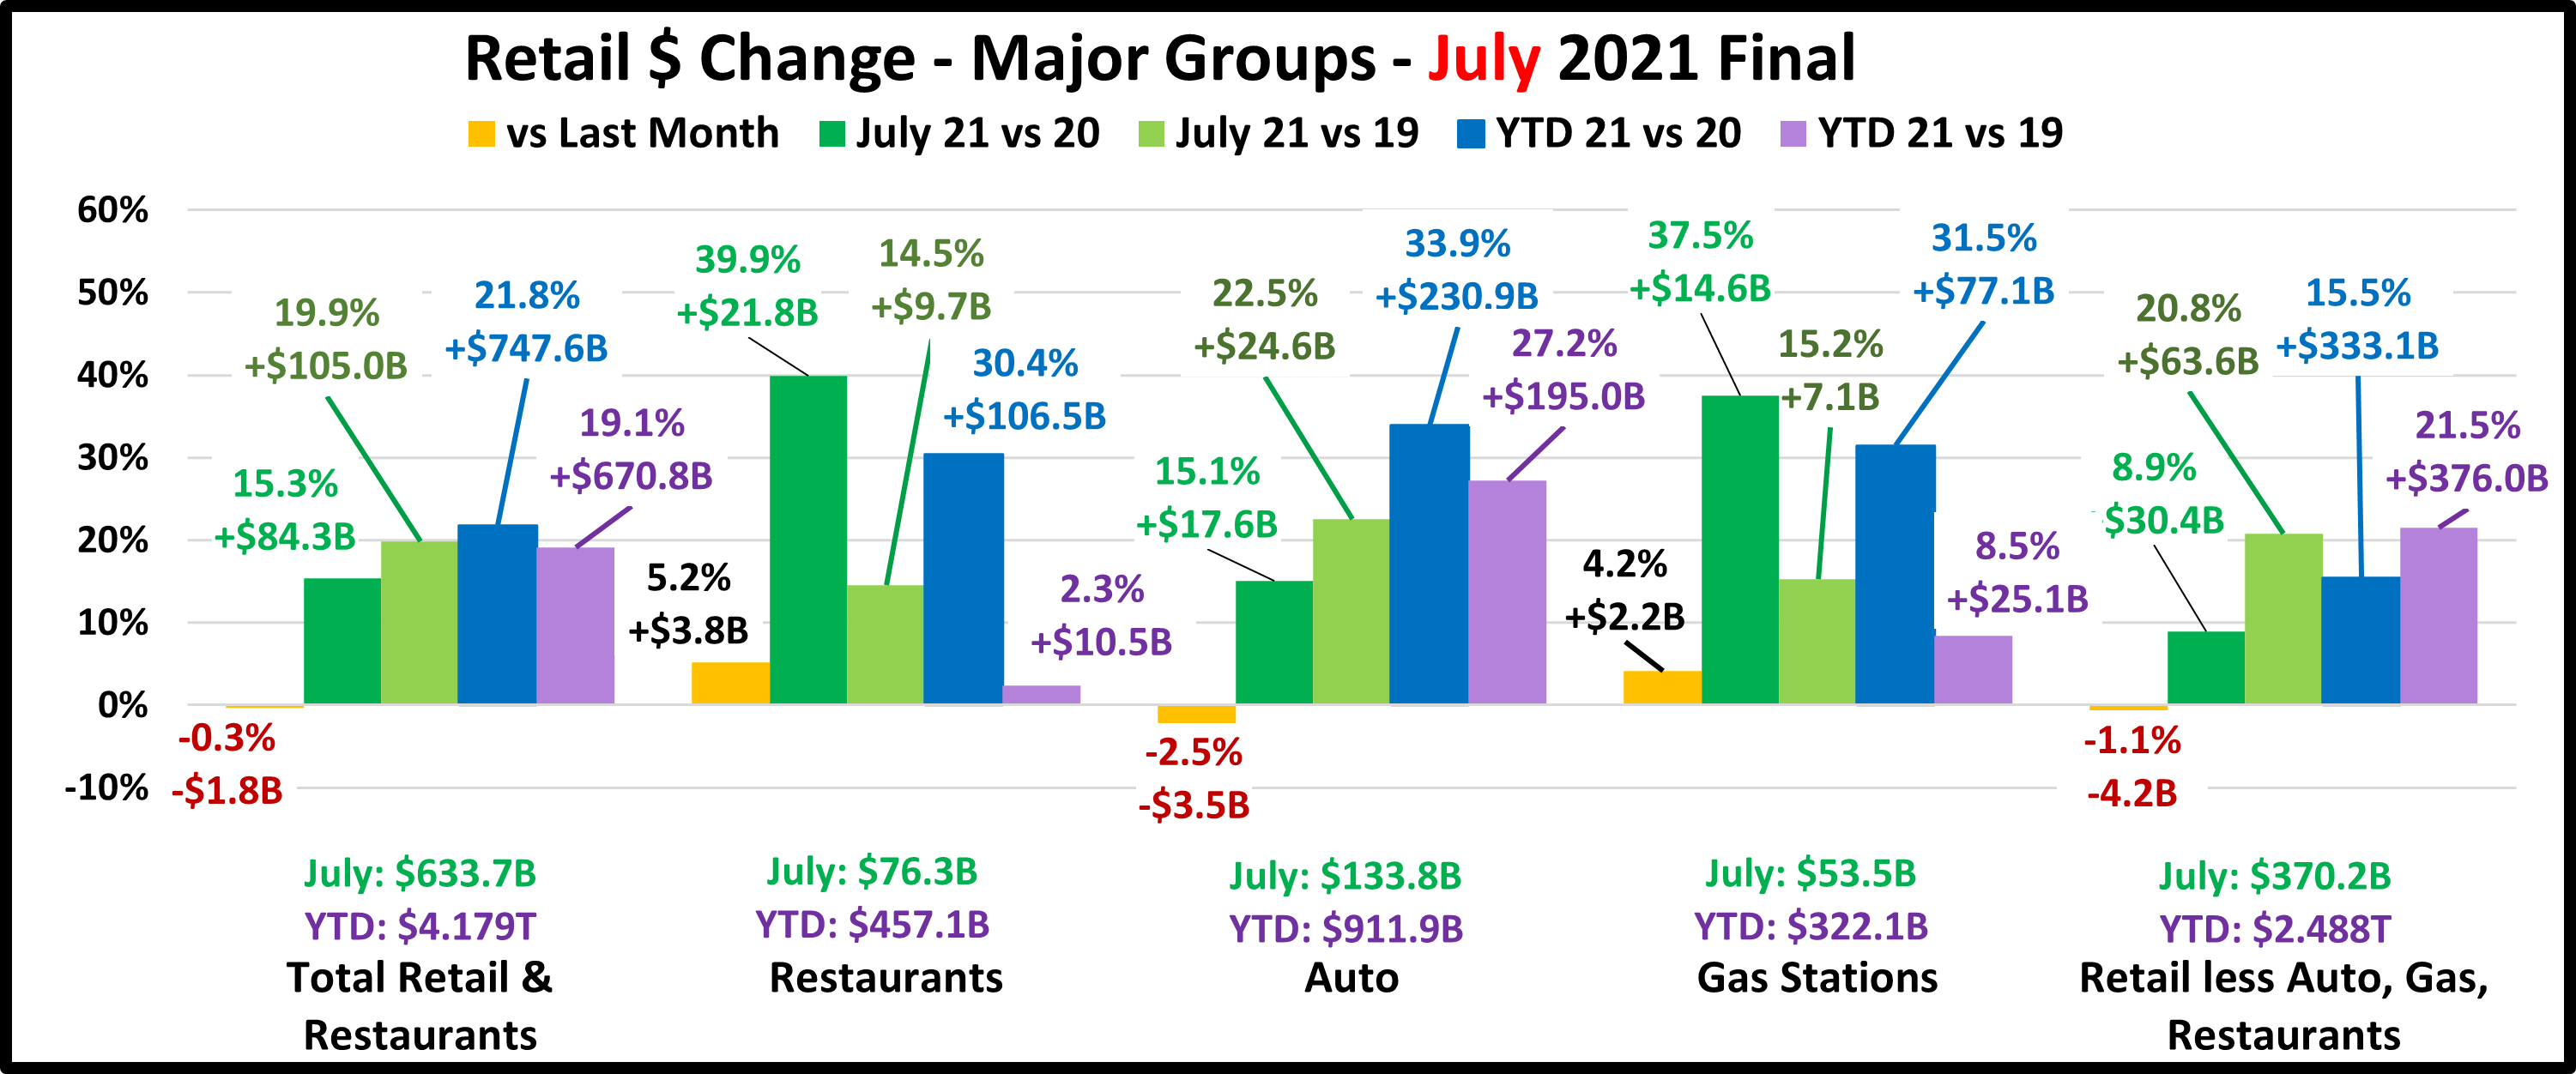
First, the February Final. February is the normal Retail $ bottom for the year. The drop from January was minor and only happened in Relevant Retail but it drove Total Retail down. Sales vs 2021 remain strong with double digit increases in both monthly and YTD for all groups. Here are the major retail groups. (All $ are Actual, Not Seasonally Adjusted)

The February Final is $2.6B more than the Advance Report. All groups were up. Restaurants: +$0.6B; Auto: +$0.7B; Gas Stations: +$0.4B; Relevant Retail: +$0.9B. The normal drop in retail sales from January only happened in Relevant Retail and is less than in past years. The late recovery for Restaurants and Gas Stations is still surging. All groups have now been positive vs past years for 9 consecutive months. Now, let’s look at the “Real” February lift vs 2021, factoring in inflation. Here are the numbers:
- Total Retail: National CPI: 7.9%, YTD: 7.7%; Sales Feb: +18.2% , Real: 10.3% (56.6%); YTD: 15.7%, Real: 8.0% (51.0%)
- Restaurants: Food away from home CPI: 6.8%; YTD: 6.4%; Sales Feb: 34.3%, Real: 27.5% (80.2%); YTD: 29.1%, Real: 22.7% (78.0%)
- Auto: New & Used Vehicles CPI: 23.5%, YTD: 23.1%; Sales Feb: 18.3%, Real: -5.2%; YTD: 15.7%, Real: -7.4%
- Gas Stations: Gasoline CPI: 38.0%, YTD: 40.0%; Sales Feb: 37.7%, Real: -0.3%; YTD: 35.4%, Real: -4.6%
- Relevant Rtl: National CPI: 7.9%, YTD: 7.7%; Sales Feb: 13.1%, Real: 5.2% (46.8%); YTD: 11.2%, Real: 3.5% (31.3%)
Inflation is becoming a big factor in all but Restaurants.
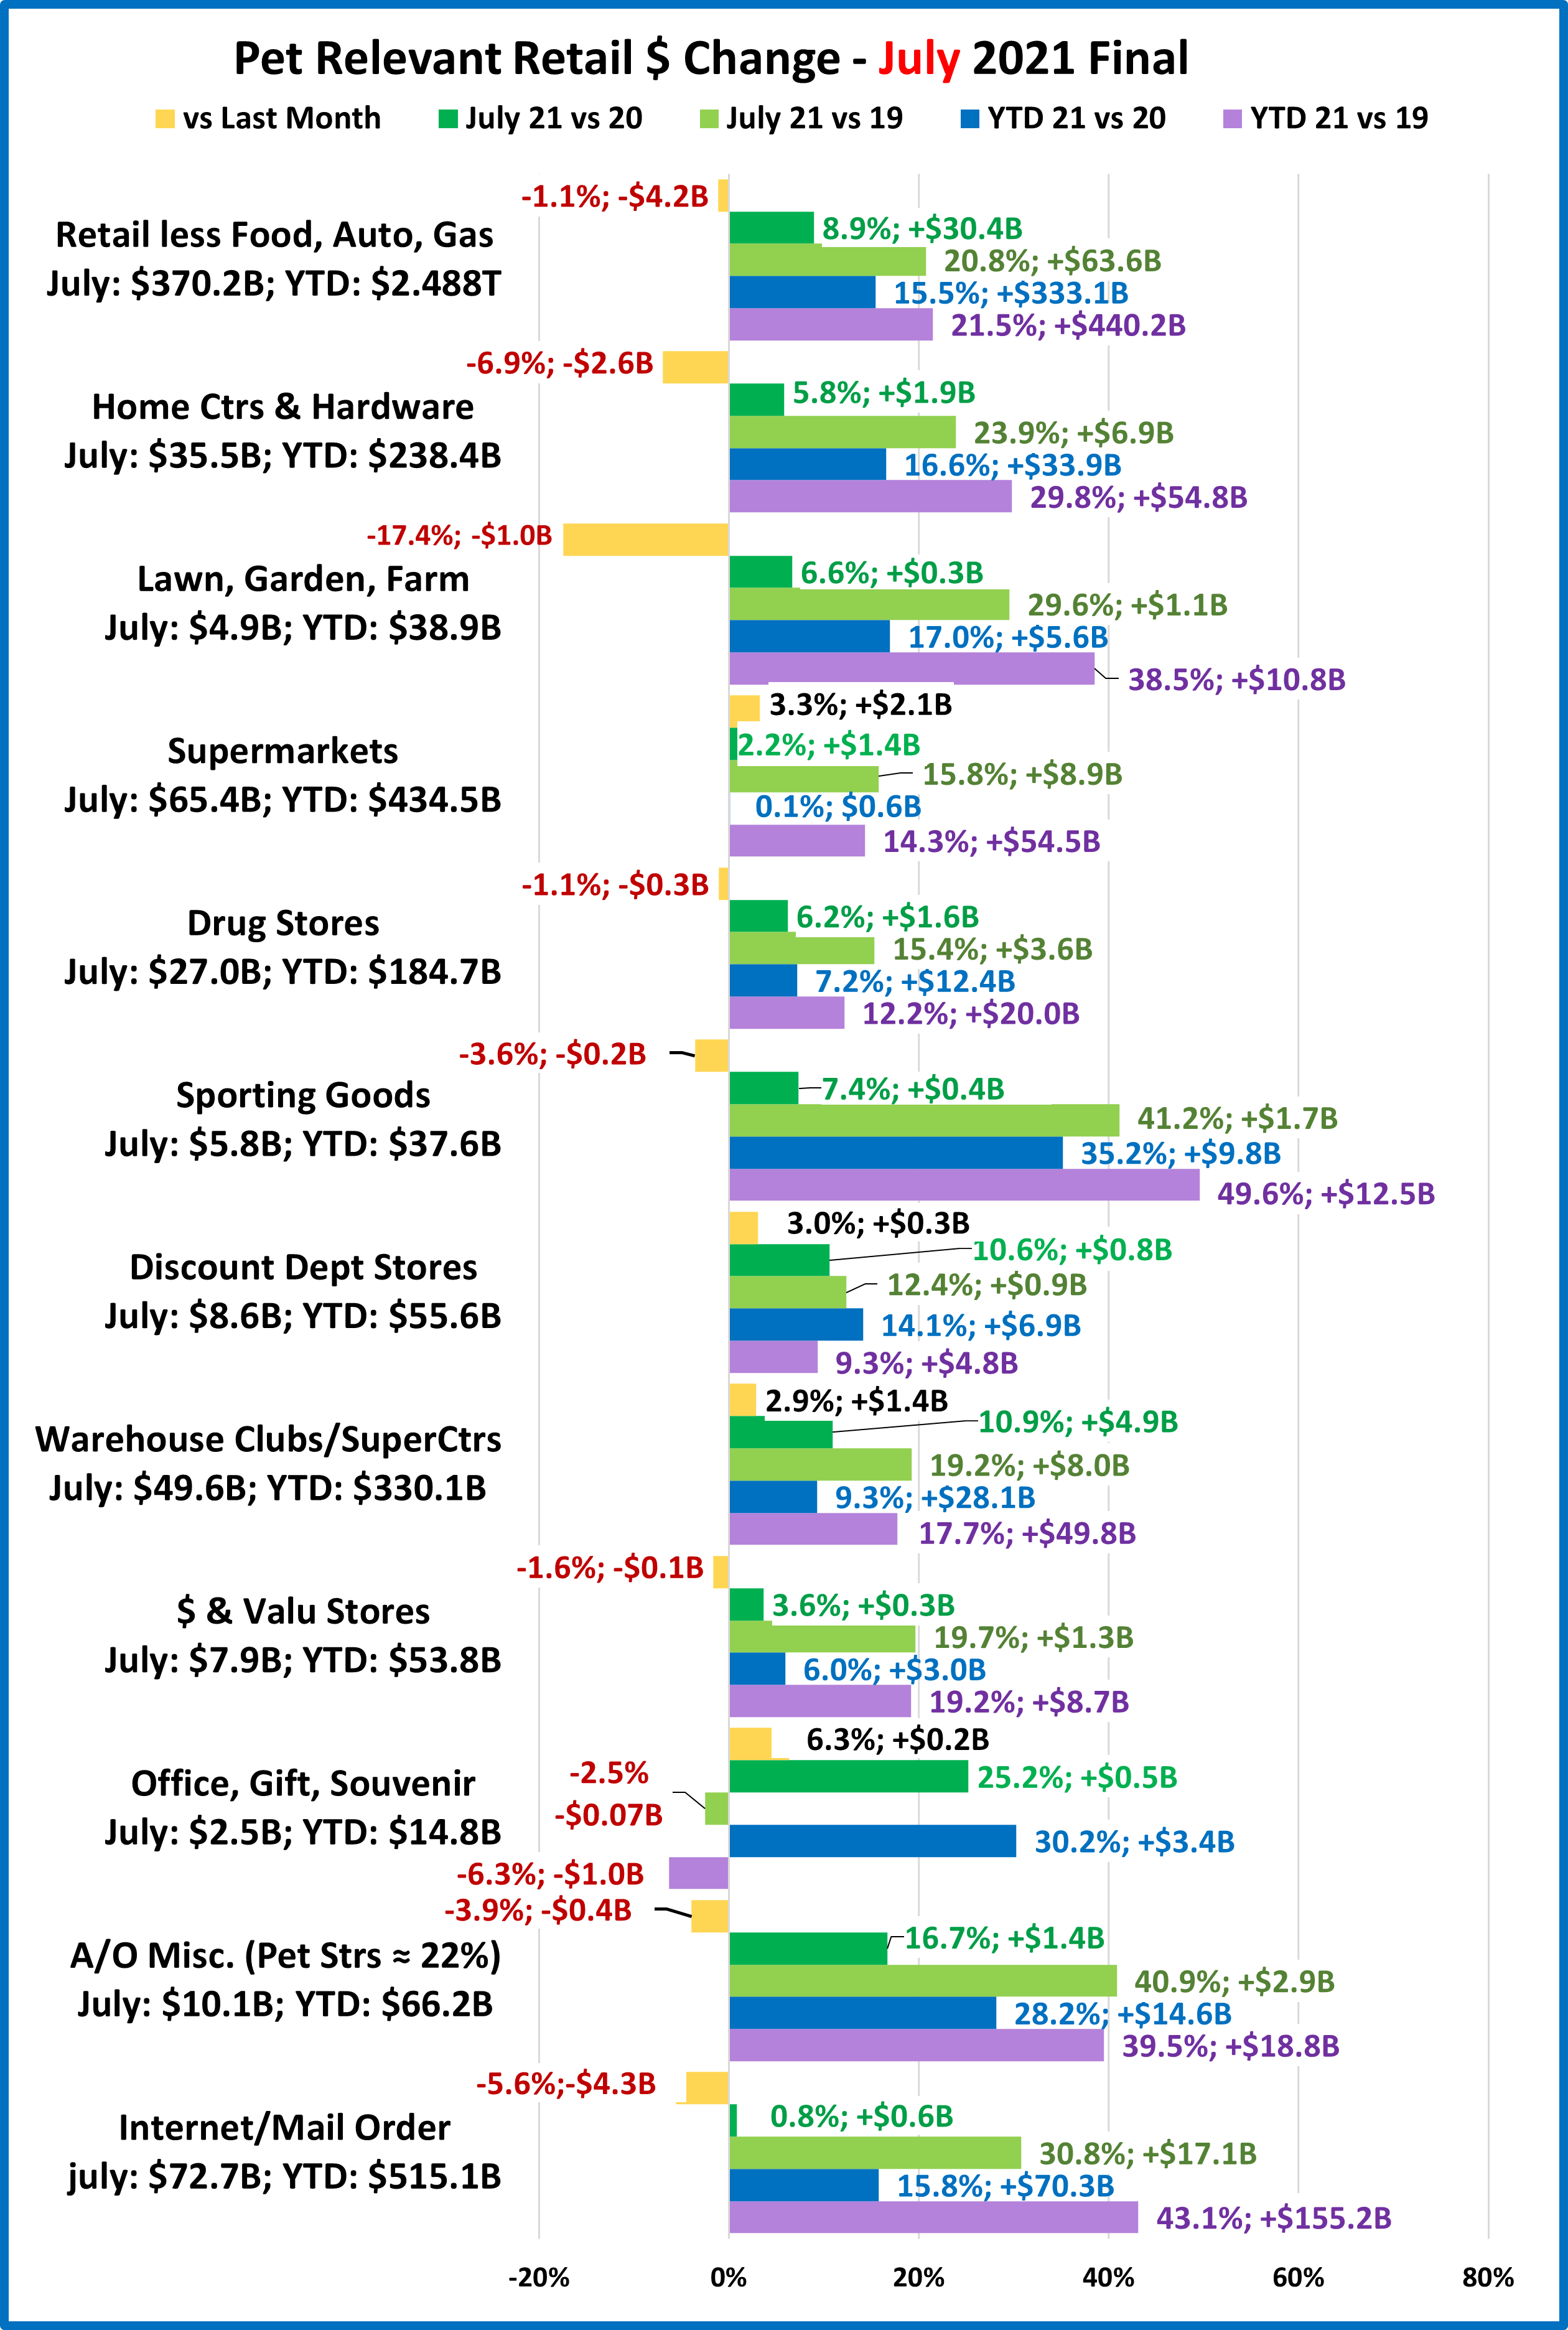
Now, let’s see how some Key Pet Relevant channels did in February.
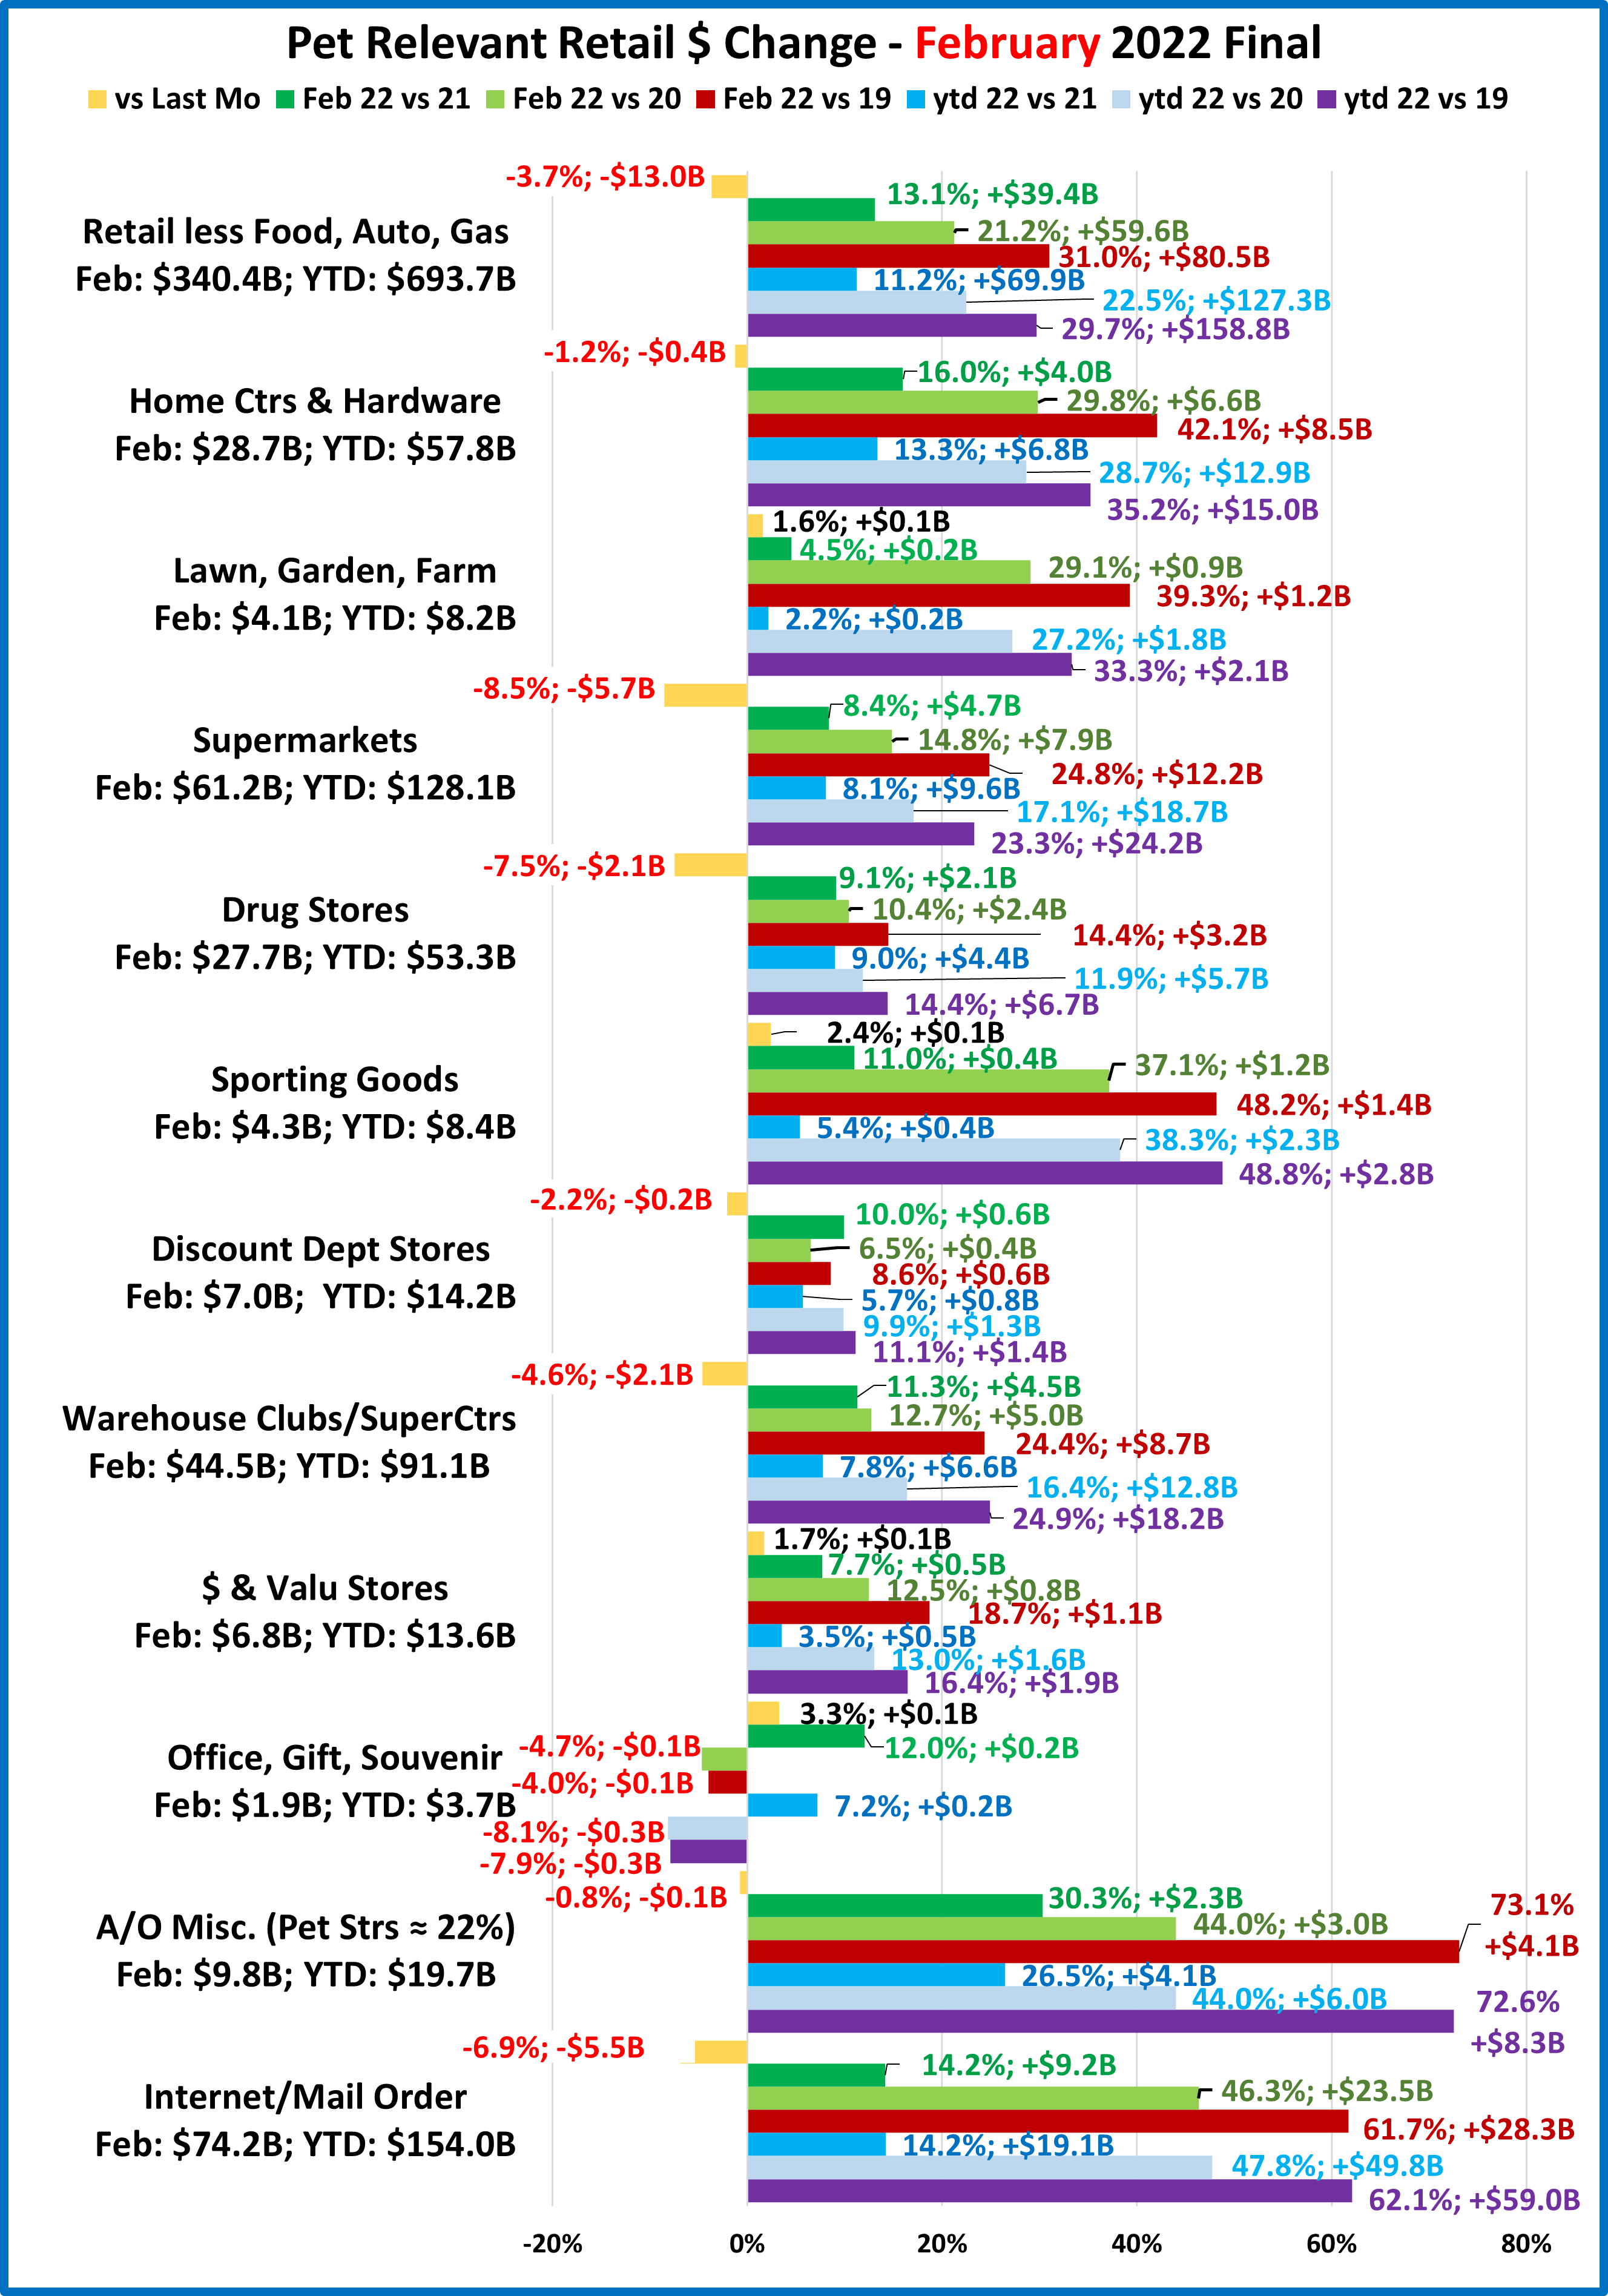
Overall – You see the normal February drop as 7 of 11 were down vs January. However, only one channel, Office, Gift & Souvenir Stores is down in any other measurement. Evidence of a strong recovery by Relevant Retail.
- Building Material Stores – Their amazing lift has slowed in the winter months. Most of the increase from 2019 for both Home Ctr/Hdwe and Farm Stores came from the 20>21 lift. Home Ctr/Hdwe $ are starting to grow again but it’s still a little early in the year for the Farm Stores big lift. The February and YTD inflation rate for Tools, Hdwe, Outdoor Equip/Supp were both 10.7%. That makes the February numbers:
- Home Ctr/Hdwe Feb: +16.0%, Real: +5.3%;YTD: +13.3%, Real: +2.6%
- Farm Stores: Feb: +4.5%, Real:-6.2%; YTD: +2.2%, Real: -8.5% A big inflation impact!
- Food & Drug – Both channels are truly essential. Except for the food binge buying in the pandemic, they tend to have smaller fluctuations in $. Both had big drops from January but have had regular growth since 2019. Supermarkets’ growth has been stronger due to more families choosing to cook at home. Inflation for Food at Home was Feb: 8.6%, YTD: 8.0%. Drug Inflation (Rx & OTC): Feb: 2.5%. YTD: 1.9%. Growth was:
- Supermarkets Feb: +8.4%, Real: -0.2%; YTD: +8.1, Real: +0.1% Grocery inflation had a big impact.
- Drug Stores Feb: +9.1%, Real: +6.6%; YTD: +9.0%, Real: +7.1%
- Sporting Goods Stores – Like Hardware/Farm stores, they benefited from the pandemic in that consumers turned to self-entertainment, especially sports & outdoor activities. Sales are up after a big drop in January, so they are positive in all measurements. The high demand has pushed the inflation rate for Sporting Goods to Feb: 7.1%. YTD: 7.6%. Sales growth was: Feb: +11.0%, Real: +3.9%; YTD: +5.4%, Real: -2.2%. Inflation kept real YTD sales negative.
- Gen Mdse Stores – $ in all channels fell from January but all were up from 2021. SuperCtrs/Clubs have a higher % of groceries which results in more frequent visits and generally higher growth numbers. Disc. Dept Stores were struggling before COVID but had a strong 2021. Using the overall CPI of 7.9%, YTD: 7.7%, sales growth was:
- SupCtr/Club Feb: 11.3%, Real: +3.4%; YTD: +7.8%, Real: 0.1%
- $/Value Strs Feb: +7.7%, Real: -0.2%; YTD: +3.5%, Real: -4.2% $ Stores focus on price, so it’s no surprise that inflation hit them hard.
- Disc. Dept. Strs Feb: +10.0%, Real: 2.1%; YTD: 5.7%, Real: -2.0%.
- Office, Gift & Souvenir Stores – Their recovery didn’t start until the spring of 2021, but they are still not there yet. Sales are up vs 2021, but every other measurement is negative. The available inflation number most appropriate for them is “limited” as it cuts out food, energy, shelter and used vehicles. Feb: 5.5%.YTD: 5.3%. Sales are Feb: +12.0%, Real: +6.5%; YTD: +7.2%, Real: +1.9%.
- Internet/Mail Order – The sales growth of the “hero” of the Pandemic is slowing. With inflation at 7.9%, YTD: 7.6%. they were Feb: 14.2%, Real: 6.3%; YTD: +14.2%, Real: +6.6%. Their avg growth rate is 17.5%. Inflation widens the gap.
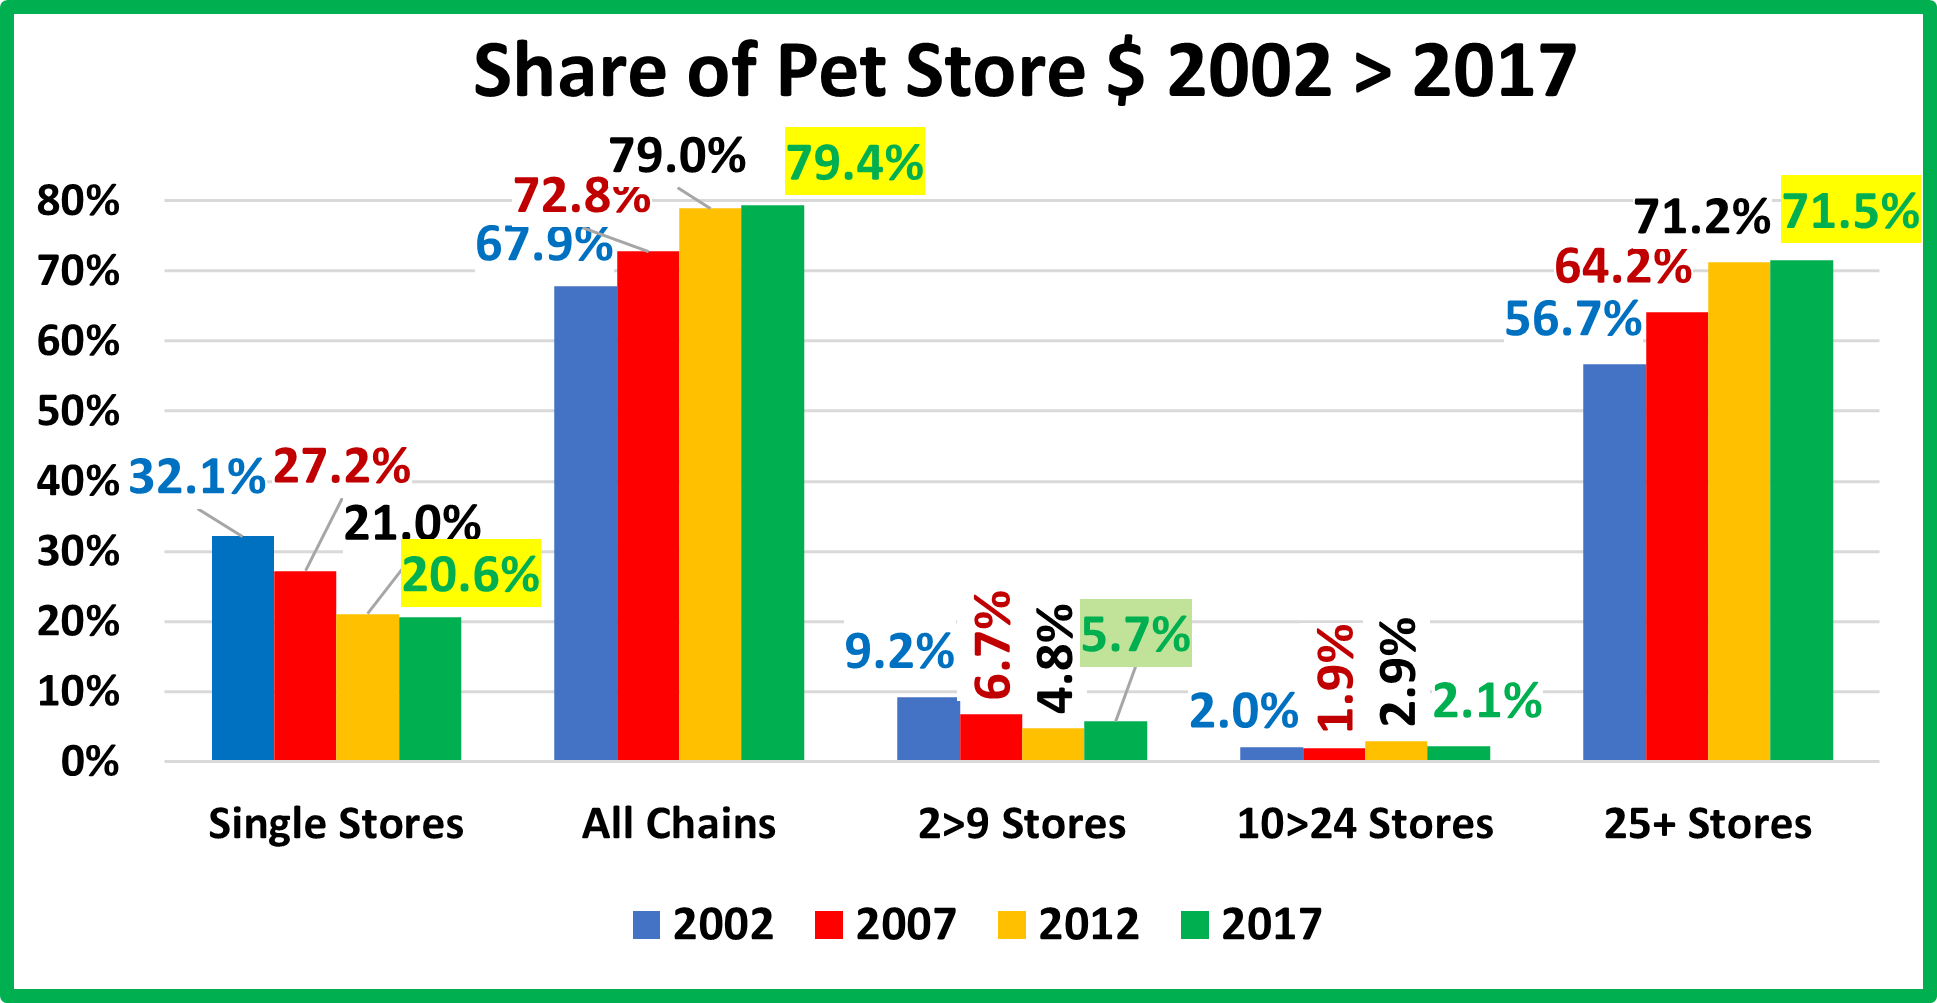
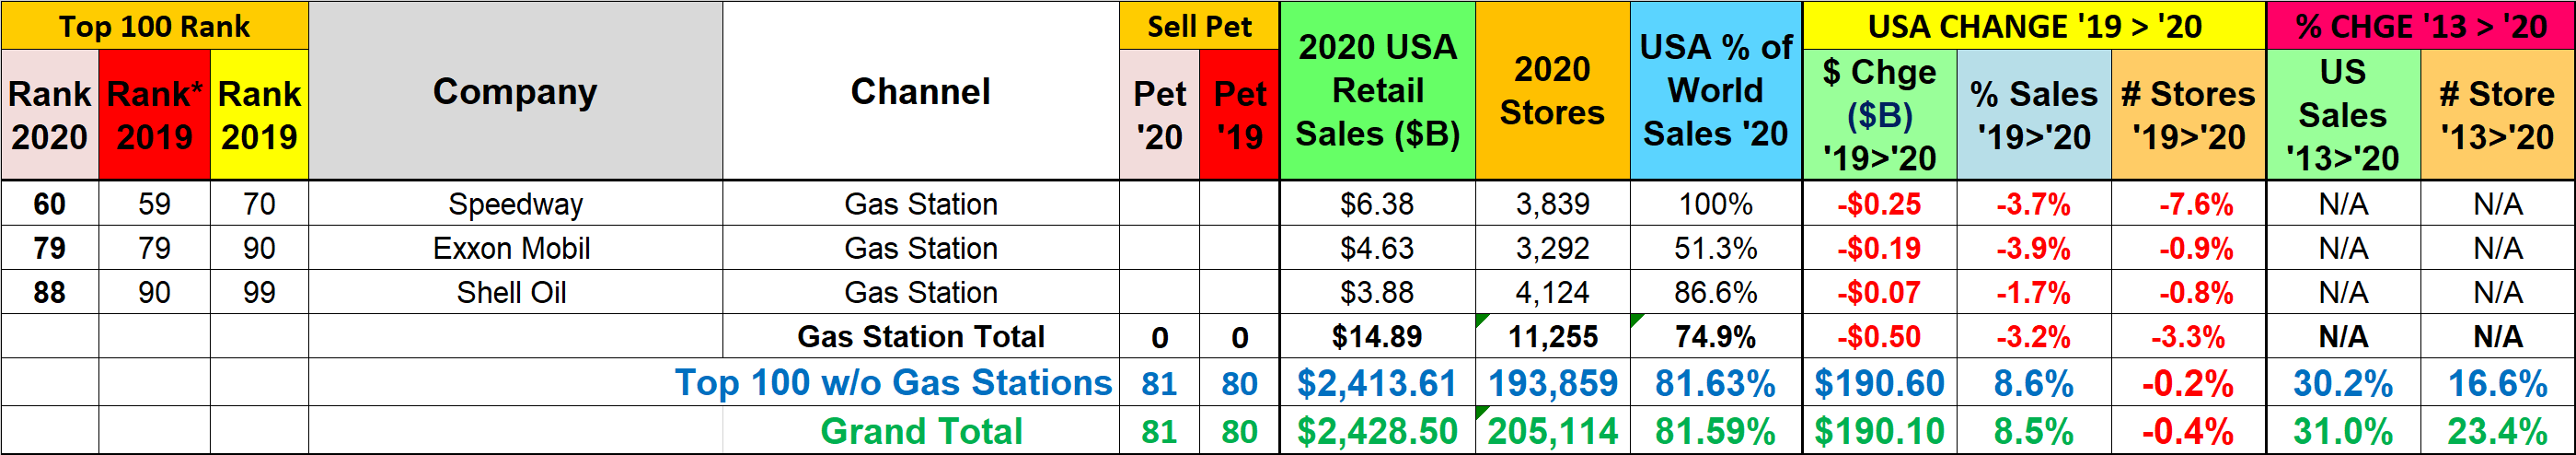
- A/O Miscellaneous – This is a group of specialty retailers. Pet Stores are 22>24% of total $. In May 2020 they began their recovery which reached a record level by December 2021 as annual sales reached $100B for the first time. Using the 5.5%, YTD: 5.3% “limited” inflation, Sales were: Feb: +30.3%, Real: +24.8%; YTD: +26.5%, Real: +21.2%. By any measure and even factoring in high inflation, they are the percentage leader in 2022 growth. They are even beating the internet, which is to say the least, surprising.
There is no doubt that high inflation is an important factor in Retail. In actual $, all 11 channels increased monthly & YTD sales over 2021. However, when you factor in inflation, the number with any “real” growth falls to 8 monthly and 7 YTD. Until things change, inflation will be a big part of retail sales discussions. Now, the Advance numbers for March.
We have had memorable times since 2019. Some big negatives, including the 2 biggest monthly drops in history but a lot of positives in the Pandemic recovery. Total Retail reached $600B in a month for the first time and broke the $7 Trillion barrier in 2021. Relevant Retail was also strong as annual sales reached $4T but in fact, all big groups set annual sales records in 2021. Now in late 2021 and continuing into 2022 radical inflation has entered the game. It’s not the biggest increase ever but it is the largest in 40 years. As we have learned in the past, this can first reduce the amount of product sold but not $ spent. However, if it continues, it can actually reduce consumer spending. This could reverse many gains.
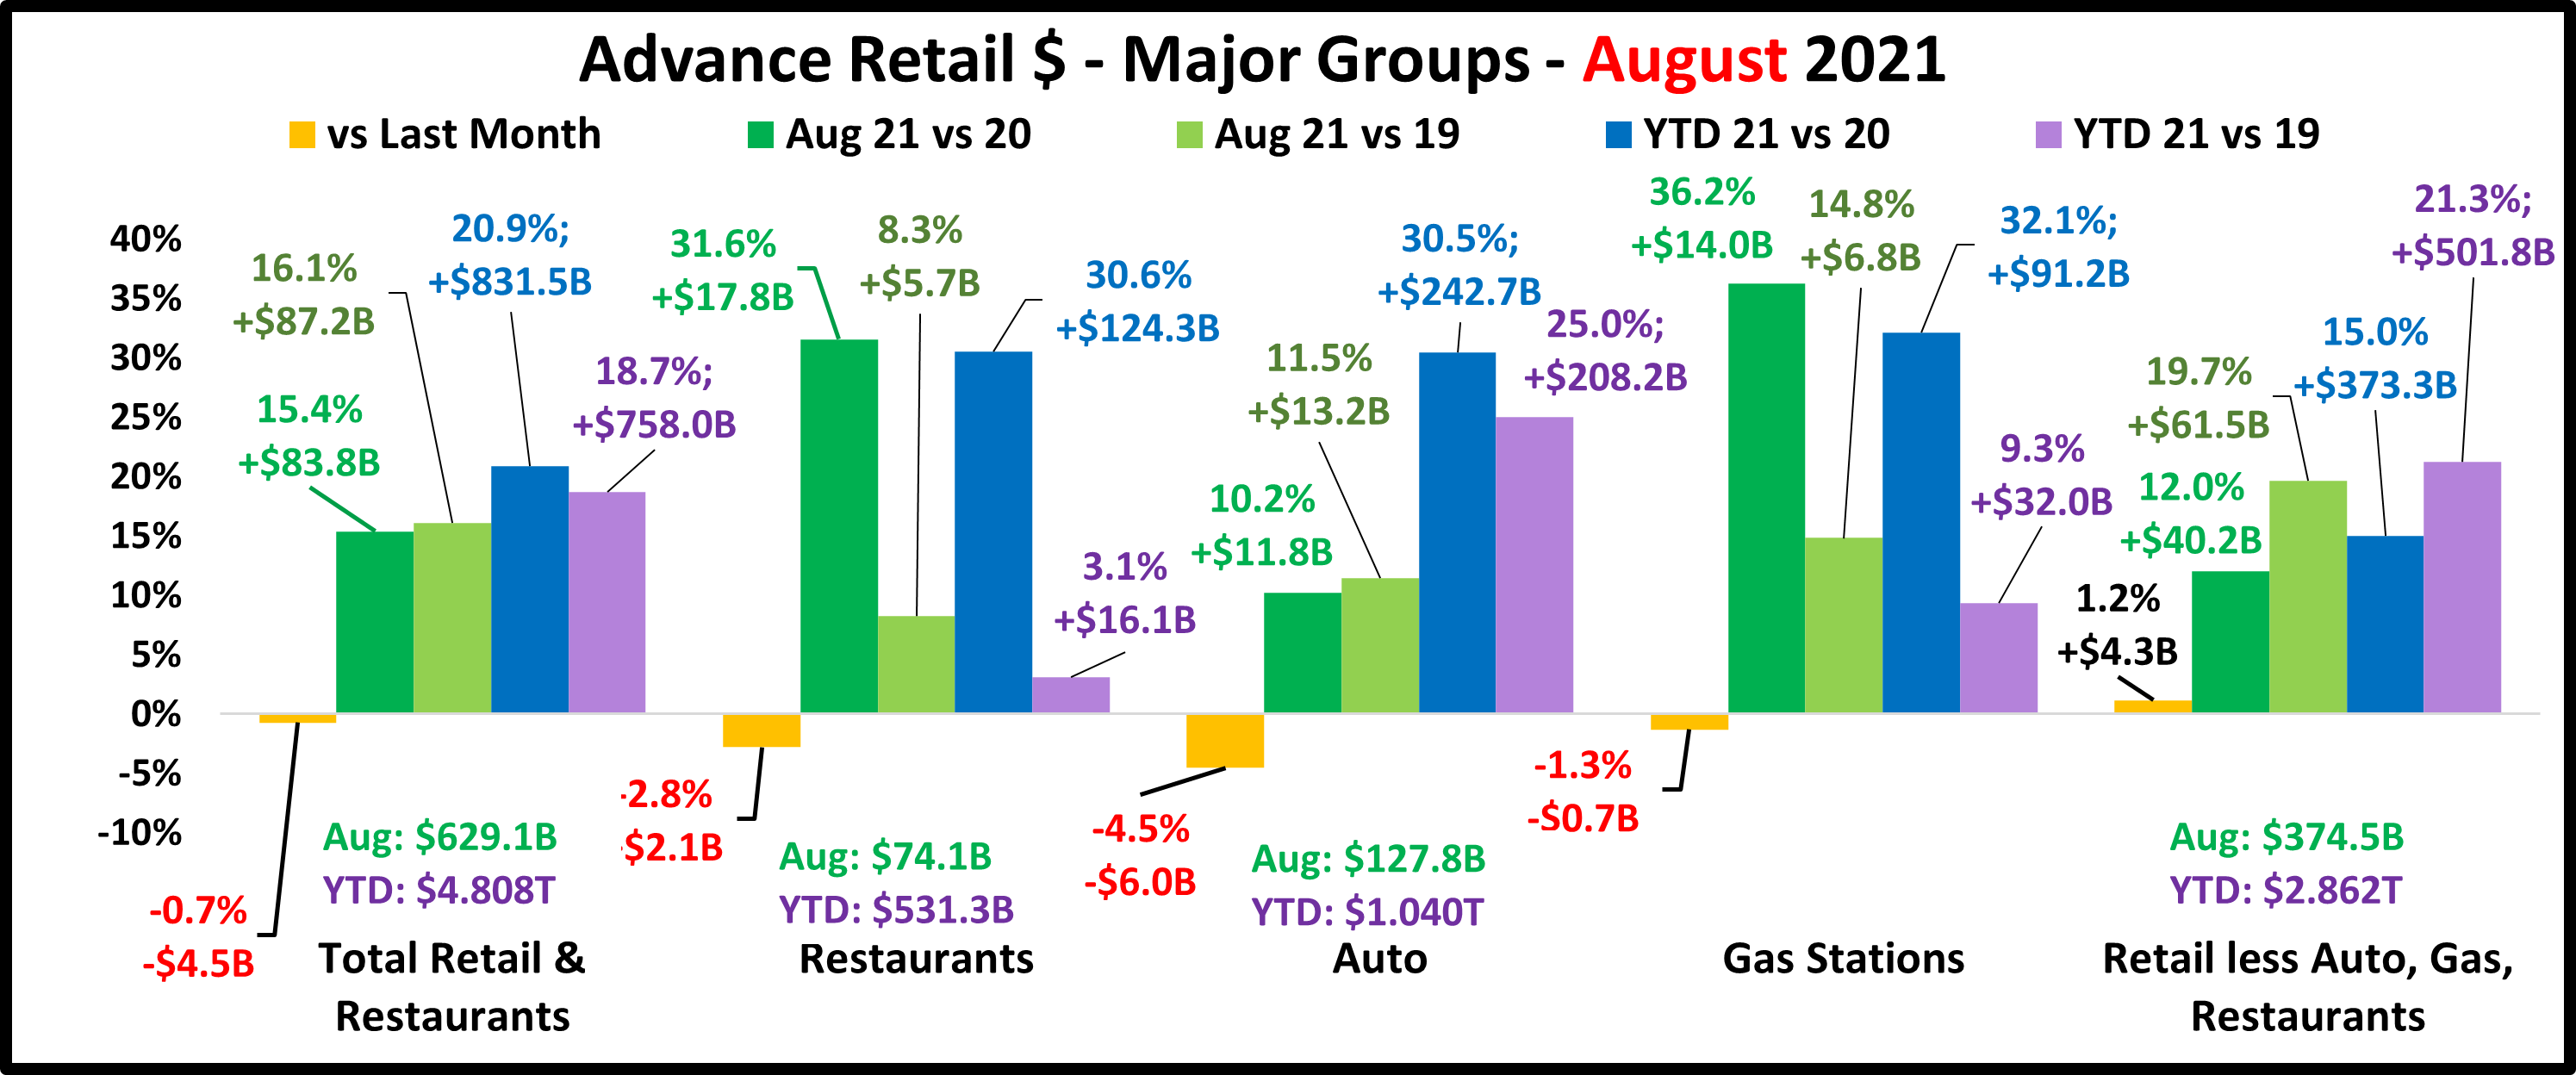
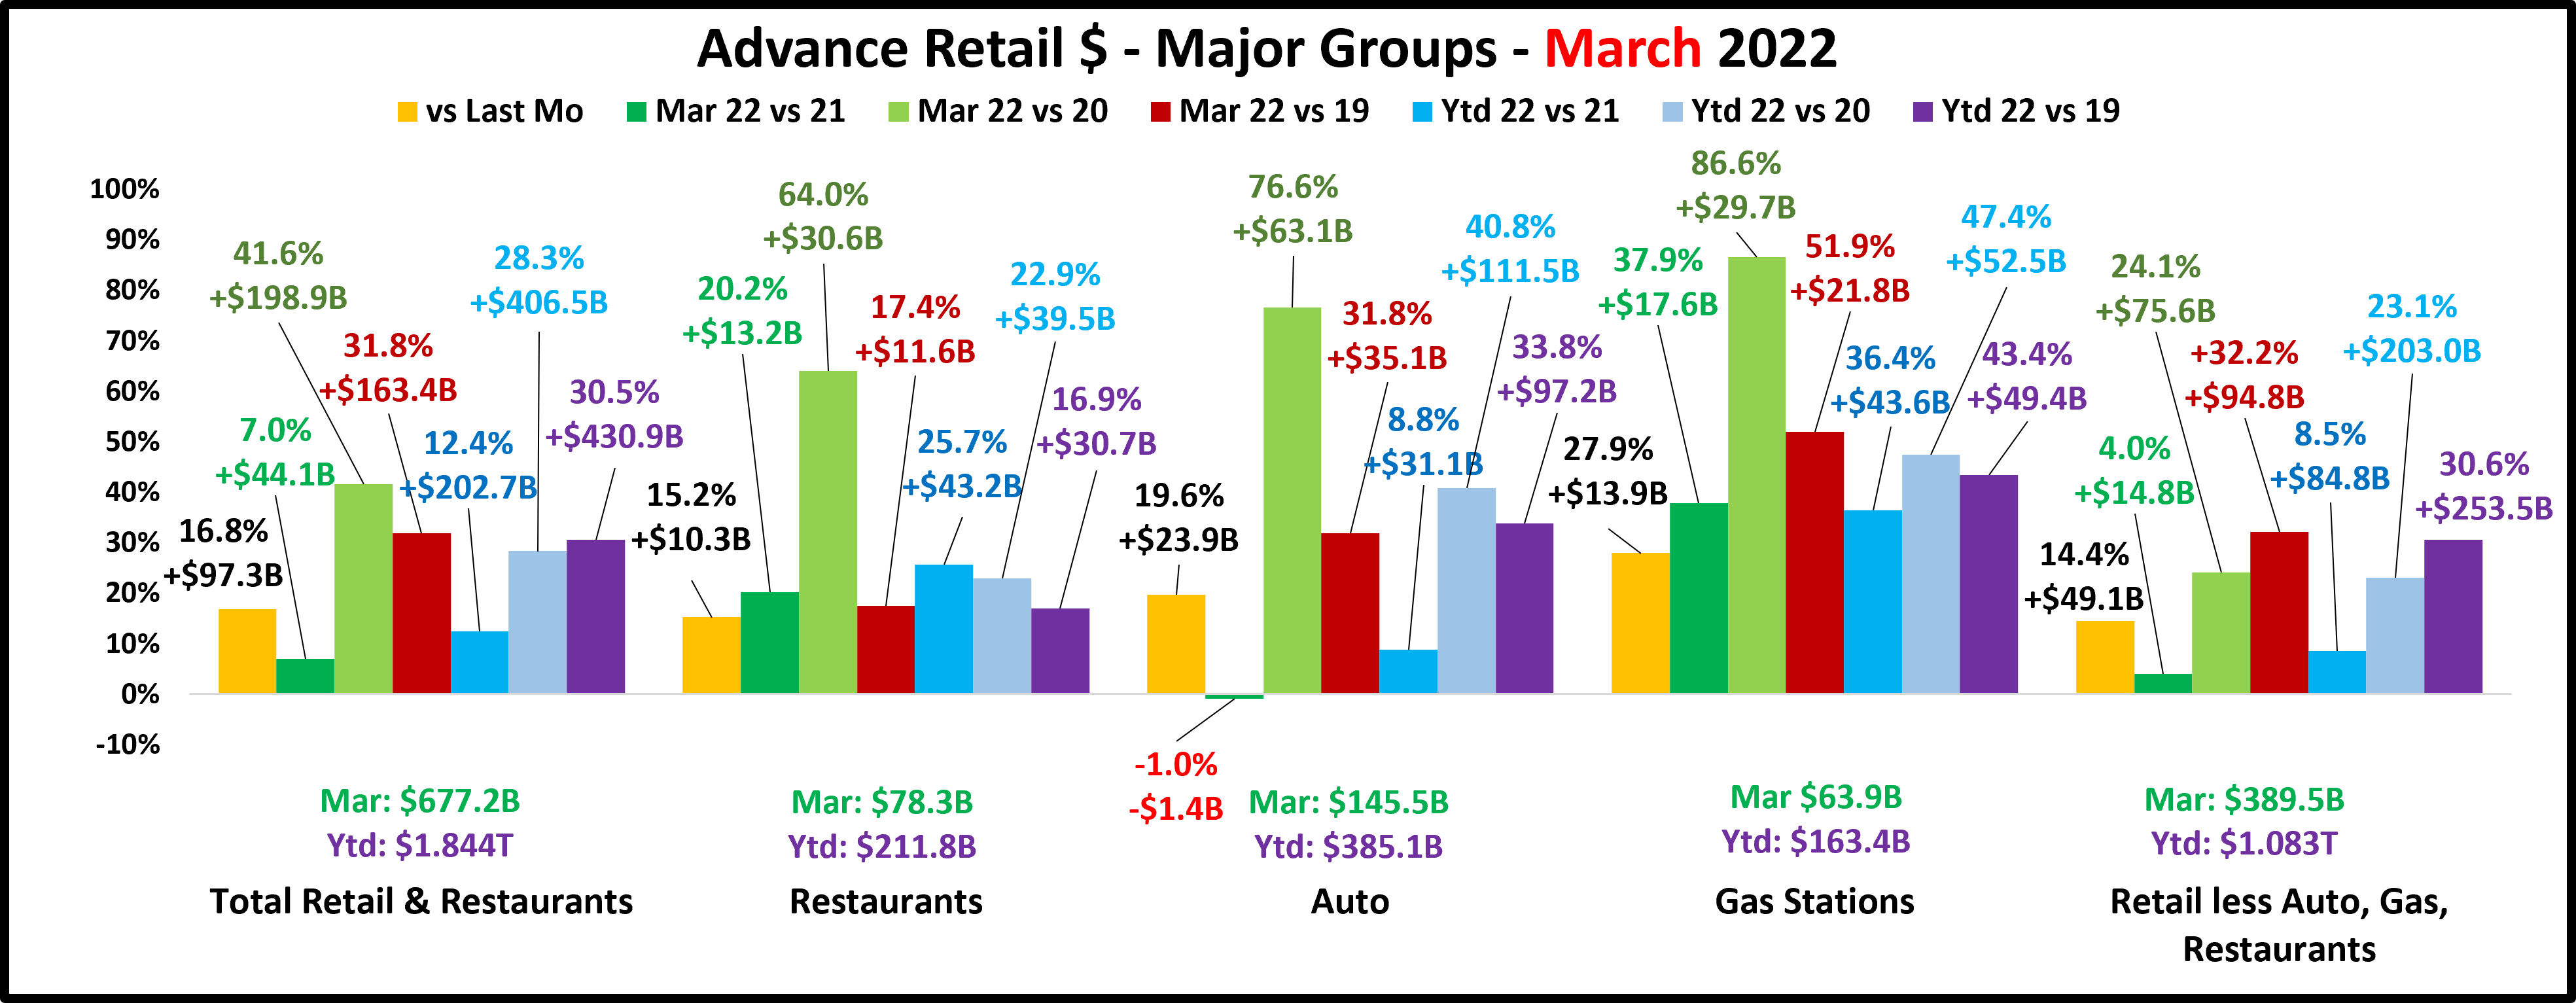
Overall – The big change is that the monthly increase vs the previous year is much smaller than it has been. The still recovering Restaurants and Gas Stations are up double digits but Auto $ are actually down. Also, March 2020 was the start of the pandemic. March 2022 set a new record for the month. We have come a long way since those tough days.
Total Retail – Every month in 2022 has set a monthly sales record. March $ are $677B. History says that they should stay at or near that level until dipping slightly in September. March sales are up 7.0% over 2021. That’s significantly below the 9.6% average increase since 2019. The national inflation rate for March 2022 vs 2021 was 8.5%, even higher than February. YTD prices are up 8.0%. Let’s take a closer look at the sales numbers. March: +7.0%, Real: -1.5%; YTD: +12.4%, Real: +4.0% (32.3%).The amount sold in March was actually down from 2021 and only about 1/3 of YTD sales gain was real.
Restaurants – They were hit hard by the pandemic and didn’t truly start to recover until March 2021 with a $15B lift over February and an $18B increase over 2020. Sales in 7 of the last 8 months of 2021 exceeded $70B and 2021 was the biggest year in history, $821B. January sales fell from December but have turned up since then setting a new all-time monthly record of $78.3B in March. March sales are up an average of 5.9% since 2019 and the YTD average is 5.4%. The channel is becoming more normal. Inflation for Food away from home in March was 6.9%. YTD, it is 6.7%. Here is the growth. March: +20.2%, Real: +13.3% (65.8%); YTD: +25.7%, Real: +19.0% (73.9%) This is by far the best real performance of any group and significantly improves the Total Retail numbers.
Auto (Motor Vehicle & Parts Dealers) – This group actively worked to overcome the stay-at-home attitude with great deals and a lot of advertising. They finished 2020 up 1% vs 2019 and hit a record $1.54T in 2021. In January, sales fell but then turned up in February & March. However, March $ are down vs 2021, the only negative on the chart and a huge change from their average March growth rate of 9.7% since 2019. Their YTD growth rate since 2019 is 10.2%, due to double digit increases in January & February. The inflation rates for new & used vehicles, which account for the vast majority of the sales in this group, were Mar: +21.7%, YTD: +22.8%. Sales were: Mar: -1.0%, Real: -22.7%; YTD: +8.8%, Real: -14.0%. It is very likely that the drop in the actual $ in March is tied to extreme inflation.
Gas Stations – Gas Stations were also hit hard. If you stay home, you drive less and obviously need less gas. This group started recovery in March 2021 and reached a record $588B for the year. Sales fell in January and February then turned up in March. However, they have the biggest monthly and YTD increases vs 2021. Gasoline inflation is in all the headlines so let’s get right to the numbers. Gasoline inflation vs 2021 for March is 48.0% and YTD is 42.3% which generates the following. March: +37.9%, Real: -10.1%; YTD: +36.4%, Real: -5.9%. It’s a textbook example of the initial impact of inflation. Consumers are spending more but buying less, especially with the huge price lift in March.
Relevant Retail – Less Auto, Gas and Restaurants – This the “core” of U.S. retail and accounts for 60+% of Total Retail Spending. There are a variety of channels in this group, so they took a number of different paths through the pandemic. However, their only down month was April 2020. They finished 2020, up +7.1% and 2021 got even better as they reached a record $4.47T. They have led the way in Total Retail’s recovery which became widespread across the channels. In January and February sales fell then turned up in March. All 3 months set new records but the March lift from 2021 is less than half of their 9.4% average. Their YTD numbers are better, only slightly below their 9.0% average. Now, we’ll look at the impact of inflation. We’ll use the overall inflation rates: March: 8.5%, YTD: 8.0%. Sales growth was: March: +4.0%, Real: -4.5%; YTD: +8.5%, Real: +0.5% (5.9%). With the huge size of this group, these results are critically important. This is where Retail America shops. YTD sales are truly up only a miniscule 0.5% but the amount of products that consumers bought in March was actually 4.5% less than 2021. They just paid more. That’s not good.
The impact of inflation is truly beginning to Hit home. Auto and Gas Stations have no monthly or YTD real growth. Relevant Retail is really down for the month and basically flat YTD. Restaurants have the only positive real numbers. This adds up to a real monthly drop for Total Retail and a minor YTD increase. We are now in Phase II of inflation. Consumer spending increases but the amount bought declines. The Auto Group may actually be moving into Phase III, when consumers actually cut back on spending. If inflation continues, the situation will only get worse.
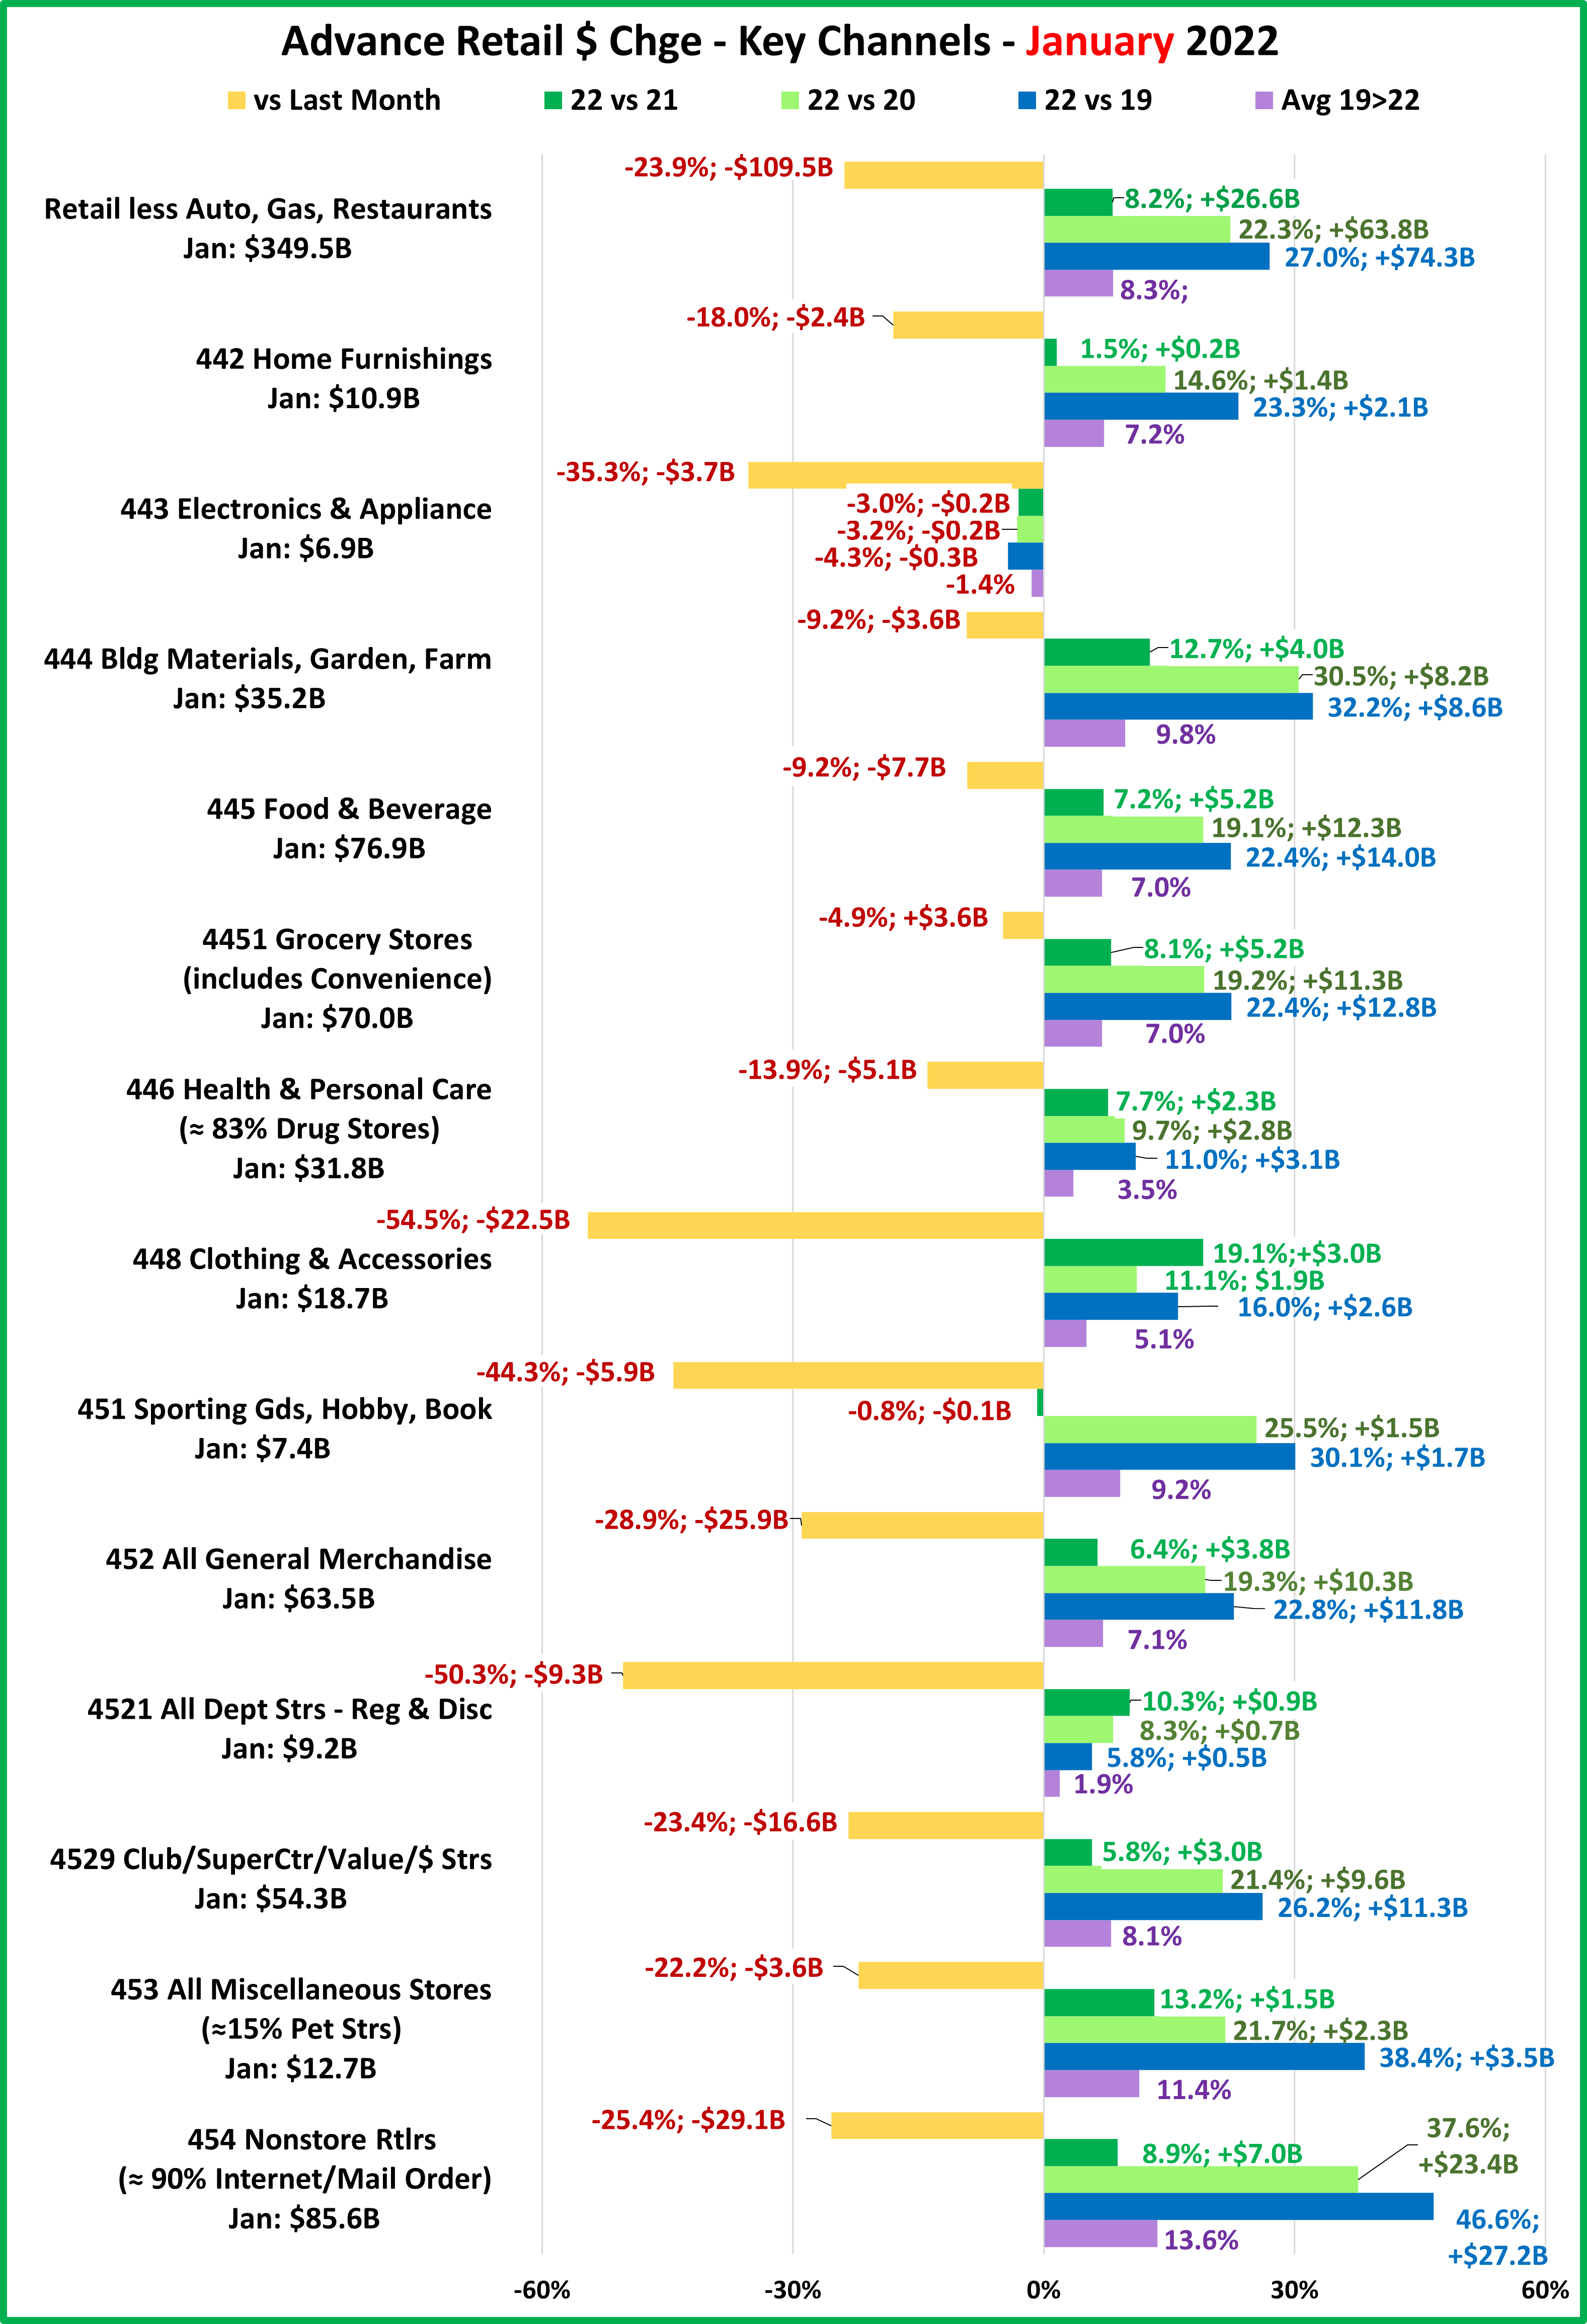
Now the March numbers for some key retail channels.
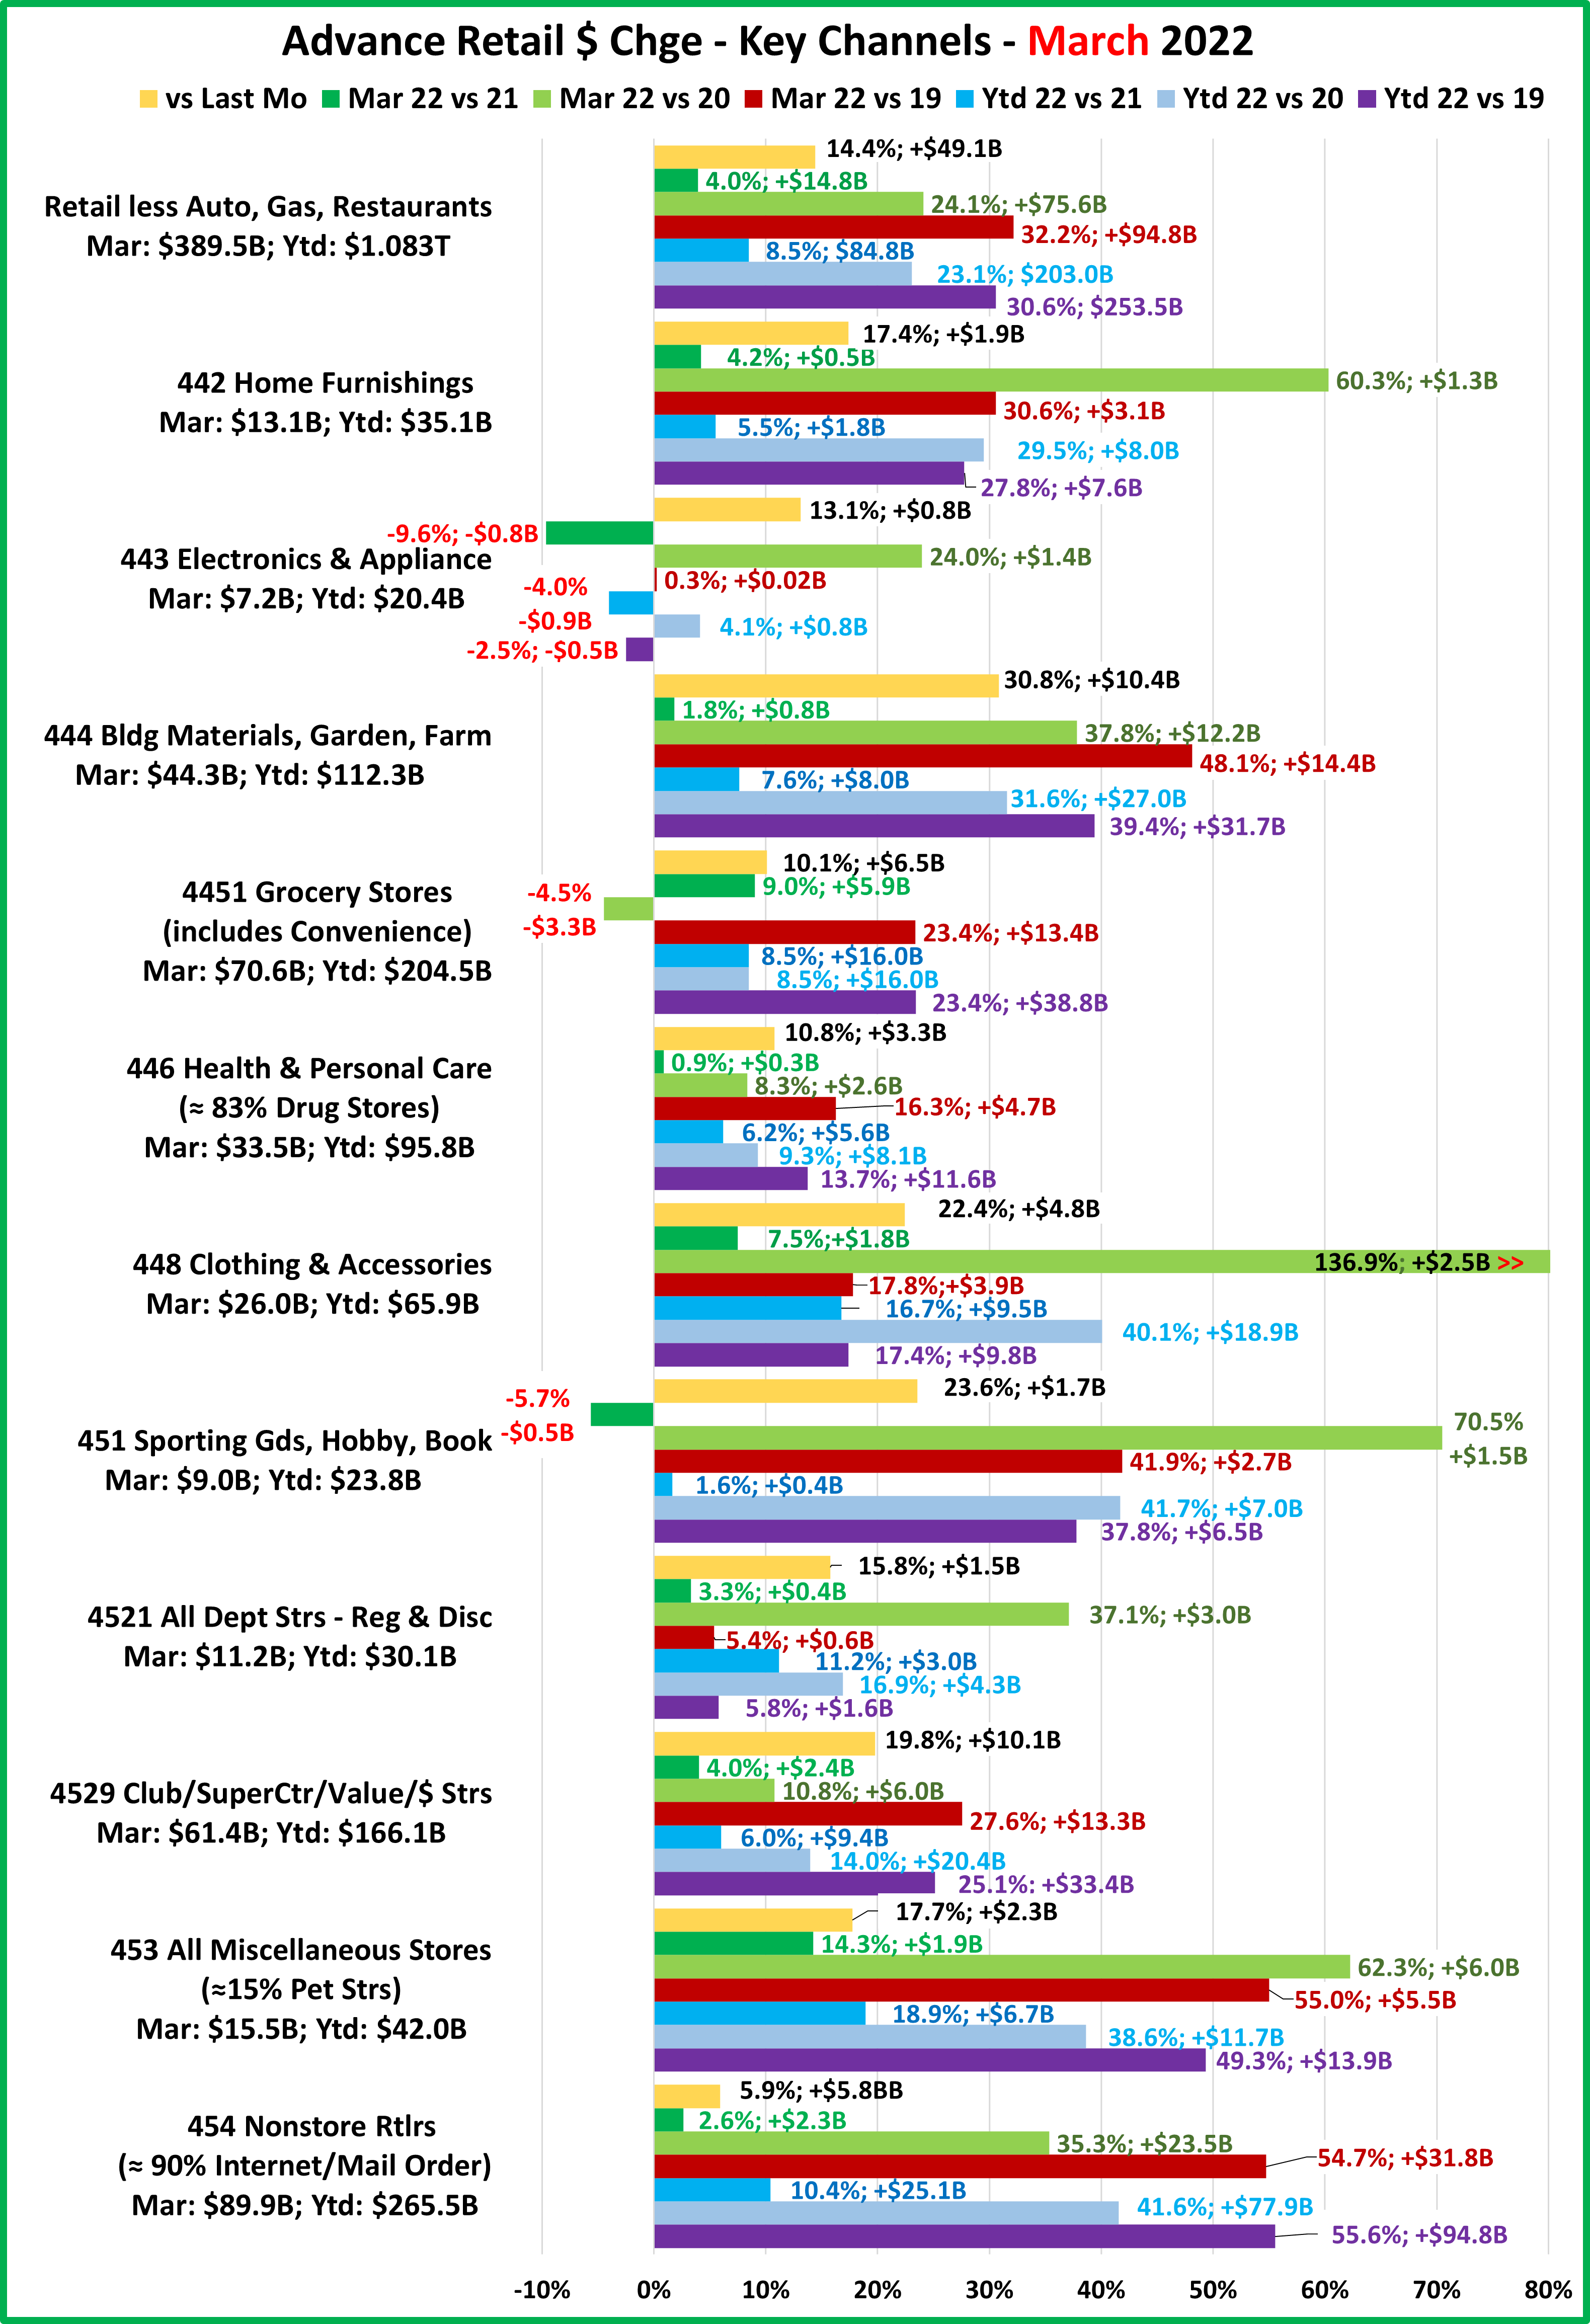
- Relevant Retail: Mar: +4.0%, Real: -4.5%; YTD: +8.5%, Real: +0.5%. All channels were up vs the February “bottom” but 2 were down vs March 2021. It was a record month but you see the negative impact of inflation in the “real” numbers.
- All Dept Stores – This group was struggling before COVID, and the pandemic hit them hard. They began to recover in March 2020, and they have continued to grow through March 2022. The most appropriate inflation rate to use for them is less Food, Energy, Shelter & used vehicles which are Mar: 5.8%, YTD: 5.5%. Their numbers are Mar: +3.3%, Real: -2.5%; YTD: +11.2%, Real: +5.7%. Their growth slowed in March and in “real” terms they actually lost ground due to inflation.
- Club/SuprCtr/$ – They fueled a big part of the overall recovery because they focus on value which has broad consumer appeal. Inflation is a big factor in their current numbers as their lift has turned around, at least temporarily. Using the national CPI, Mar: +4.0%, Real: -4.5%, YTD: +6.0%, Real: -2.0%
- Grocery – These stores are essential and depend on frequent purchases, so except for the binge buying in 2020, their changes are generally less pronounced. However, inflation has also hit Groceries, 10.0% in March and 8.7% YTD, the biggest increase since 1981 and produced negative real numbers Mar: +9.0%, Real = -1.0%; YTD: 8.5%, Real: -0.2%
- Health/Drug Stores – At least the drug stores in this group are essential, but consumers visit far less frequently than Grocery stores. Most of their COVID ride has been rather calm. Using the CPI for Rx & OTC drugs: Mar: 2.7%, YTD: 2.2% their sales are: Mar: +0.9%, Real: -1.8%; YTD: +6.2%, Real: +4.0% Even with lower inflation, their real sales were down.
- Clothing and Accessories – They were generally deemed nonessential and what you were wearing didn’t matter when you stayed home. That changed in March 2021 and consumers’ pent-up needs caused explosive growth which has continued through 2022. Apparel inflation is Mar: 6.8%, YTD: 6.2%. Their $ are Mar: 7.5%, Real: 0.7%; YTD: 16.7%, Real: 10.5%
- Home Furnishings – They were also less impacted by COVID. Sales dipped Mar>May in 2020. Then as consumers’ focus turned to their homes, furniture became a priority. Inflation on Furniture is extremely high, 15.8% for March and 16.6% YTD. That causes a big turnaround in their numbers. Mar: +4.2%, Real: -11.6%; YTD: +5.5%, Real: -11.1%
- Electronic & Appliances – Look at the graph. This channel has problems beyond the pandemic. Sales fell in Apr>May of 2020 and didn’t reach 2019 levels until March 2021. Their sales are down across the board vs 2021. We’ll use the “limited” CPI: Mar: 5.8%, YTD: 5.5%. Sales: Mar: -9.6%, Real: -15.4%; YTD: -4.0%, Real: -9.5%.
- Building Material, Farm & Garden & Hardware –They truly benefited from the consumers’ focus on home. Their spring lift became almost year-round. A big lift from February but little vs 2021. The CPI for Hdwe & Outdoor is Mar: 10.8% YTD: 10.7%. Here are their sales: Mar: +1.8%, Real: -9.0%; YTD: +7.6%, Real: -3.1%. An Inflation generated drop.
- Sporting Goods, Hobby and Book Stores – Consumers turned their attention to personal recreation and sales in Sporting Goods outlets took off. Book and Hobby Stores recovery was slower. A big increase from February but March Sales are down vs 2021. The product groups in these outlets have radically different CPIs so using the “limited” inflation version seems to be the best choice. Mar: -5.7%, Real: -11.5%; YTD: 1.6%, Real: -3.9%. Inflation again hits hard.
- All Miscellaneous Stores – Pet Stores have been a key part of the strong and still growing recovery of this group. They finished 2020 +0.9% but sales took off in March 21, setting a new monthly record in December. The growth continues in 2022 as they are now #1 in March & YTD lifts. Since 2019, their March growth is #1 and YTD is 2nd to NonStore. The limited CPI seems right for them and generates strong numbers. Mar: +14.3%, Real: +8.5%; YTD: +18.9%, Real: +13.4%
- NonStore Retailers – 90% of their volume comes from Internet/Mail Order/TV. The pandemic accelerated the online spending movement. They ended 2020 +21.4%. The growth continued in 2021 and in December monthly sales exceeded $100B for the 1st time and they broke the $1 Trillion barrier. Growth slowed markedly in March 2022. Using the national CPI, their sales are Mar: +2.6%, Real: -5.9%; YTD: +10.4%, Real: +2.4% Even the internet is not safe from inflation.
Note: Almost without exception, online sales by brick ‘n mortar retailers are recorded with their regular store sales.
Recap – The Retail recovery from the pandemic was largely driven by Relevant Retail. While the timing varied between channels, by the end of 2021 it had become very widespread. In late 2021 and now in 2022, a new challenge came to the forefront – extreme inflation. It isn’t the worst in history, but it is the biggest increase in prices in 40 years. Moreover, each month it is getting worse. On the surface, the impact is almost invisible. Sales in the total market and in the Relevant Retail group continue to grow. Admittedly, the growth rate has slowed in March, but sales are still up. In our summary of the big groups, we said that the market had entered phase II of strong inflation – spending grows but the amount purchased falls. The channels in the graph above illustrate this perfectly and show how widespread that it has become. 9 of 11 channels are up vs March 2021 and 10 are up YTD. However, when you factor in inflation, only 2 are up for March and 5 for YTD. Inflation is real and there are real and even worse consequences if it continues.