Retail Channel Monthly $ Update – March Final & April Advance
It has been a full year since the Retail market bottomed out in April 2020, so this month’s retail update is particularly significant. Consumer spending behavior continues to evolve. In this report we will track the changes, migration between channels and the retail recovery with data from two reports provided by the U.S. Census Bureau.
The Reports are the Monthly Retail Sales Report and the Advance Retail Sales Report. Both are derived from sales data gathered from retailers across the U.S. and are published monthly at the same time. The Advance Report has a smaller sample size so it can be published quickly – about 2 weeks after month end. The Monthly Final Report includes data from all respondents, so it takes longer to compile the data – about 6 weeks. Although the sample size for the Advance report is smaller, the results over the years have proven it to be statistically accurate with the final monthly reports. The biggest difference is that the full sample in the Final report allows us to “drill” a little deeper into the retail channels.
We will begin with the Final Retail Report for March and then move to the Advance Retail Report for April. Remember, the maximum retail impact of the pandemic occurred in April 2020, but it began in March. We will compare 2021 to both 2020 and 2019 to document the progress that the retail market has made towards a full recovery.
Both reports include the following:
- Total Retail, Restaurants, Auto, Gas Stations and Relevant Retail (removing Restaurants, Auto and Gas)
- Individual Channel Data – This will be more detailed in the “Final” reports and we fill focus on Pet Relevant Channels
The information will be presented in detailed charts to facilitate visual comparison between groups/channels of:
- Current Month change – % & $ vs previous month
- Current Month change – % & $ vs same month in 2020 and 2019
- Current YTD change – % & $ vs 2020 and 2019
- Monthly and Year To Date $ will also be shown for each group/channel
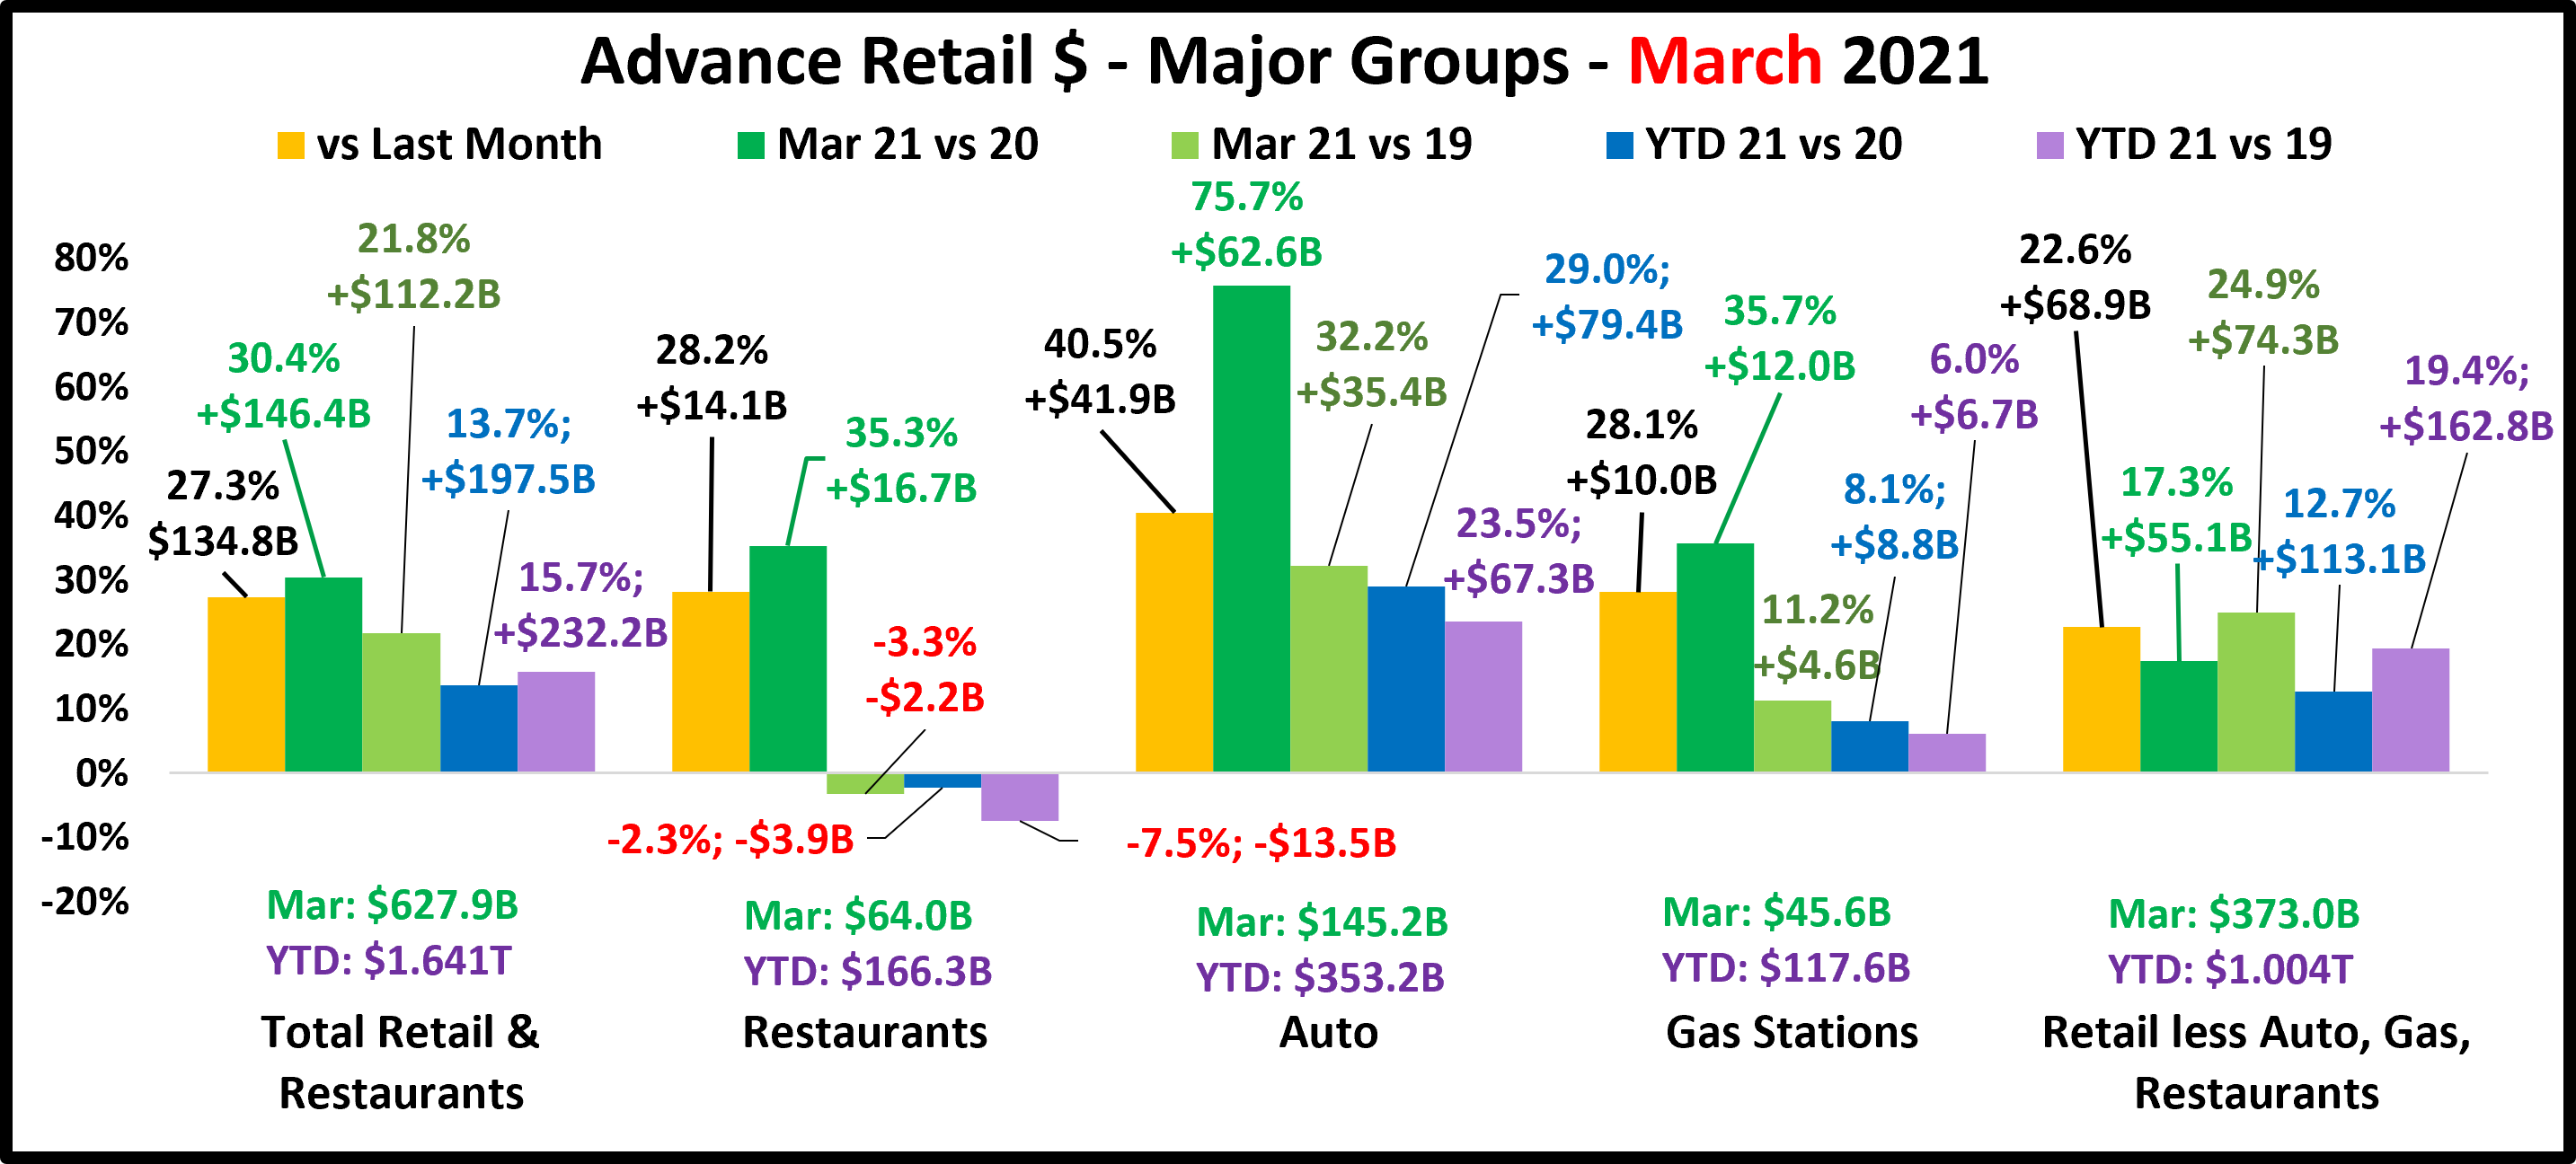
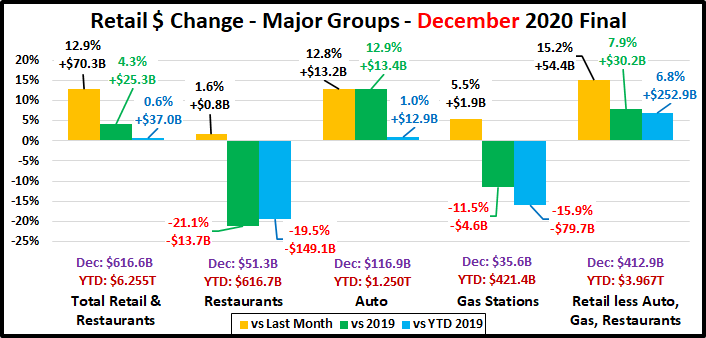
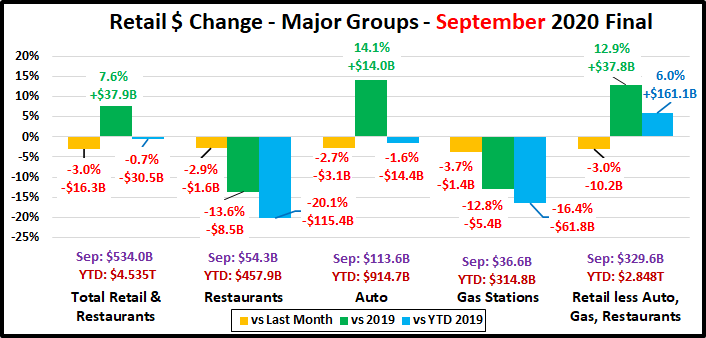
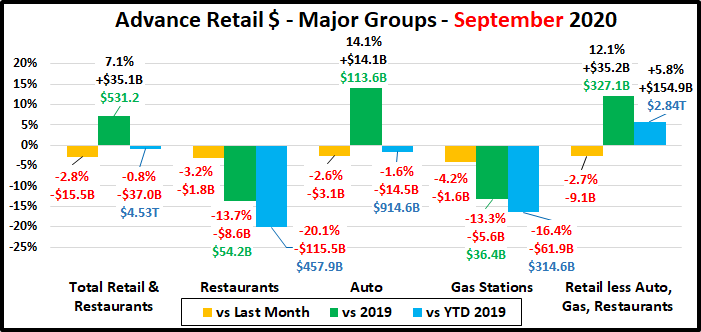
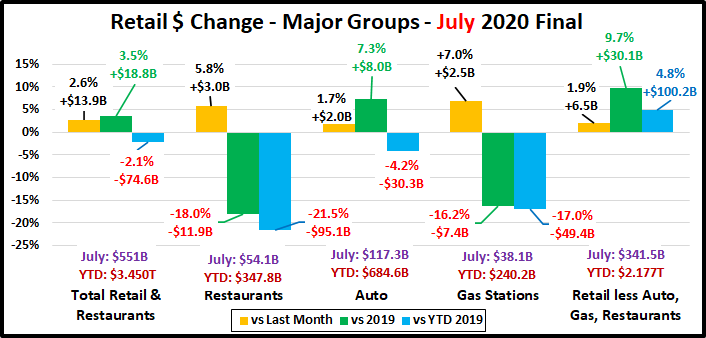
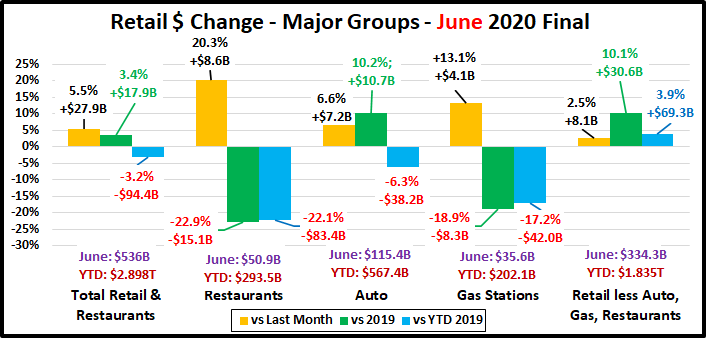
First, the March Final. Retail hit bottom in April but began recovery, hitting record $ in December. In January & February $ fell but were still records for those months. Sales skyrocketed in March, beating December for a new all time $ record. Here are the major retail groups. (All Data is Actual, Not Seasonally Adjusted)
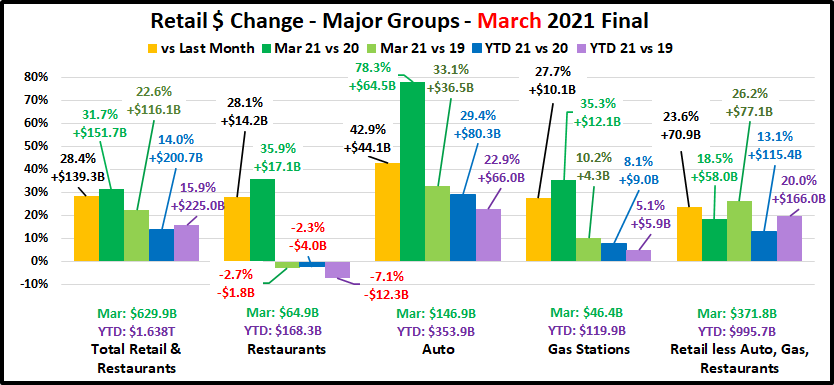
The final total is $2.0B more than the Advance report projected a month ago. All Groups but Relevant Retail were up. The specifics were: Auto: +$1.7B; Restaurants: +$0.9B; Gas Stations: +$0.8B; Relevant Retail: -$1.2B. All groups were up vs February and Total Retail set a new monthly record of $629.9B. Total $ales broke $600B for the first time in December and set individual monthly records in both January and February thanks to strong performances by Relevant Retail and Auto. In March, all groups contributed to the new monthly record and all, but Restaurants were positive in all measurements. Restaurants are still slightly negative vs 2019 and YTD but overall, Retail is strongly recovering.
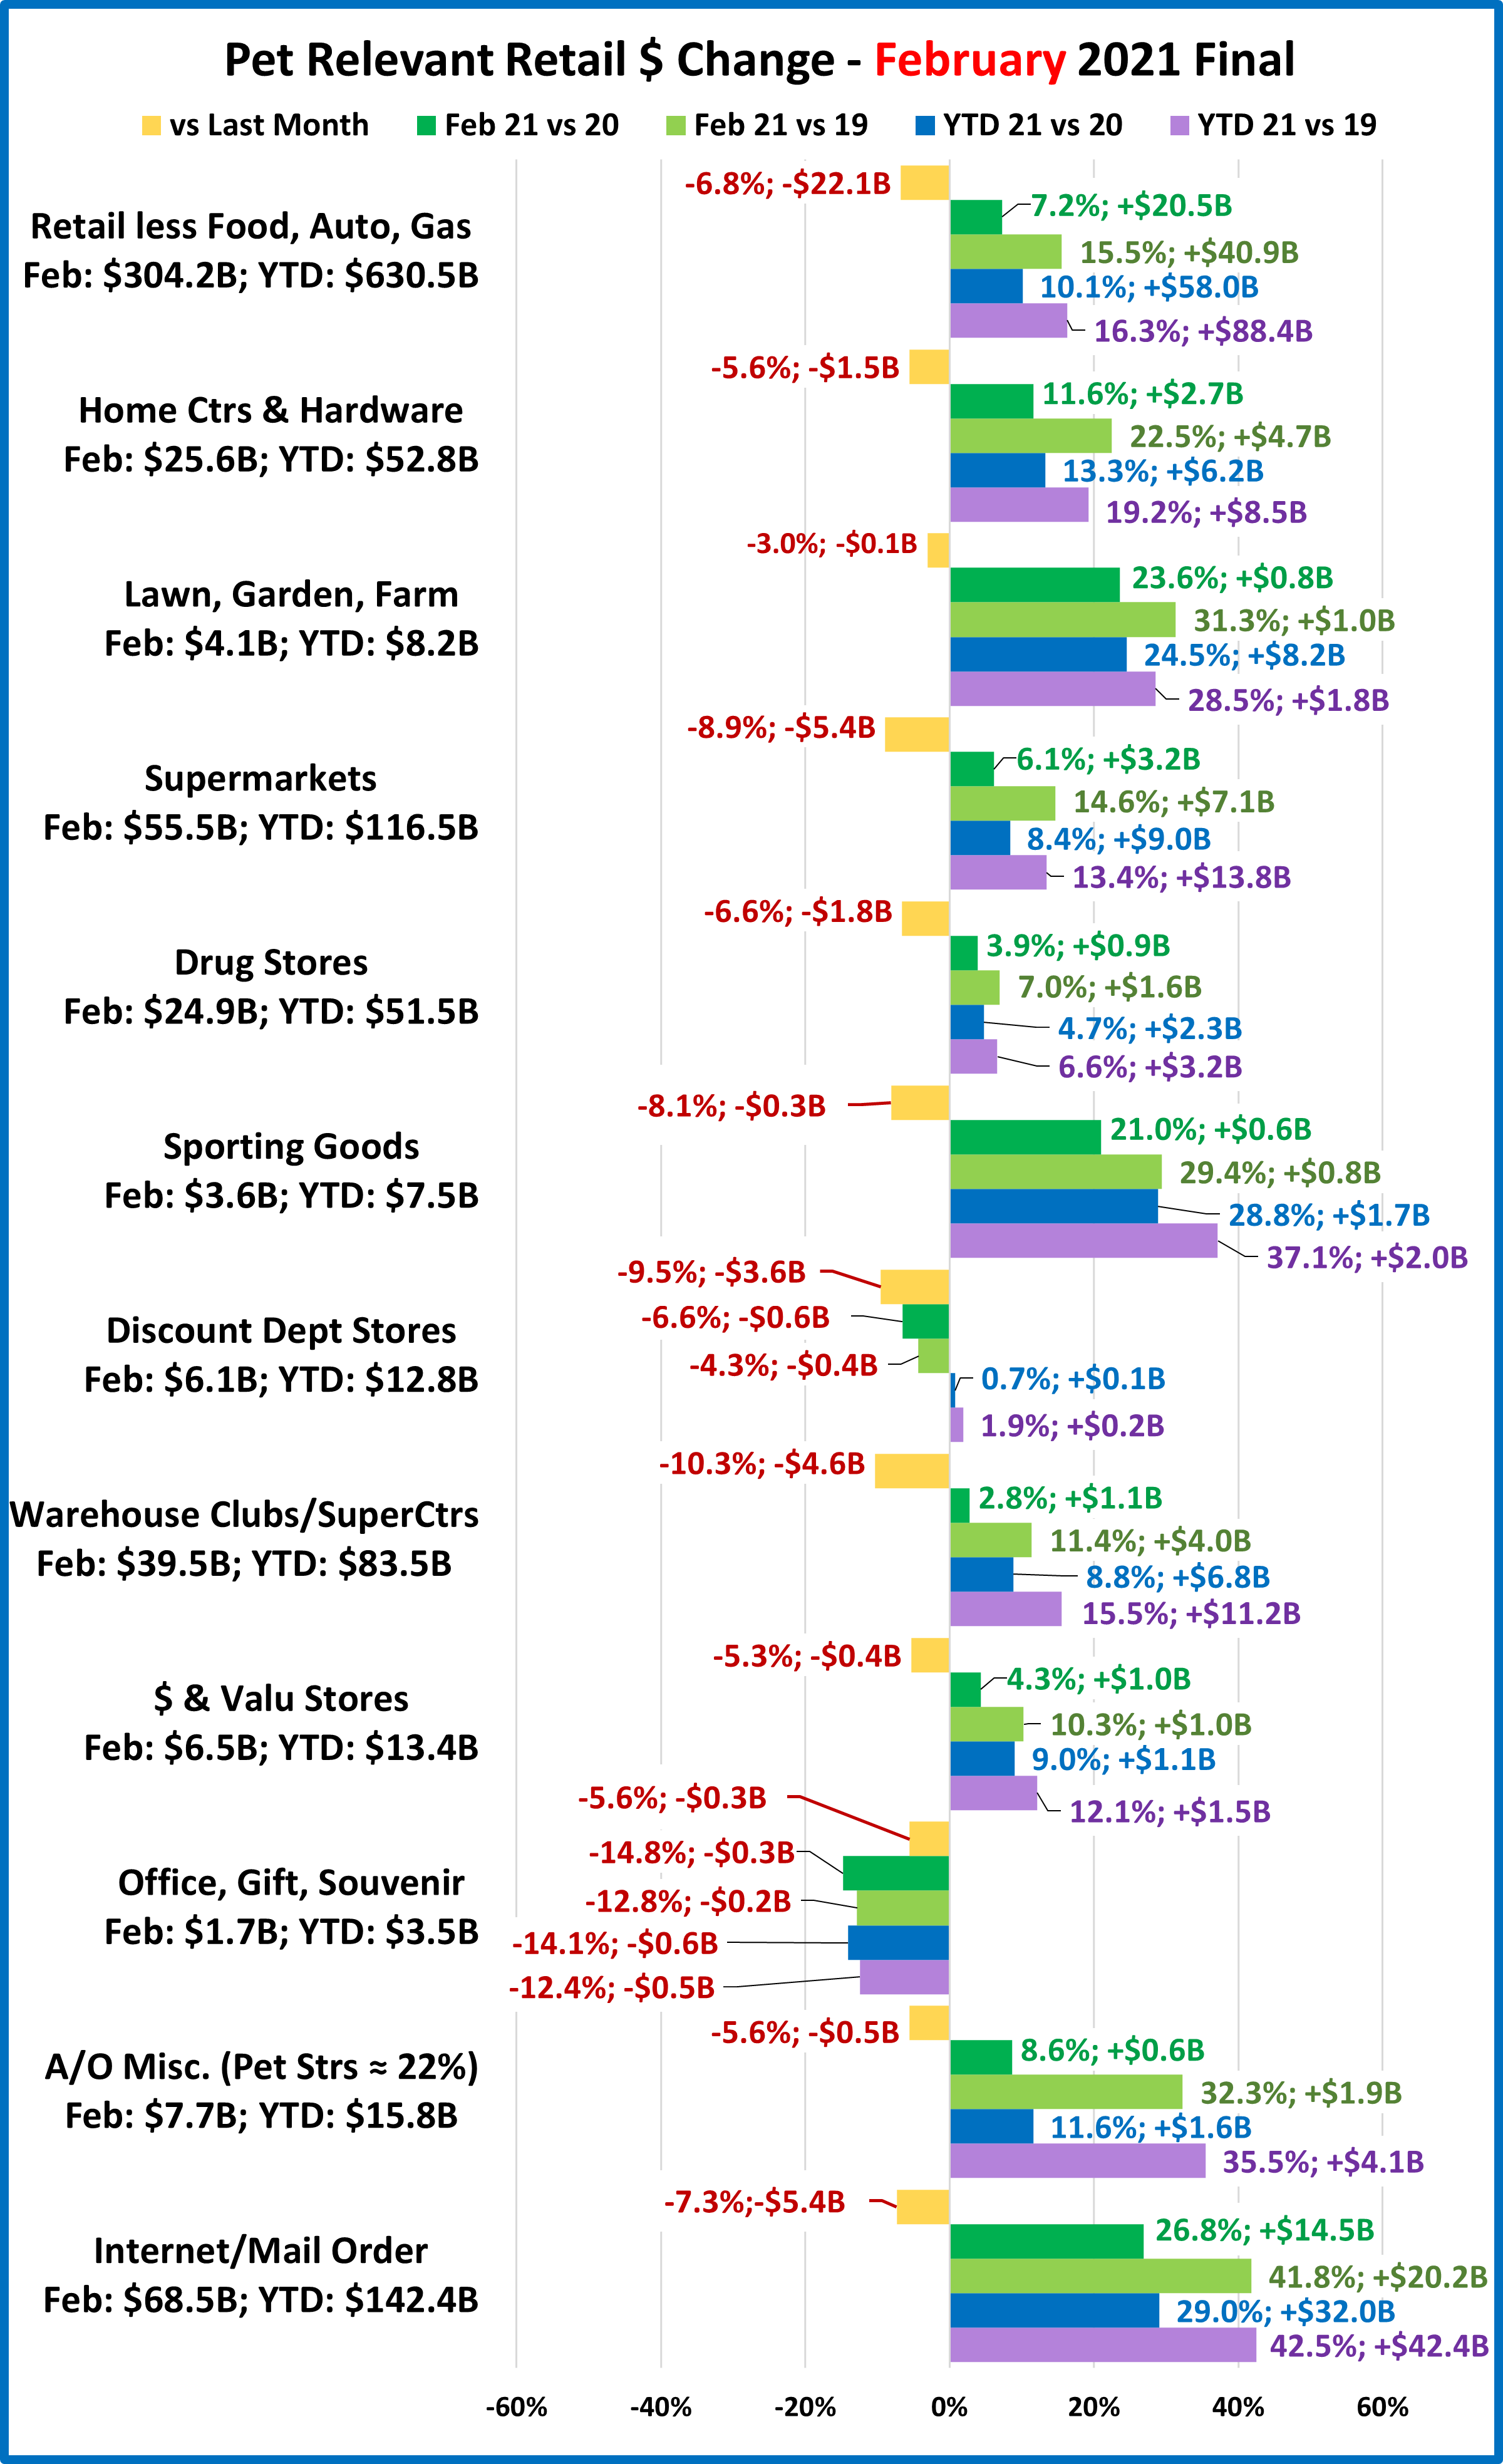
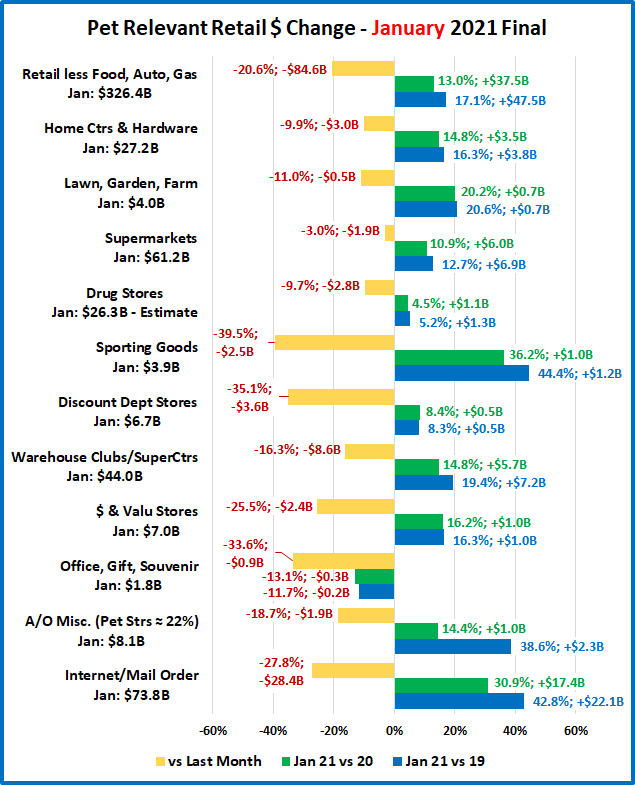
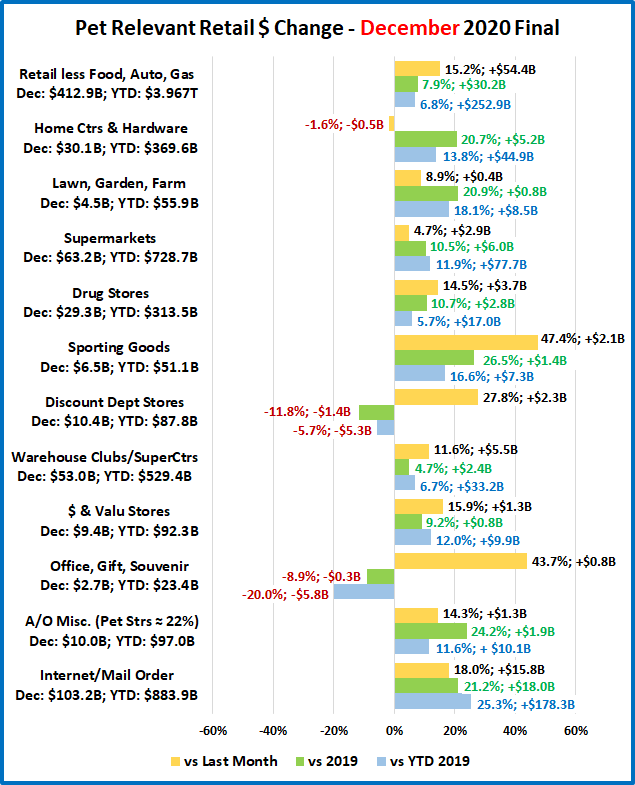
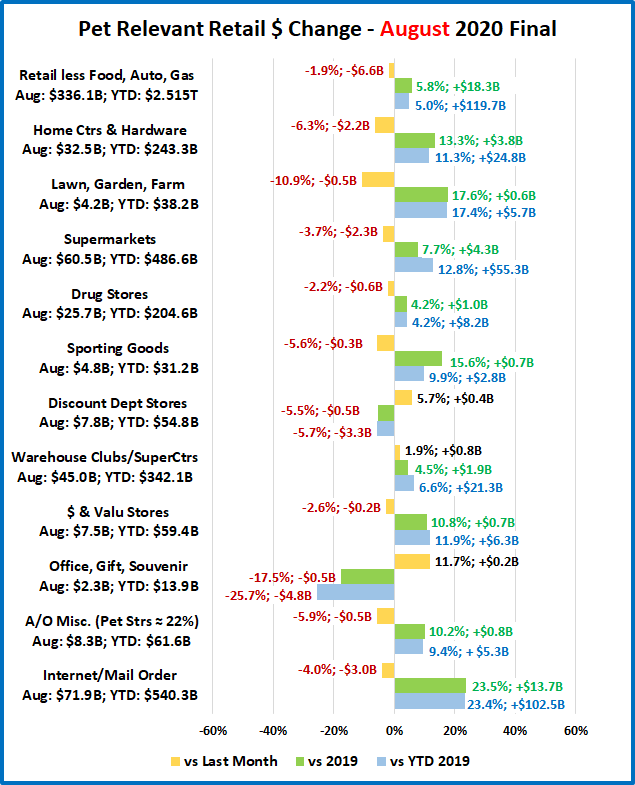
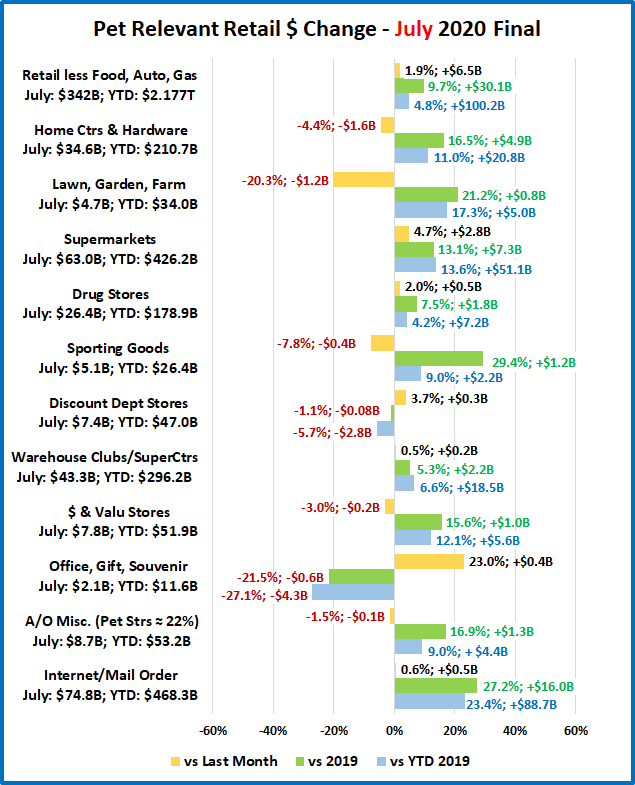
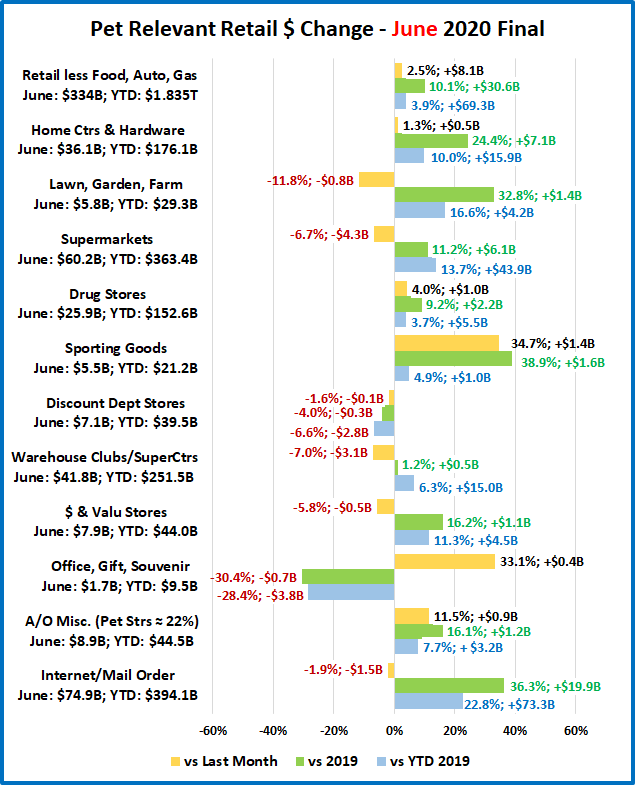
Now, let’s see how some Key Pet Relevant channels were doing in March.

- Overall– All 11 channels were up vs February and 10 of 11 were up vs March 2020 and March 2019. In YTD $, 10 were up vs 2020 and 9 vs 2019. March was a strong month, both overall and in the details.
- Building Material Stores – Their amazing lift continues. The ongoing surge came as a result of pandemic spending patterns developed in 2020. Consumers began focusing on their homes. They’re still showing 20+% increases, with Farm Stores leading the way with 30+% increases in all measurements. Sporting Goods stores are not in this group but have a similar spending pattern. Sales took off in May, hit a record peak in December and continued strong into 2021, spiking in March. Compared to 2019, they are +67.6% vs March and +51.6% YTD
- Food & Drug – Supermarkets finished 2020 up +$77.7B. Sales are up vs February but down vs the March 2020 binge. They are up YTD vs 2019 but about even with 2020. Drug Stores ended up +$17B (+5.7%) for 2020. Their $ fell in January and February but March $ set a new record. All measurements are positive and YTD $ are +3.0%.
- General Merchandise Stores – $ in all channels had been falling from their December peak but sales in March grew 25% from February. Discount Department Store were having problems even before the pandemic, but they led the way in the March lift, +34.9% vs February. Clubs/SuperCtrs and $ Stores remain strong. These channels promote value. Their success in all measurements reinforces its importance in Consumer spending decisions.
- Office, Gift & Souvenir Stores– March brought a big $ lift…finally. They were hard hit by the pandemic and still have negative numbers vs 2019 – monthly and YTD. Recovery is still a long way off but might be on the horizon.
- Internet/Mail Order – The pandemic has accelerated this channel’s growth. Last March they were up 12.5% YTD vs 2019. This year they are up 46.6%. The pandemic lift spending pattern basically doubled the rate of increase.
- A/O Miscellaneous – This is a group of small to midsized specialty retailers – chains and independents. It includes Florists, Art Stores and Pet Stores (22>24% of total $). Pet Stores were usually essential, but most stores were not. Stores began reopening in May and the $ grew. Their 2020 total sales were up +11.6%. March YTD sales are +$4.8B (+23.2%) vs 2020 and +$7.6B (+42.8%) vs 2019. Recovery is here and with continuing growth!
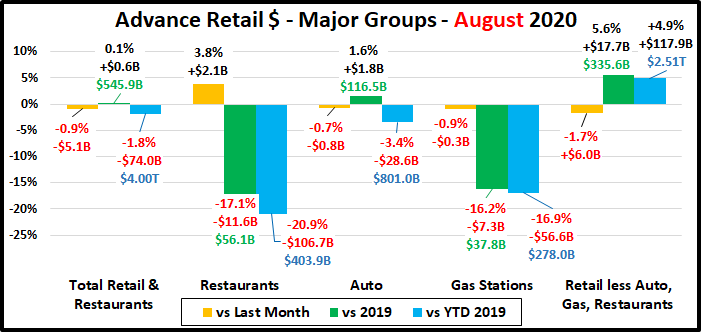
The Relevant Retail Segment began recovery in May, reached a record level in December, then $ fell in January & February. March set a new monthly record and virtually all members of this group are showing growth. Currently the key drivers are the Internet, SuperCtrs/Clubs/$ Stores and Hdwe/Farm. Now, here are the Advance numbers for April.
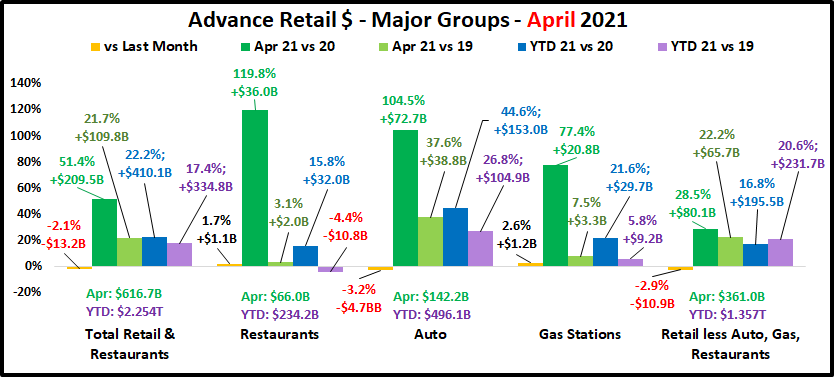
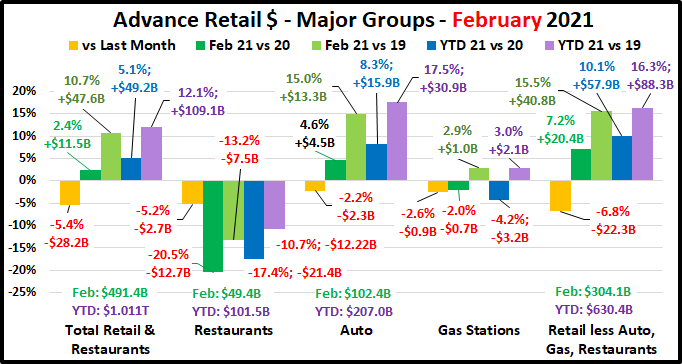
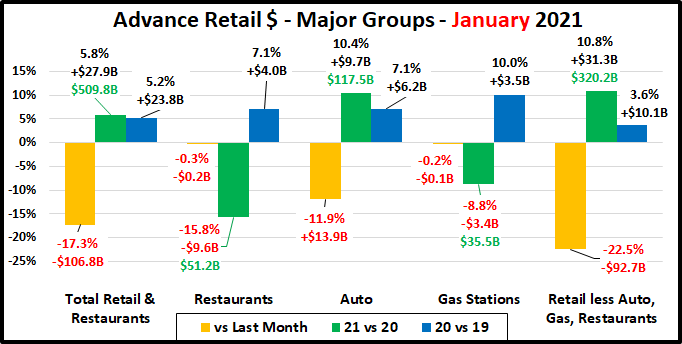
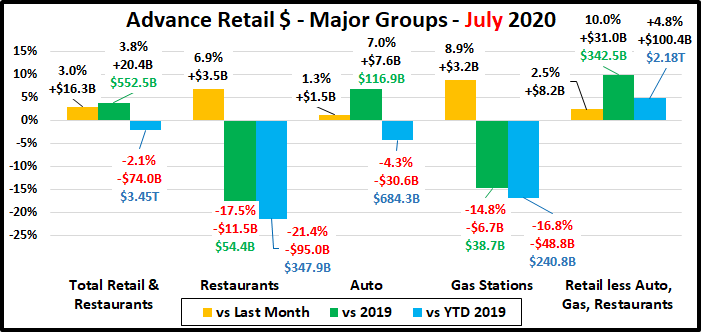
2020 will always be a memorable year for both its traumas and triumphs. In April & May we experienced the 2 biggest retail spending drops in history, but the problems actually began in March. Sales increased slightly from February but were $34.1B less than March 2019. Retail sales began to recover in June and in October, YTD Total Retail turned positive for the 1st time since February. In December, Total Retail broke the $600B barrier – a historic first. While sales fell from their December peak, monthly sales records were set in both January and February. Then they took off again in March, breaking $600B again while setting a new monthly sales record of $627.9B. April sales were down slightly but were the second highest in history. April Sales from all the major groups were close to March $. YTD Restaurant $ were down slightly from 2019. This is the only negative vs 2020 or 2019 for any group. In April of 2020 Retail sales fell $100B from 2019, the biggest monthly year over year drop in history. In March 2021 sales were up $152B over 2020. In April, the increase over 2020 was $209B. Certain retail segments and other areas of the economy are still suffering, and spending habits have changed but the overall Retail marketplace has recovered and is stronger than ever.
Total Retail – In March, Total Retail set a record for the most spending in any month in any year. In April, $ales dipped by -$13.2B (-2.1%) to $616.7B but were still $209.5B (51.4%) more than April 2020 – a new record increase, double the size of last year’s record drop. If you compare the YTD 2021 spending to 2019, you see an increase of $334.8B (+17.4%). That is an average annual spending increase of 8.4%. If you just looked at these strong topline growth numbers, you would not suspect that a retail spending crisis had ever happened. Always look below the surface.
Restaurants – This is the only big group with any negative measurements. Last February YTD sales were up 8.1% vs 2019. The Pandemic changed that. Restaurants started to close or cease in person dining in March and sales fell -$33.3B (-52.5%) compared to March 2019. Sales bottomed out in April at $30.1, the lowest April sales since 2003. Sales started to slowly increase in May but never reached a level higher than 88% compared to the previous year. 2021 started off slowly. Through February, YTD sales were down -16.7% from pre-pandemic 2020 and -10.0% from 2019. In March sales took off. They grew slightly in April but were more than double April 2020 and even ahead of 2019. YTD their $ are ahead of 2020 but still $10.8B (-4.4%) behind 2019. They are not “there yet” but their recovery is strengthening.
Auto (Motor Vehicle & Parts Dealers) – Staying home causes your car to be less of a focus in your life. Sales began to fall in March 2020 and hit bottom in April. Auto Dealers began combating this “stay at home” attitude with fantastic deals and a lot of advertising. It worked. They finished 2020 up 1% vs 2019 and have returned to a strong positive pattern in 2021. The “attitude” grew amazingly positive in March and slowed only slightly in April as sales exceeded $142B in both months, by far the 2 biggest months in history. To show how well consumers responded to their campaign you just need to look at the data. This group has exceeded $110B in monthly sales only 10 times in history. 8 of those occurred after the onset of the pandemic. YTD Avg Growth Since 2019 = +12.6% – the best performance of any big group.
Gas Stations – Gas Station $ales have been a mixed bag. If you drive less, you visit the gas station less often. Sales turned down in March 2020 and reached their low point in April. They moved up but generally stayed about 15% below 2019 levels for the rest of 2020. In February they were still behind 2020 in monthly and YTD $ but ahead of 2019 in both measurements. In March, sales skyrocketed. They increased only slightly in April but were 77.4% above the April 2020 “bottom”. They have been positive in all measurements vs both 2019 and 2020 since March. Their comeback continues but there is another factor that must be considered – inflation. Gas prices can be pretty volatile. They dipped in the first 2 months of the pandemic but then returned to more normal levels for the balance of 2020. They began strongly inflating in 2021, peaking in April. The April 2021 prices were 49.6% above April 2020. That means that 64% of the 77.4% year over year lift came from just higher prices. Analyzing retail can be complicated. YTD Avg Growth = +2.9%
Relevant Retail – Less Auto, Gas and Restaurants – This is what we consider the “core” of U.S. retail and has traditionally accounted for about 60% of Total Retail Spending. When you look at the individual channels in this group, you see a variety of results due to many factors – non-essential closures, binge buying, online shopping and a consumer focus on “home”. However, overall, April 2020 was the only month in which spending in this group was down vs 2019. Monthly $ales exceeded $400B for the first time ever in December ($407B). They finished 2020 up $260B, +7.1%. Their performance was the only reason that Total Retail was able to finish 2020 with positive numbers, +0.5%. Sales fell in January and February but continued to set monthly records. In March they turned sharply up again but dipped slightly in April. Currently, they are up $80.1B, +28.5% vs April 2020 and +$195.5B, +16.8% YTD. We should note that March ($371.8B) and April ($361.0B) spending were the third and fourth highest monthly totals of all time, trailing only December 2020 and December 2019. We should also note that the Relevant Retail group has posted positive numbers versus last year and YTD for every month since April 2020 and their average YTD growth rate since 2019 now stands at +9.8%. Through April virtually all channels have now turned positive vs 2020 and 2019. However, the primary drivers throughout the pandemic were and continue to be Nonstore, Grocery, SuperCenters/Clubs/$ Stores plus a never ending “spring lift” from Hardware/Farm and Sporting Goods.
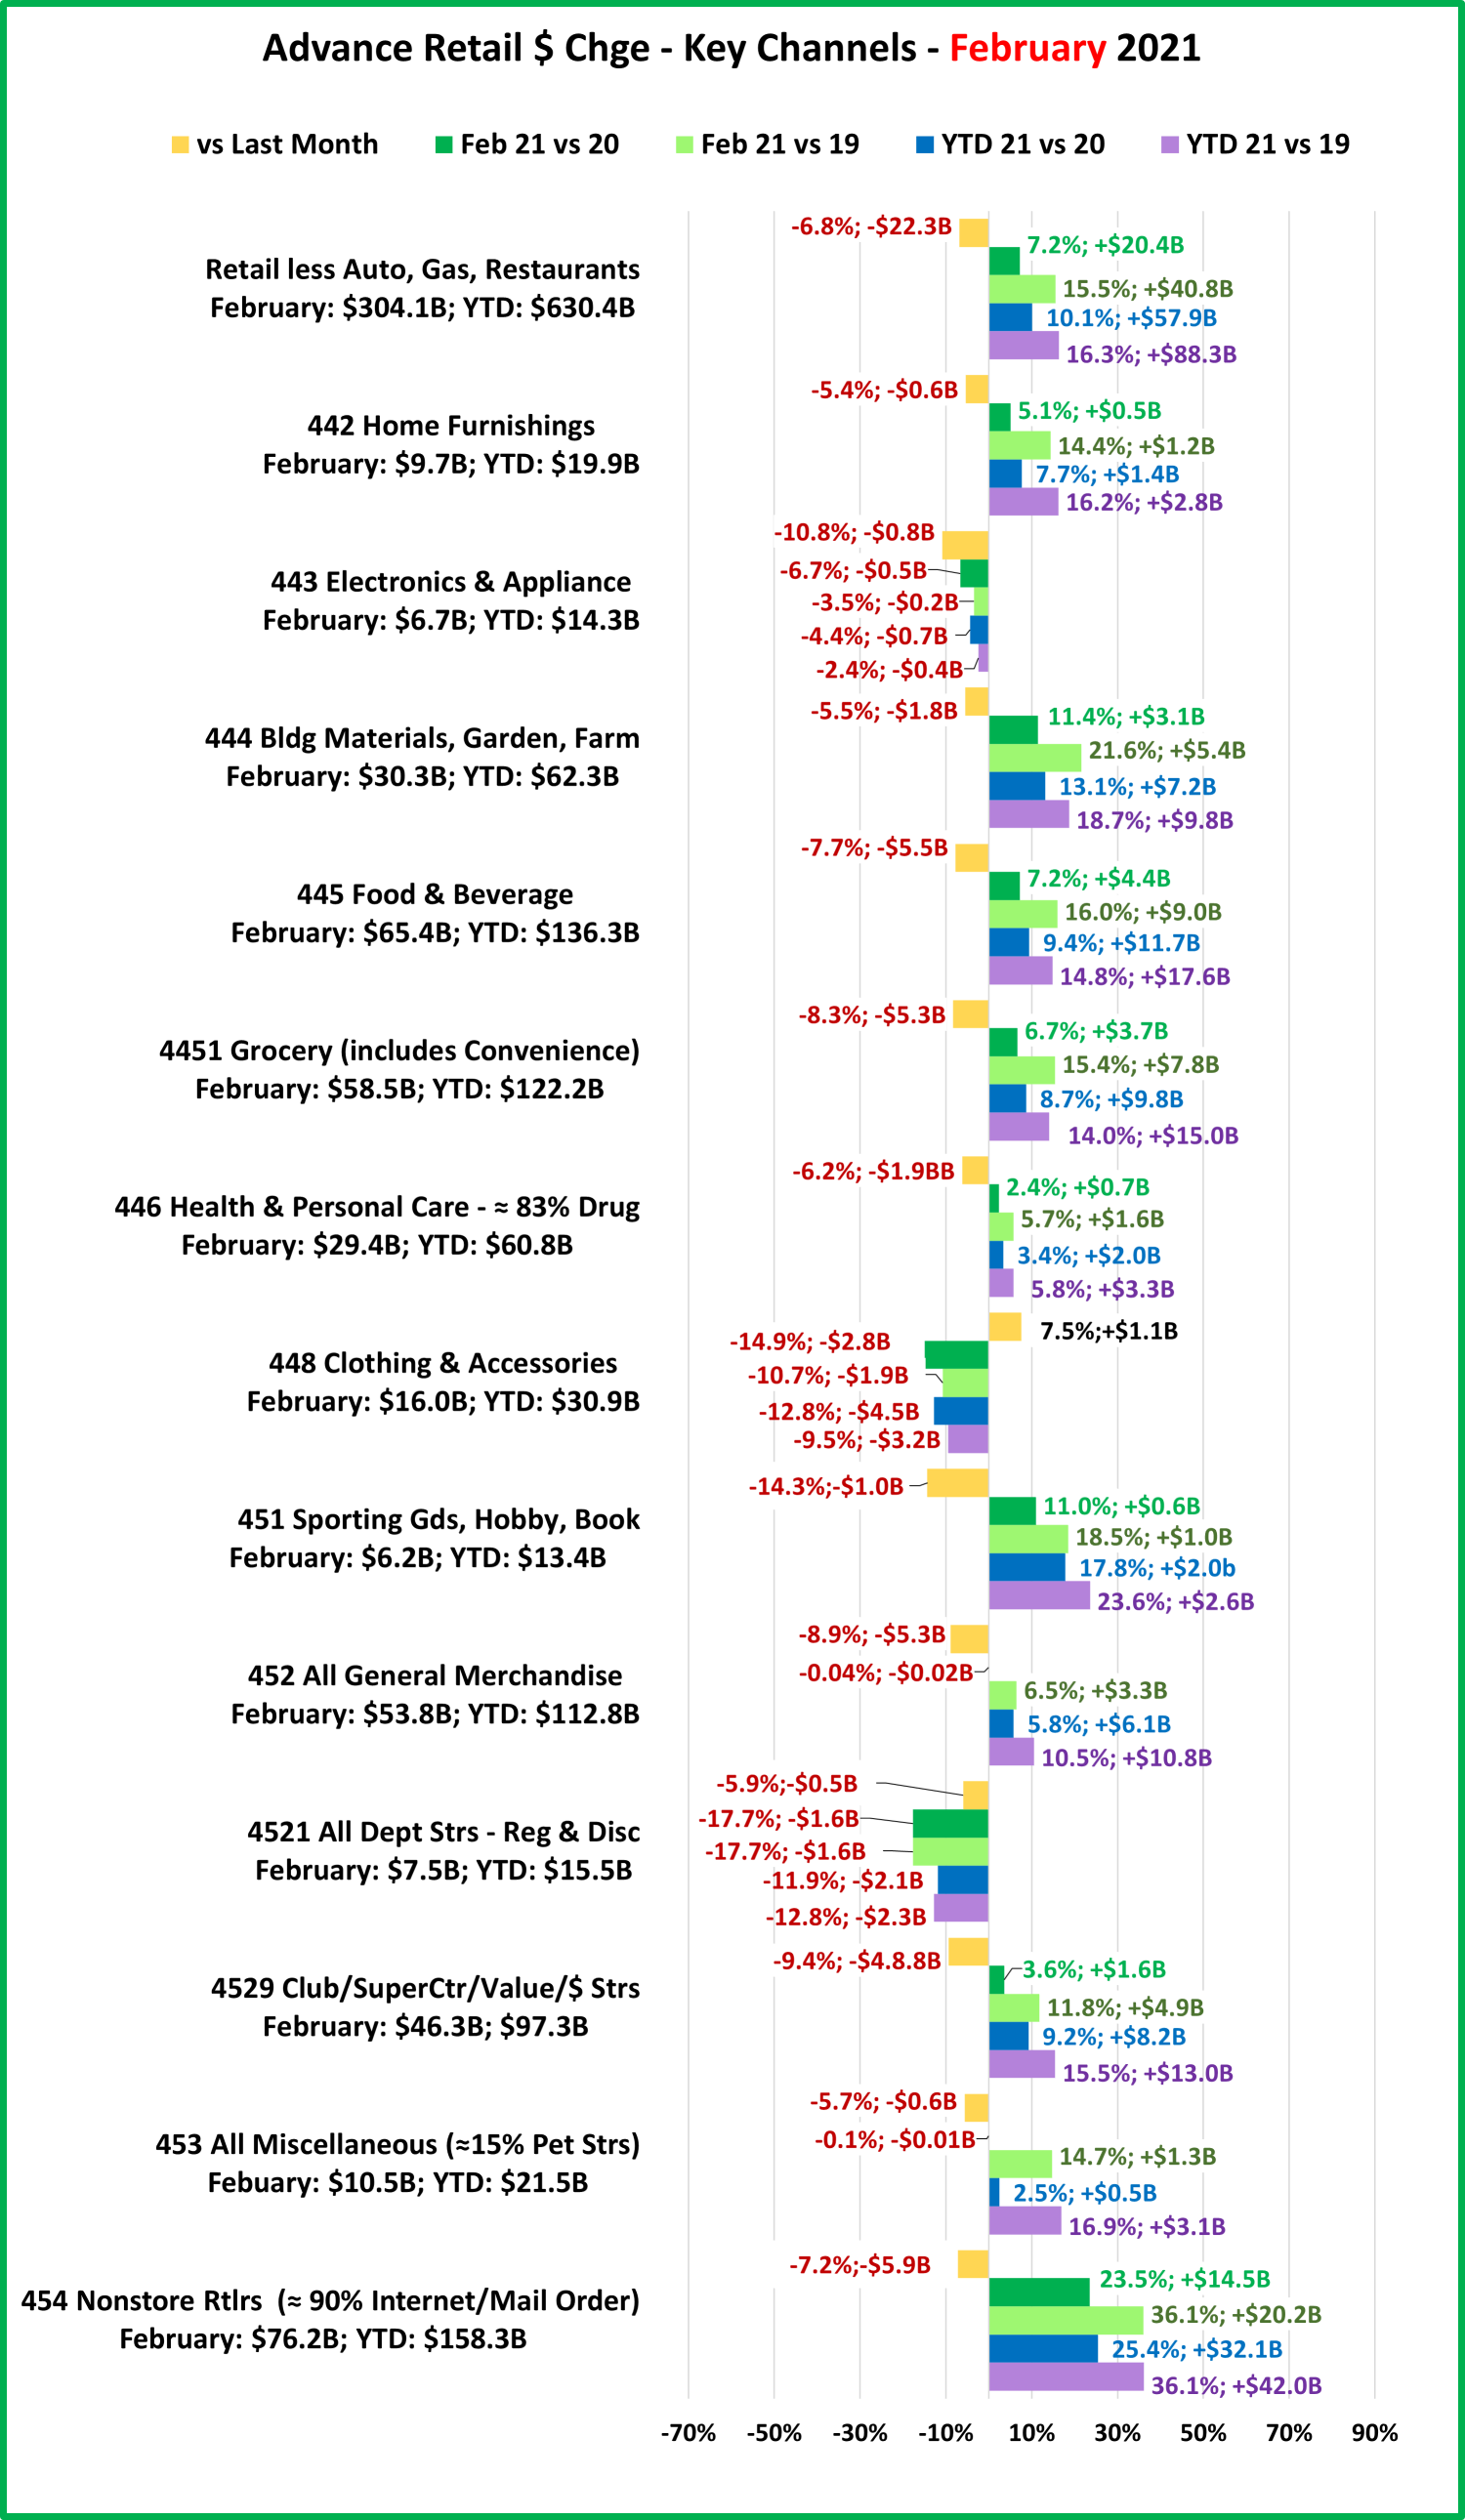
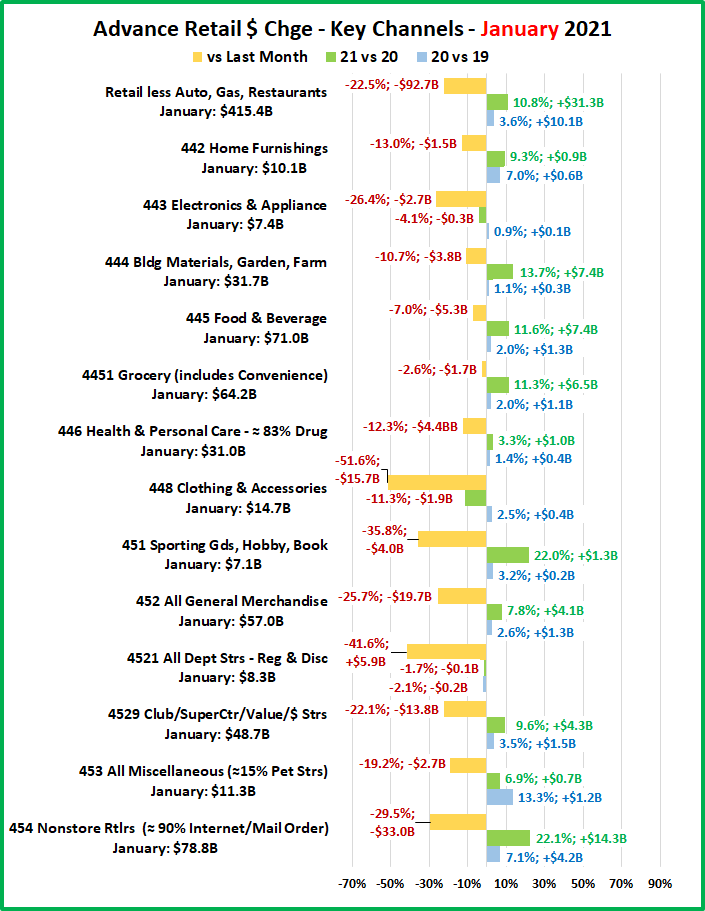
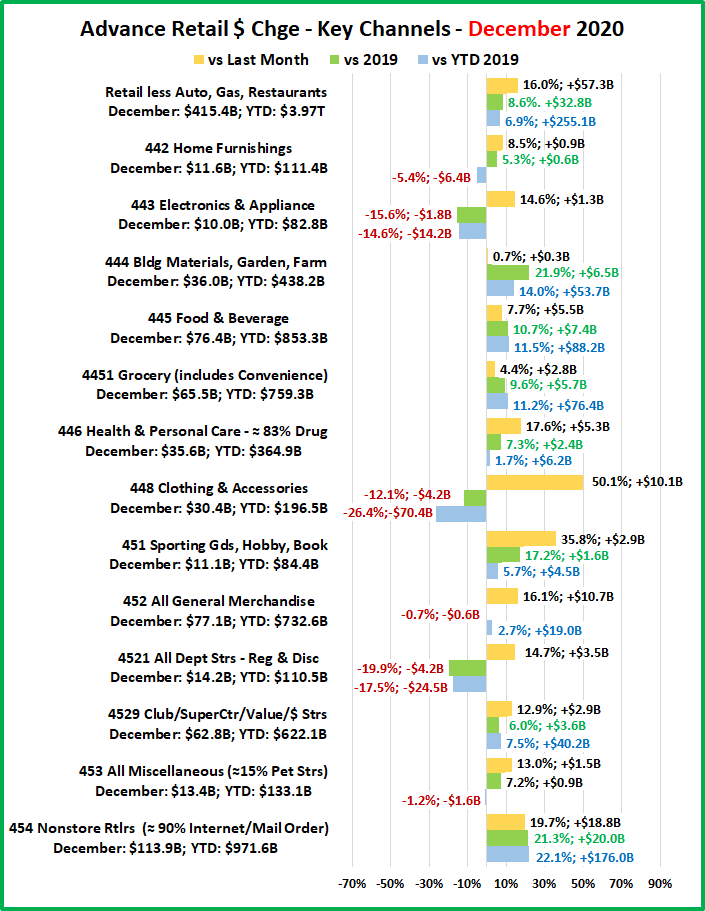
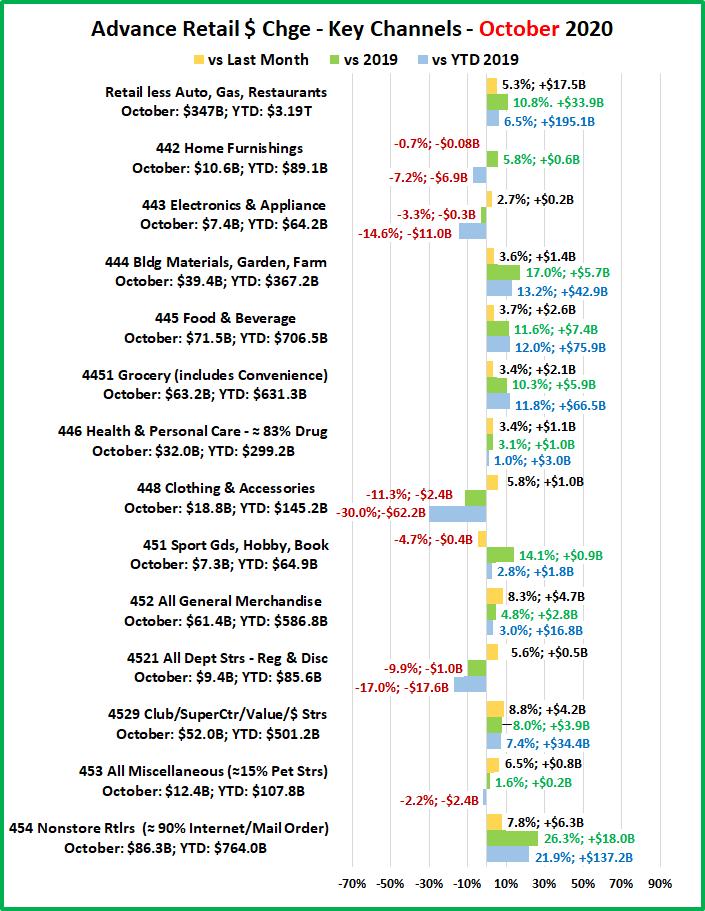
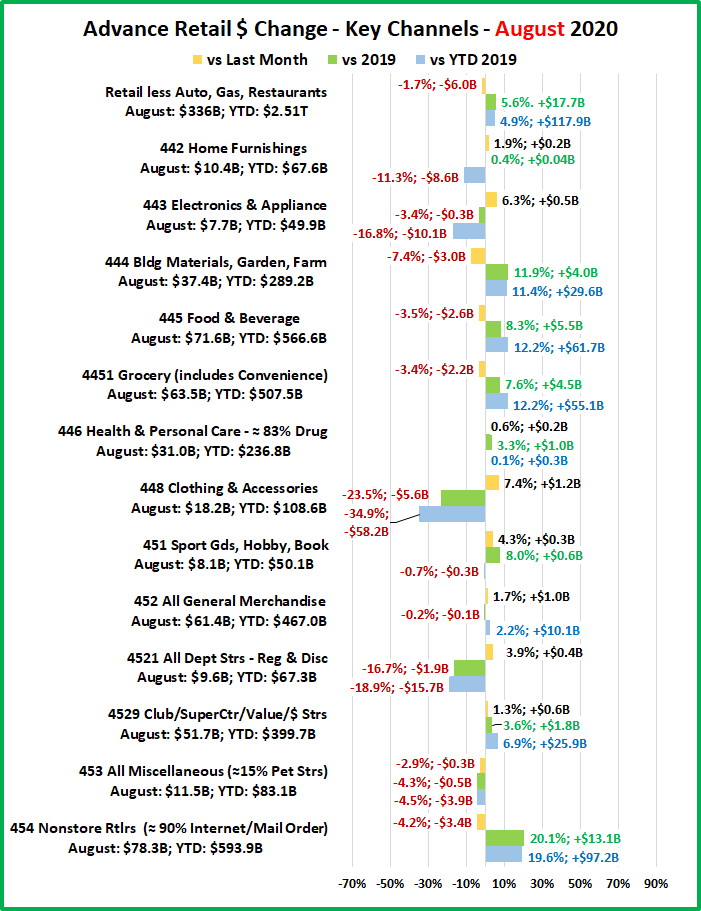
Now let’s look at what is happening in the individual retail channels to see where the $ are coming from. April was not as big as March, but you will see that some of the increases vs 2020 are literally “off the charts”. The groups are less defined than in the Final Monthly reports and we will look across the whole market, not just pet relevant outlets.

Sales in only 2 of 13 channels were up vs record March $ but Only 1 channel was down vs March 2020 $ and 2020 YTD. A different channel was down vs 2019 numbers. (Relevant Retail YTD Avg Annual Growth Rate since 2019 = +9.8%)
After hitting bottom in April 2020, Relevant Retail has now beaten the previous year’s $ for 12 consecutive months. The group set an all-time record of $407B in December and finished 2020 +$260B vs 2019. They started 2021 strong, with record sales in every month including #3 and #4 all time in March & April. Essential channels are still the primary drivers:
- Nonstore Retailers – The biggest driver. Online shopping continues to grow in # of households and in $.
- Food & Beverage – Grocery– Restaurant $ are improving but consumers continue to eat & drink more at home.
- Bldg Materials/Garden/Farm– Their “Spring” lift continues unabated as consumers focus on their home.
- SuperCtrs/Club/Value/$ Strs – They keep the GM channel positive. Value is still a major consumer priority.
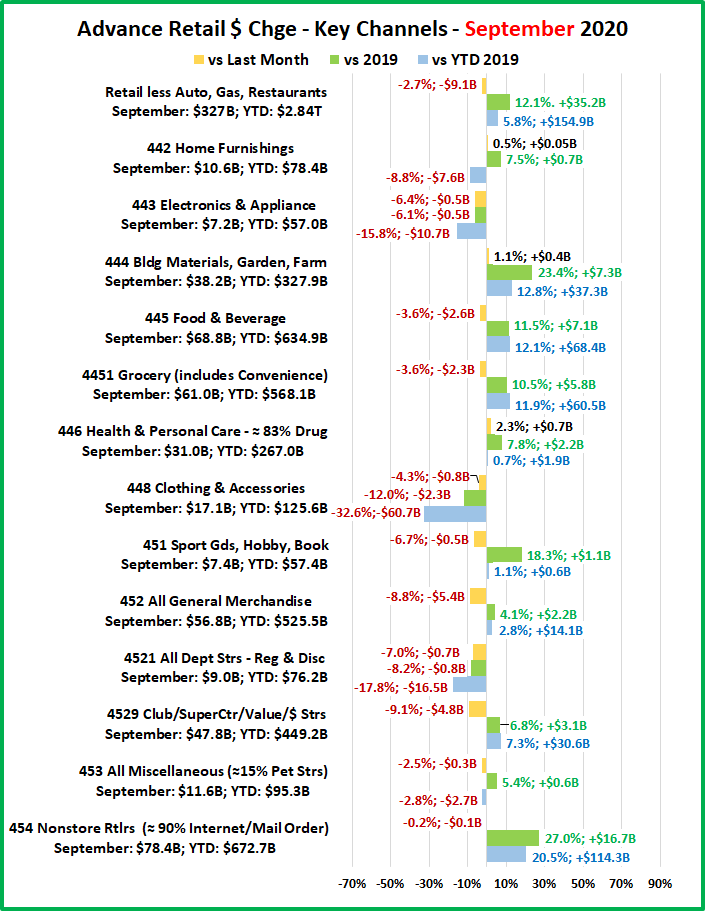
Regarding the Individual Large Channels (Includes YTD Avg Annual Growth Rate since 2019)
General Merchandise Stores – Even though sales dropped in April, all other numbers remain positive. Department Stores $ remain up vs 2020 but down vs 2019. They were having problems before the Pandemic. The growth by Club/SuperCtr/$ stores has slowed to +7.4% in April, down from +14.7% in January but these stores are still the key.
- YTD Avg Annual Growth: All GM = +5.7%; Dept Stores = -2.9%; Club/SuprCtr/$ = +7.4%
Food and Beverage, plus Health & Personal Care Stores – Sales in Grocery were down in March and April from 2020 – No surprise, as these were 2020 binge months – especially March. The Health, Personal Care group finished 2020 at +1.8%. 2021 has started even better. With a strong March & April, YTD they are +7.8% vs 2020 and +8.5% vs 2019.
- YTD Avg Annual Growth: Grocery = +6.6%; Health/Drug Stores = +4.2%
Clothing and Accessories; Electronic & Appliances; Home Furnishings – March & April have been spectacular for all these channels. The increases vs April 2020 were literally off the chart for Electronics and Clothing. All of these groups are now positive in all measurements vs 2020 or 2019.
- YTD Avg Annual Growth: Clothing = +0.6%; Electronic/Appliance = +2.0%; Furniture = +10.4%
Building Material, Farm & Garden & Hardware – Their Spring lift began on time in 2020 and it has never stopped. They have greatly benefited from consumers turning their focus to their home needs. They finished 2020 +53B (+13.8%). Sales took off in March and increased in April. They are +32.9% vs April 2020 and +25.5% YTD. Avg Annual Growth = +15.2%
Sporting Goods, Hobby and Book Stores – Book & Hobby stores are open but Sporting Goods stores have driven the lift in this group. Consumers turned their attention to personal recreation and sales in Sporting Goods outlets took off. The group ended 2020 +5.5% vs 2019. The growth accelerated in 2021. January > April set monthly records and March had the most $ of any non-December month in history. In April they are +59.4% vs 2020. YTD Avg Annual Growth = +17.2%
All Miscellaneous Stores – Pet Stores were deemed essential but most other stores were not, so closures hit this group particularly hard. Sales hit bottom at -$3.8B in April then began to rebound. They finished with a strong December and ended 2020 down $1.0B, -0.7%. In March and April sales took off. April sales were only up 0.6% from March but +87.4% from April 2020. Remember, only 2 channels had a March>April increase. Their YTD sales are now 30.4% above 2020 and 27.0% more than 2019. It appears that their recovery has become very real. YTD Avg Annual Growth = +12.7%
NonStore Retailers – 90% of the volume of this group comes from Internet/Mail Order/TV businesses. The COVID-19 crisis accelerated the movement to online retail. In February 2020 NonStore $ were 8.6% YTD. In December monthly sales exceeded $100B for the 1st time. They ended 2020 at +21.4%, +$162.9B. Their increase was 63% of the total $ increase for Relevant Retail Channels. Their 2020 performance far exceeded their 12.9% increase in 2019 and every month in 2021 has produced record $. April is +14.2% vs 2020 and YTD $ are +20.8%. YTD Avg Annual Growth = +18.7%
Note: Almost without exception, online sales by brick ‘n mortar retailers are recorded with their regular store sales.
Recap – 2020 was quite a year. April & May had the 2 biggest year over year sales decreases in history while December sales broke $600B for the first time. 2021 may become even more memorable. April and March had the 2 biggest year over year monthly sales increases in history. The total increase was +$361B for these 2 months, more than twice the -$175B decrease in the 3 months from March>May 2020. In 2021, March and April also took the top 2 spots for monthly sales. At yearend 2020, Restaurants, Auto and Gas Stations were still struggling but Auto had largely recovered. Relevant retail had segments that also struggled but overall, they led the way for Total Spending to finish the year +0.5% vs 2019. 2021 has started out even more positive. The Auto Segment is setting sales records. Gas Stations $ are now all positive and YTD Restaurant $ are only slightly below 2020 and 2019. As documented in the report, the recovery in Relevant retail has become real for virtually all channels and monthly sales continue to set records. Retail recovery is here…now!