Information by distribution channel

INFLATION’S IMPACT ON RETAIL SALES GROWTH – APRIL 2025

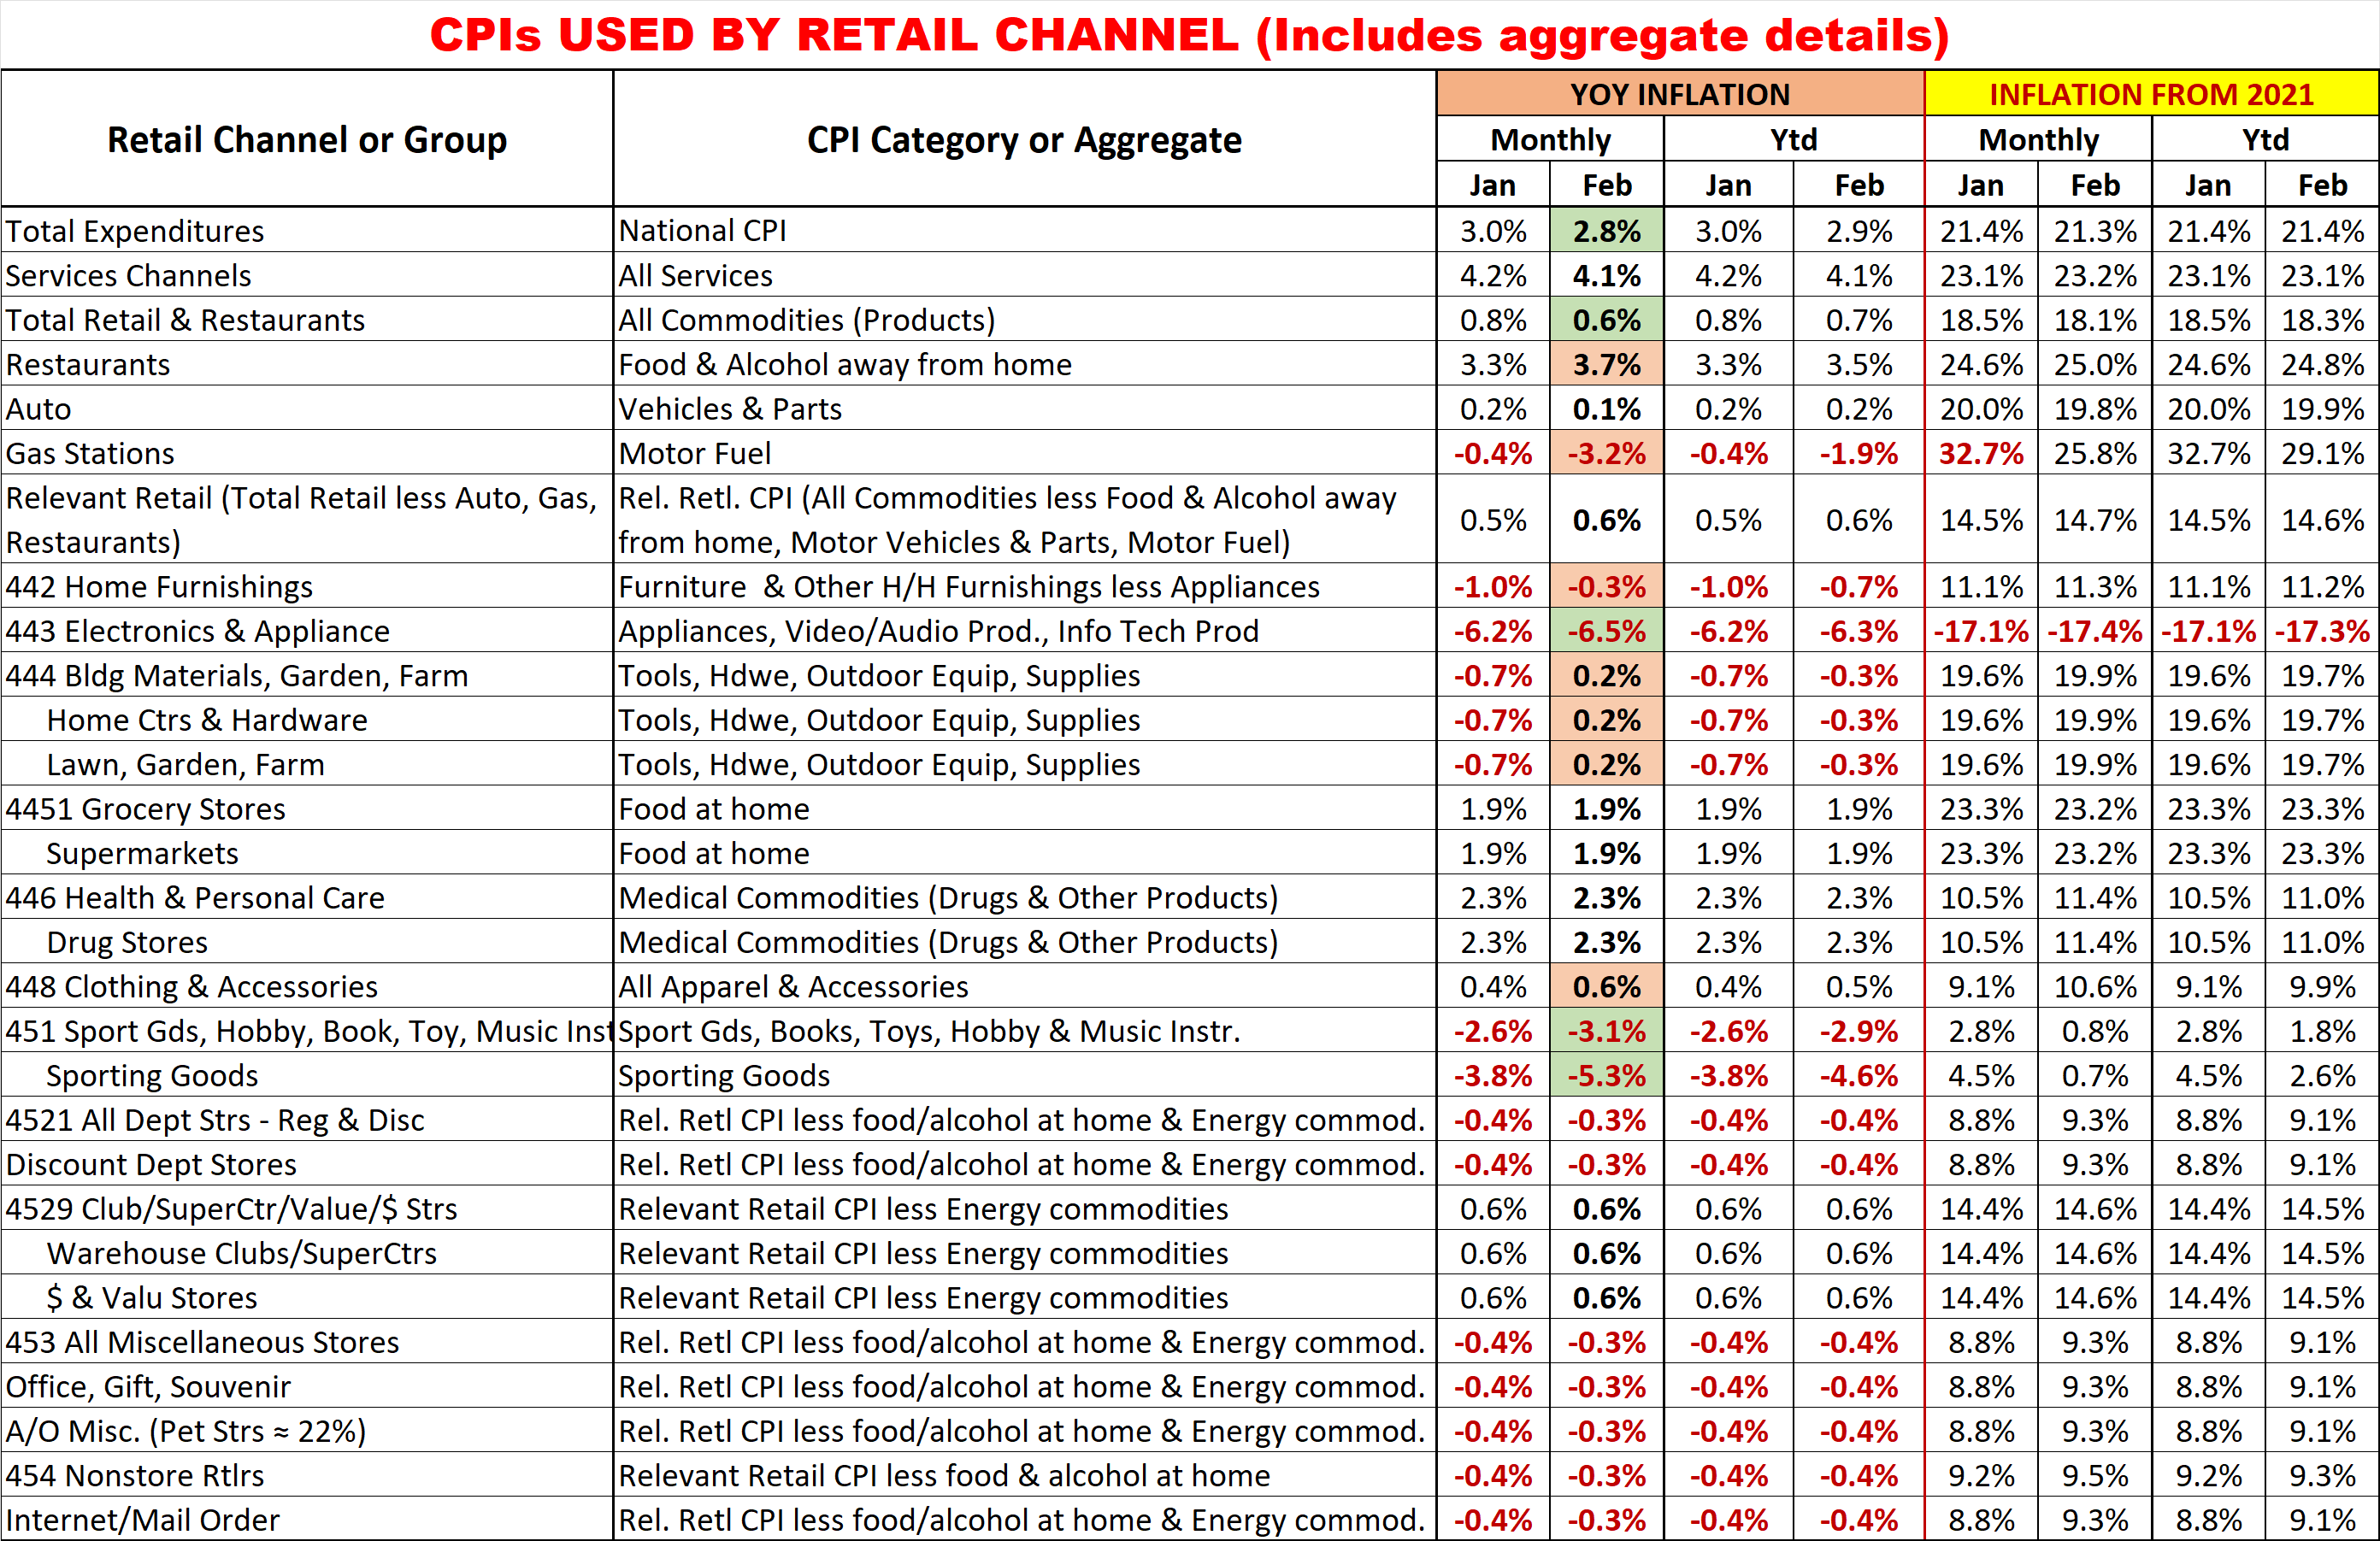
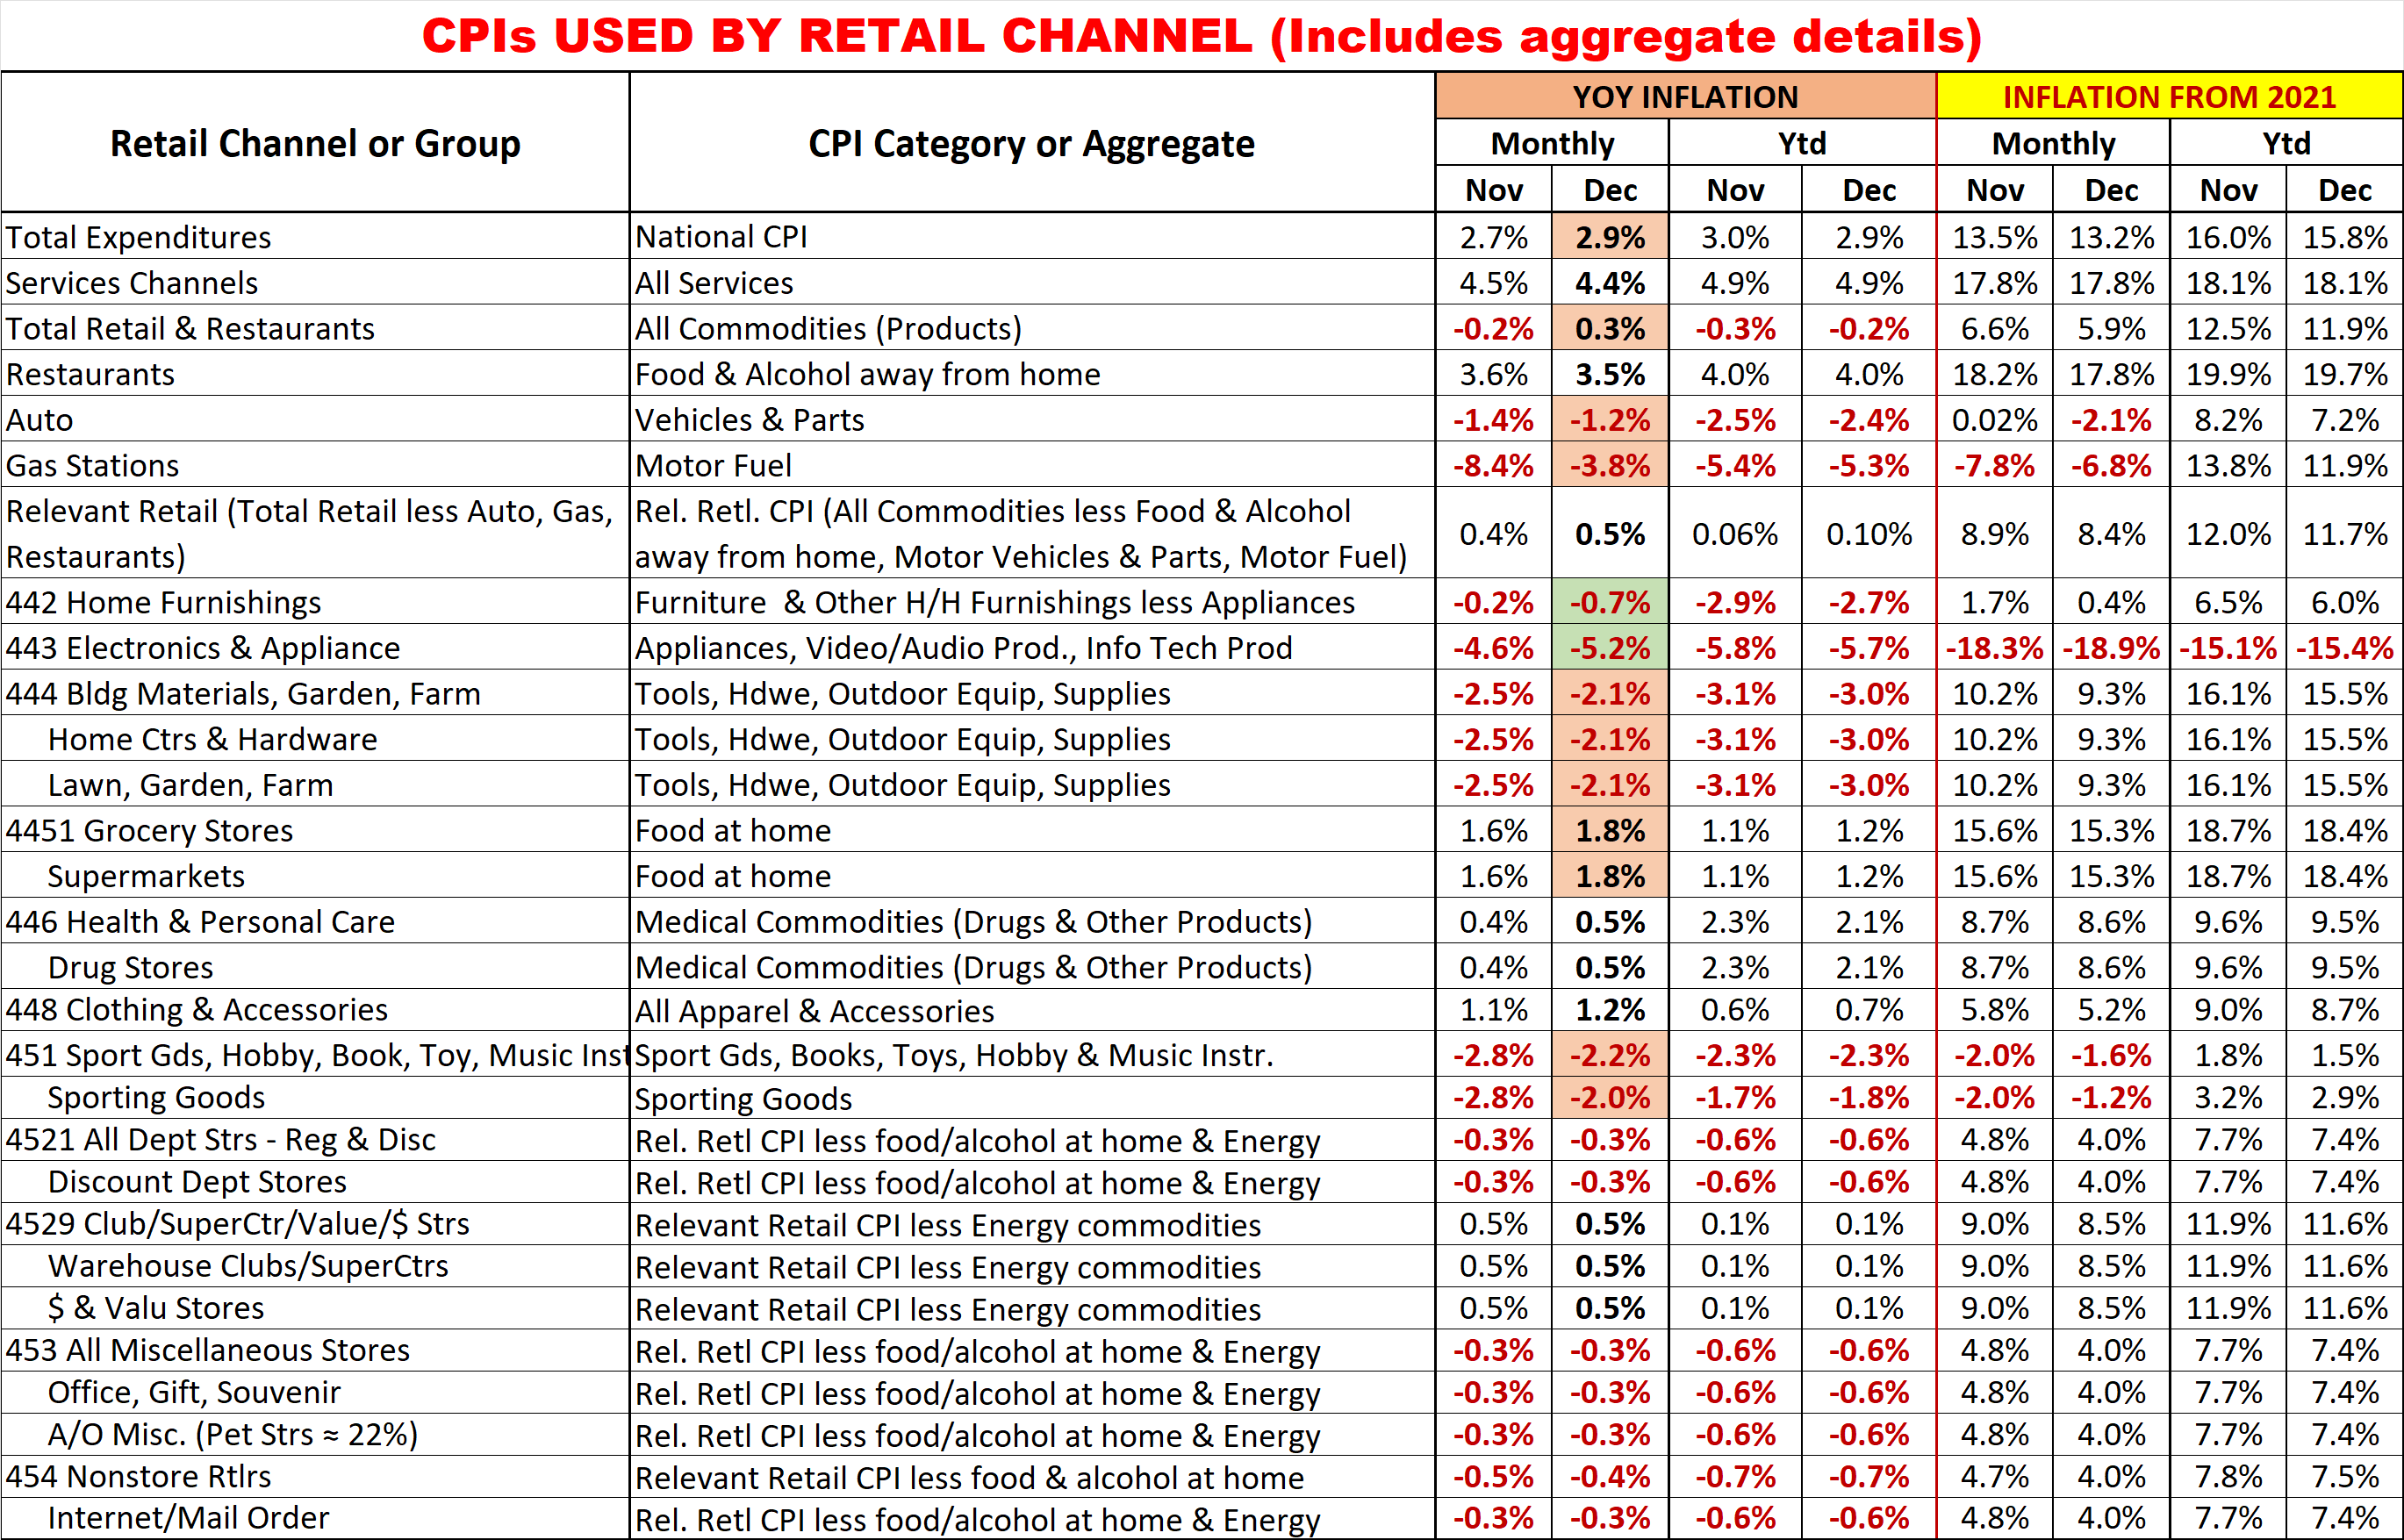
Inflation seems simple – just compare this year’s prices to the same time last year. In fact, it is more complex. The most important thing to remember is that it is cumulative so even when the YOY rate slows, it can cause a range of issues – selling less product and even a drop in revenue. One impact that is often ignored is slowed $ growth. That is the focus of this report. In order to give an accurate reading of the situation we will include charts for the Big Retail Groups and the “Advance” Relevant Retail Channels. We will also include separate charts for Monthly & Ytd data to better show trends.

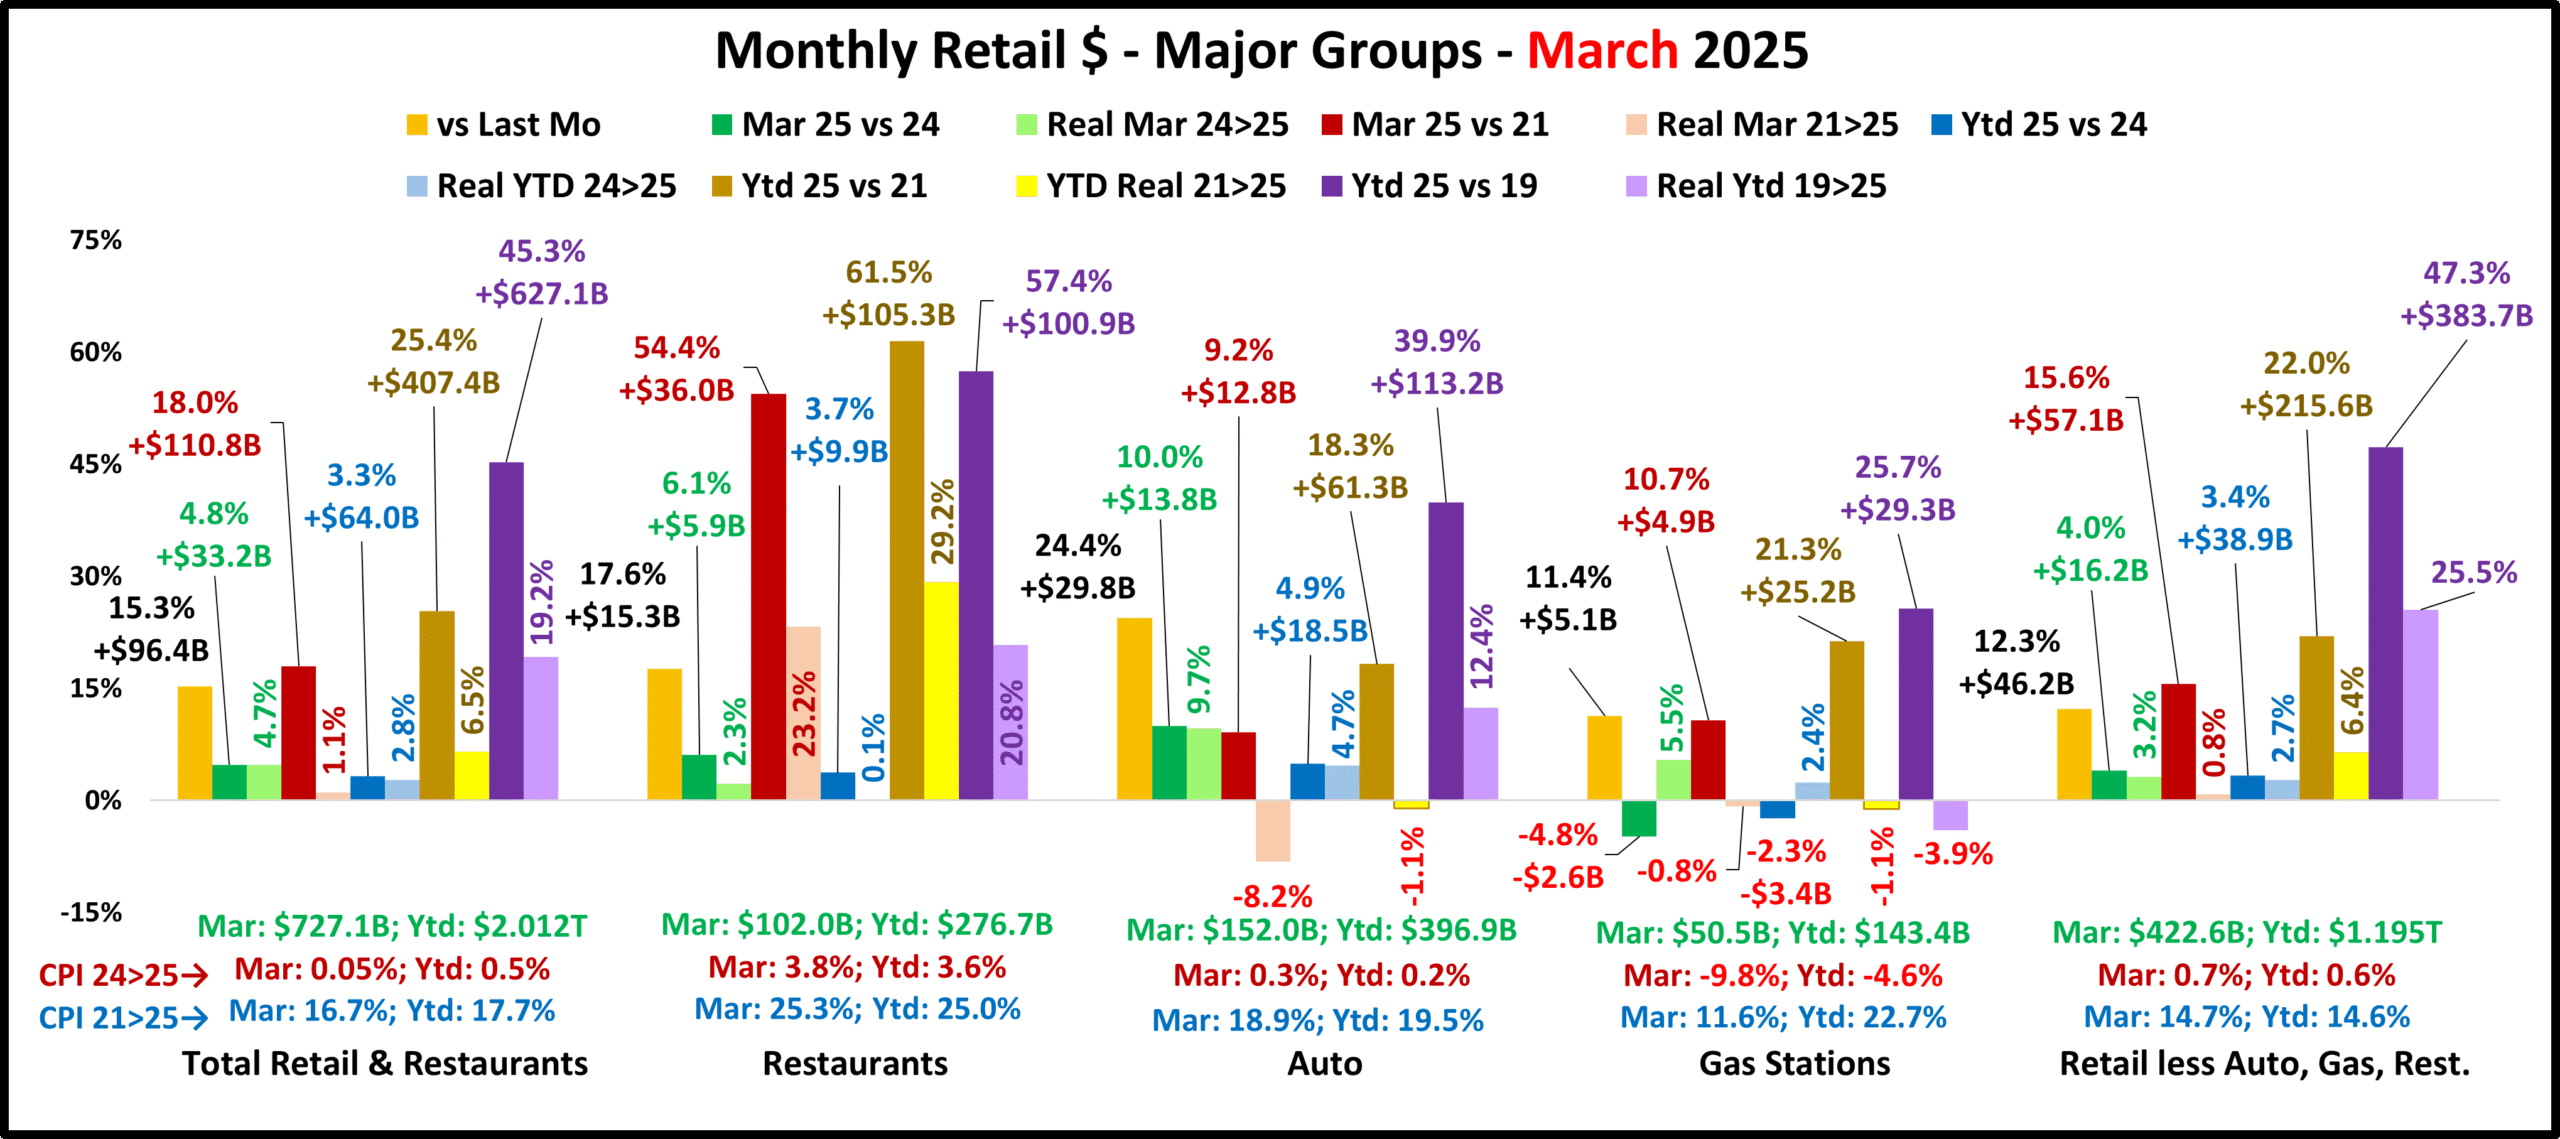
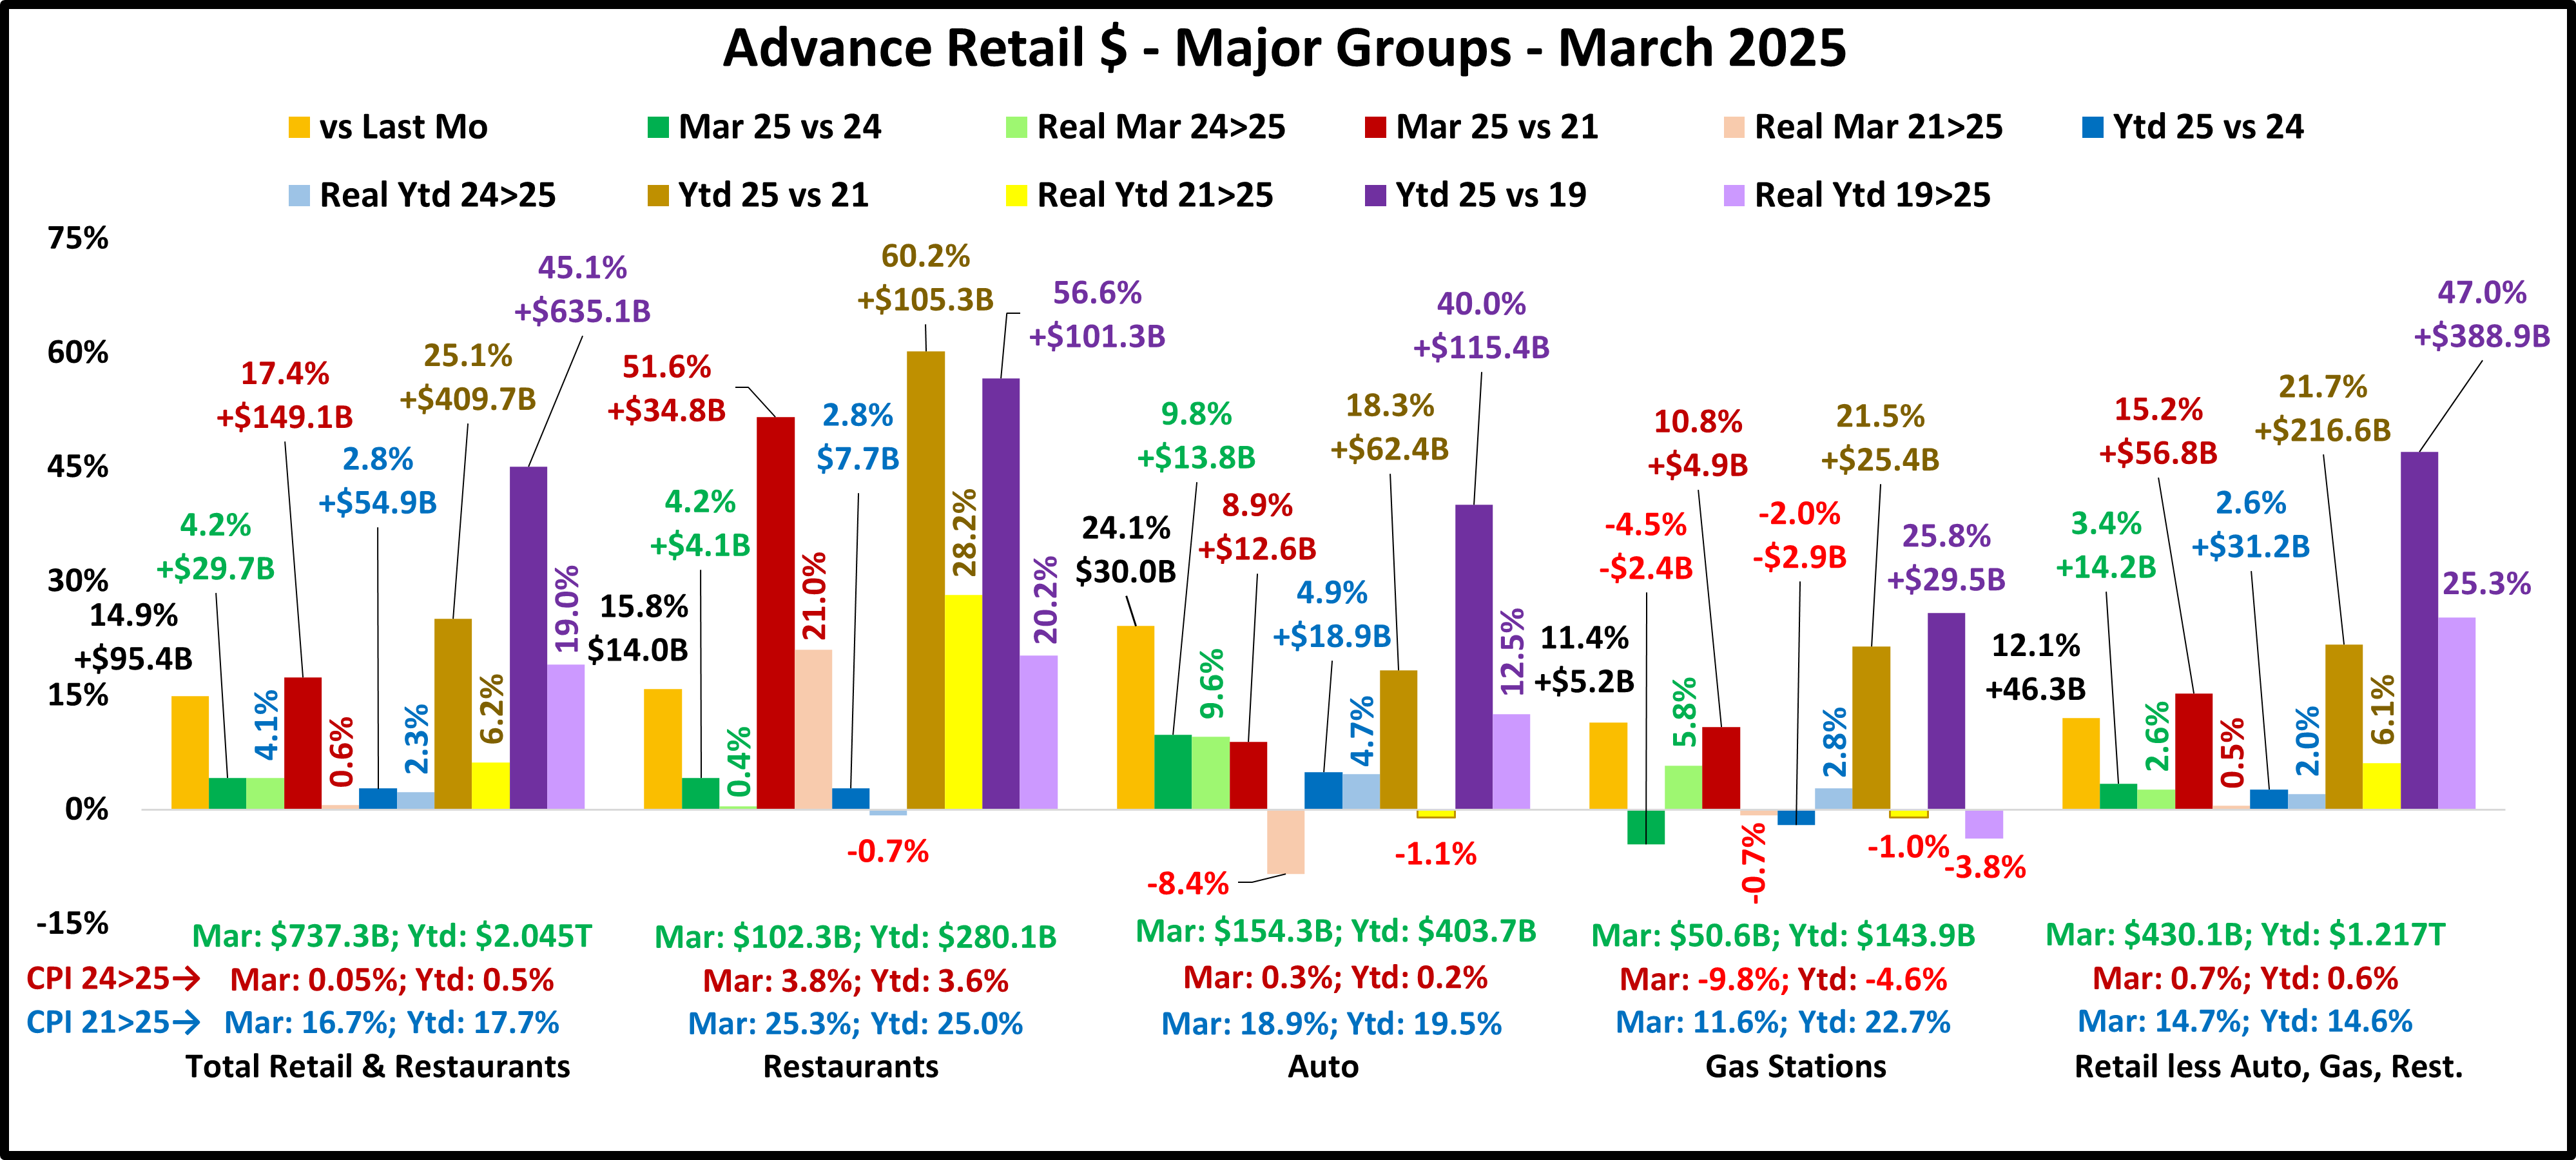
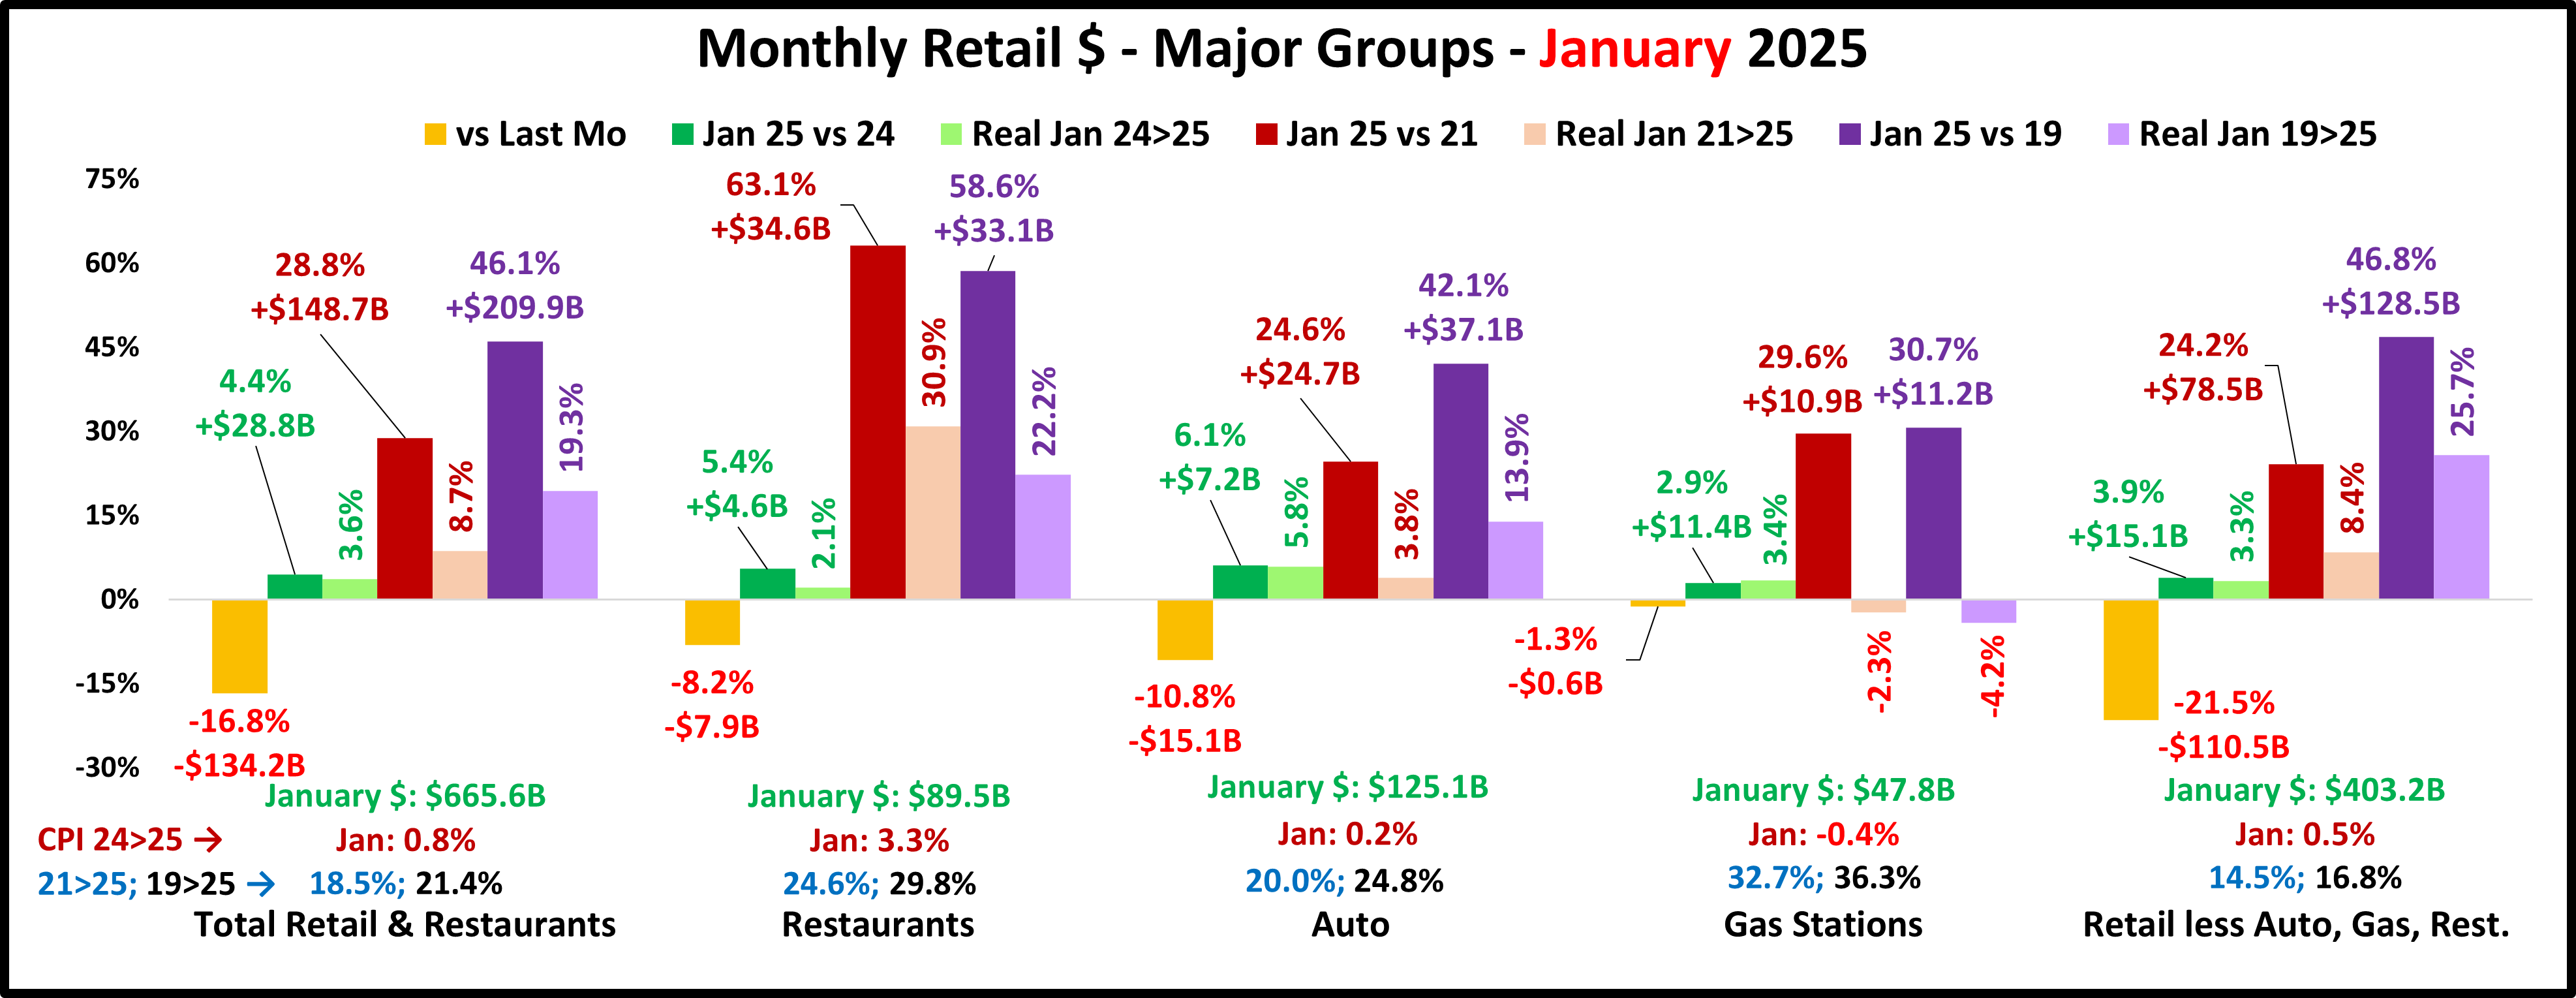
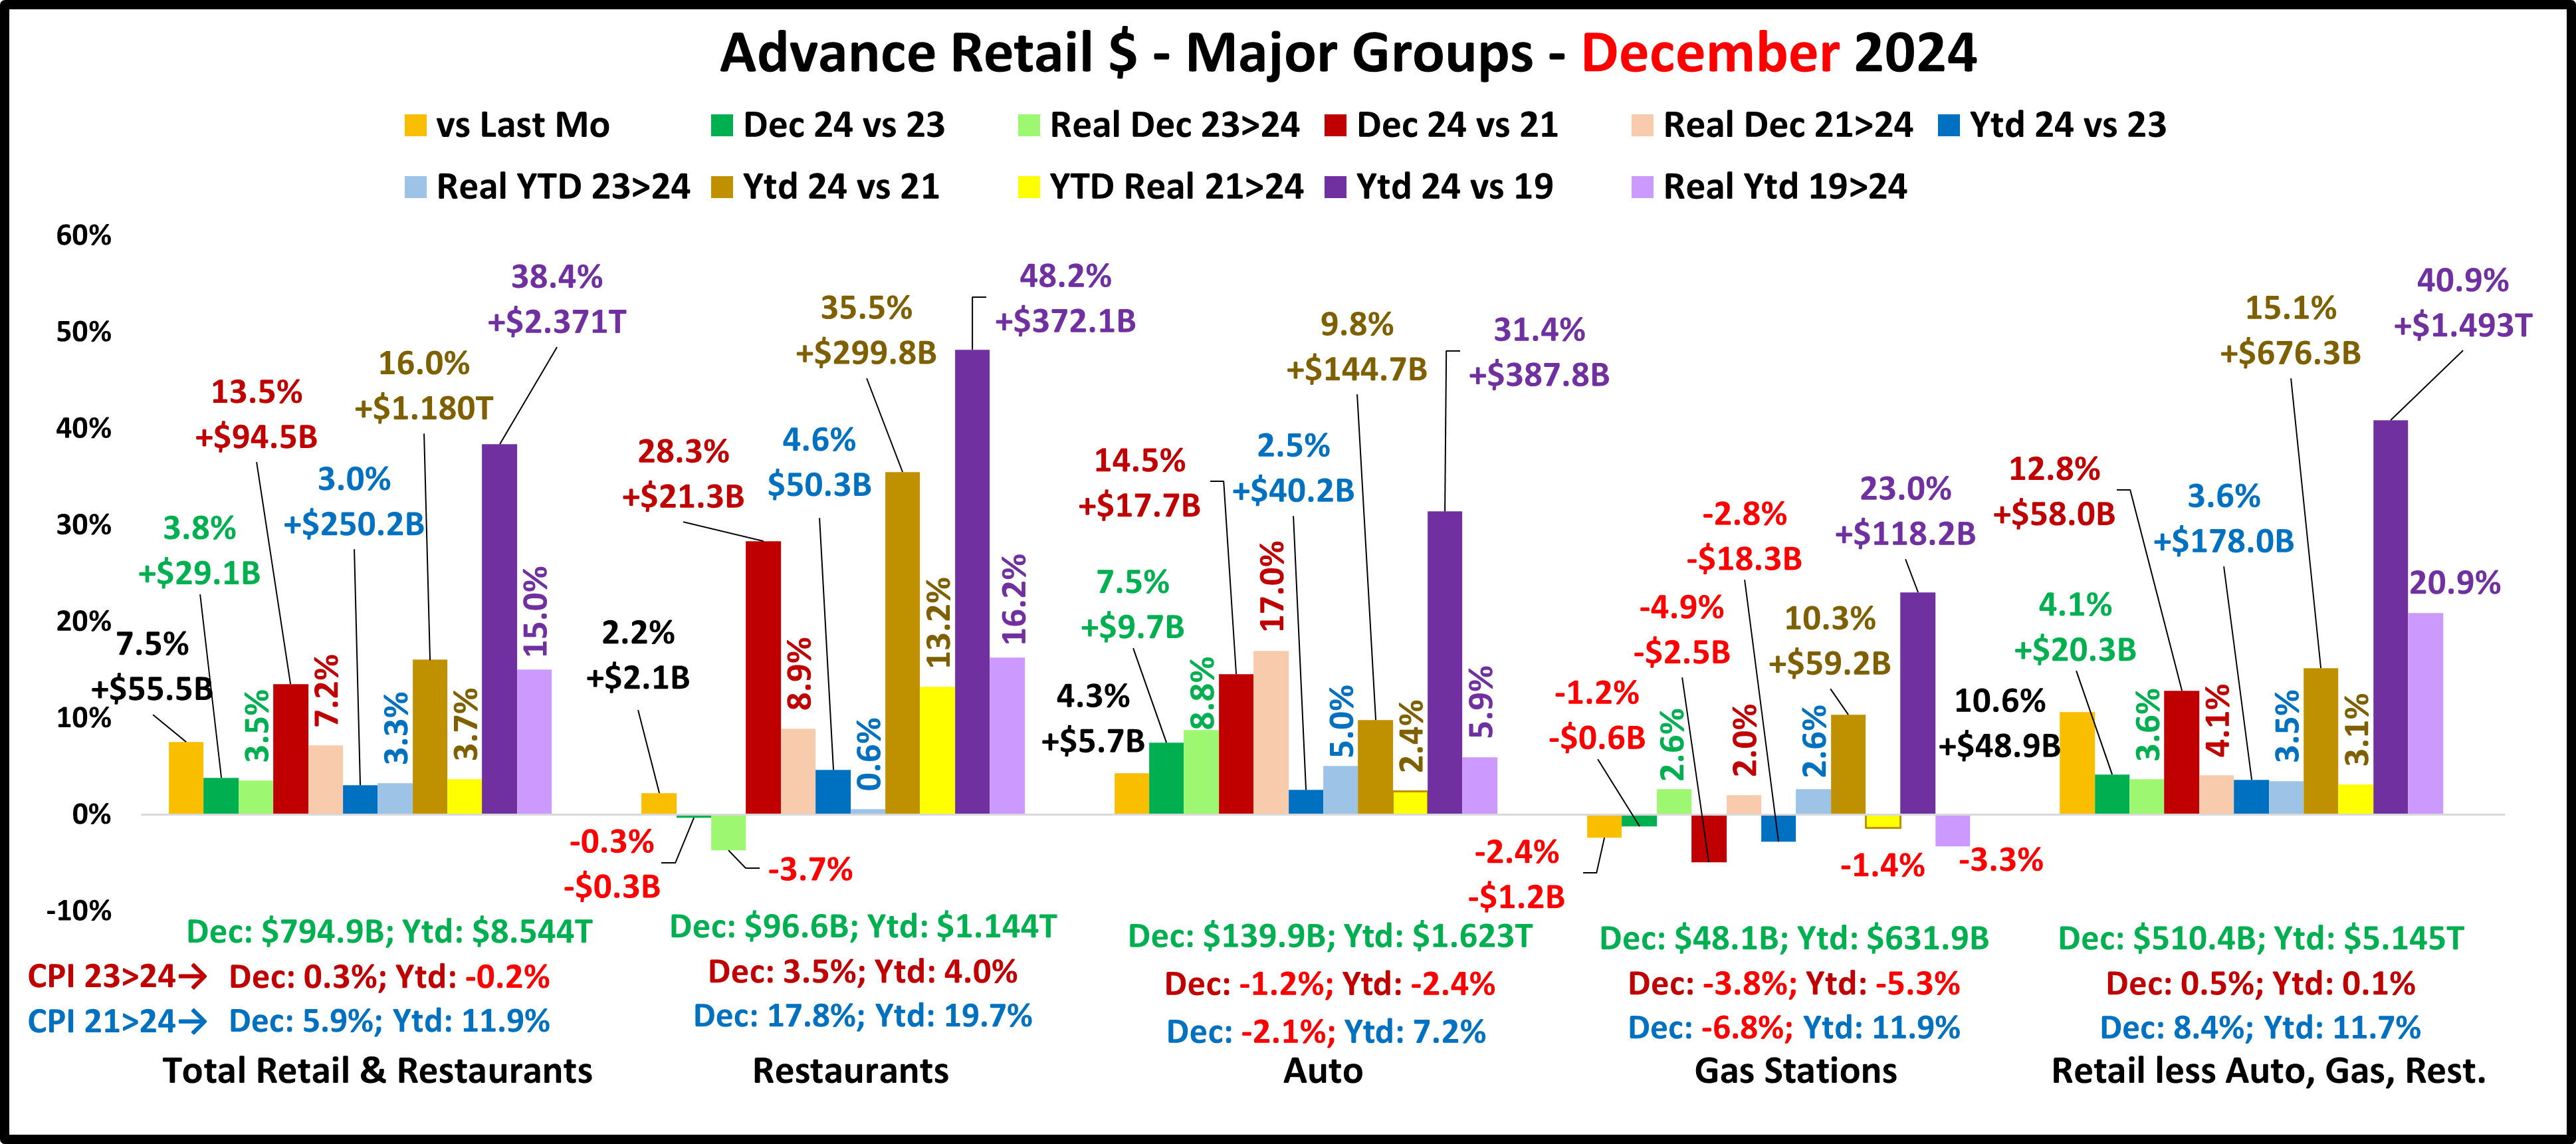
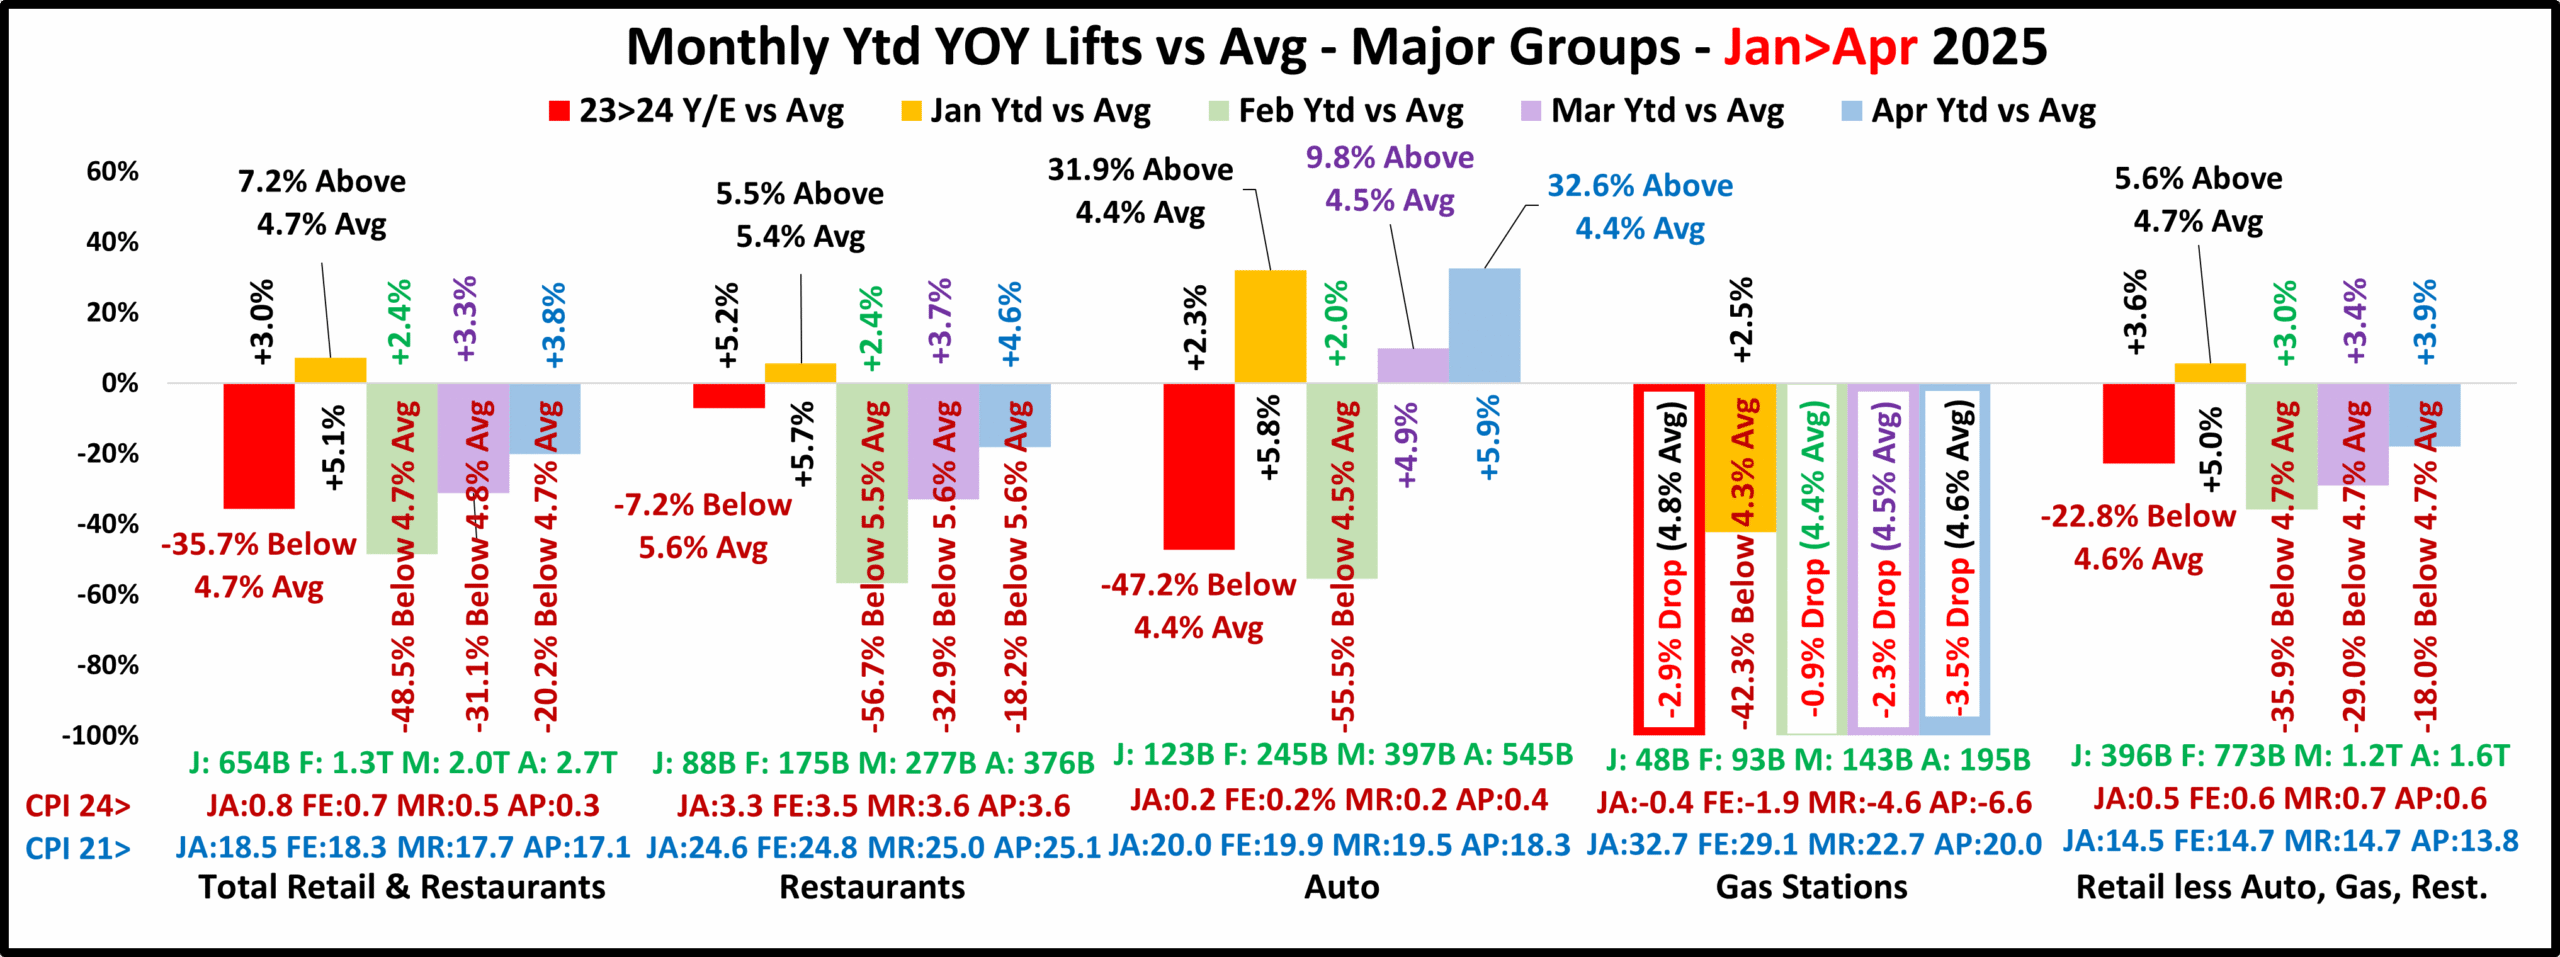
First the Jan>Apr Monthly Report for Big Groups (100% of U.S. Retail $)

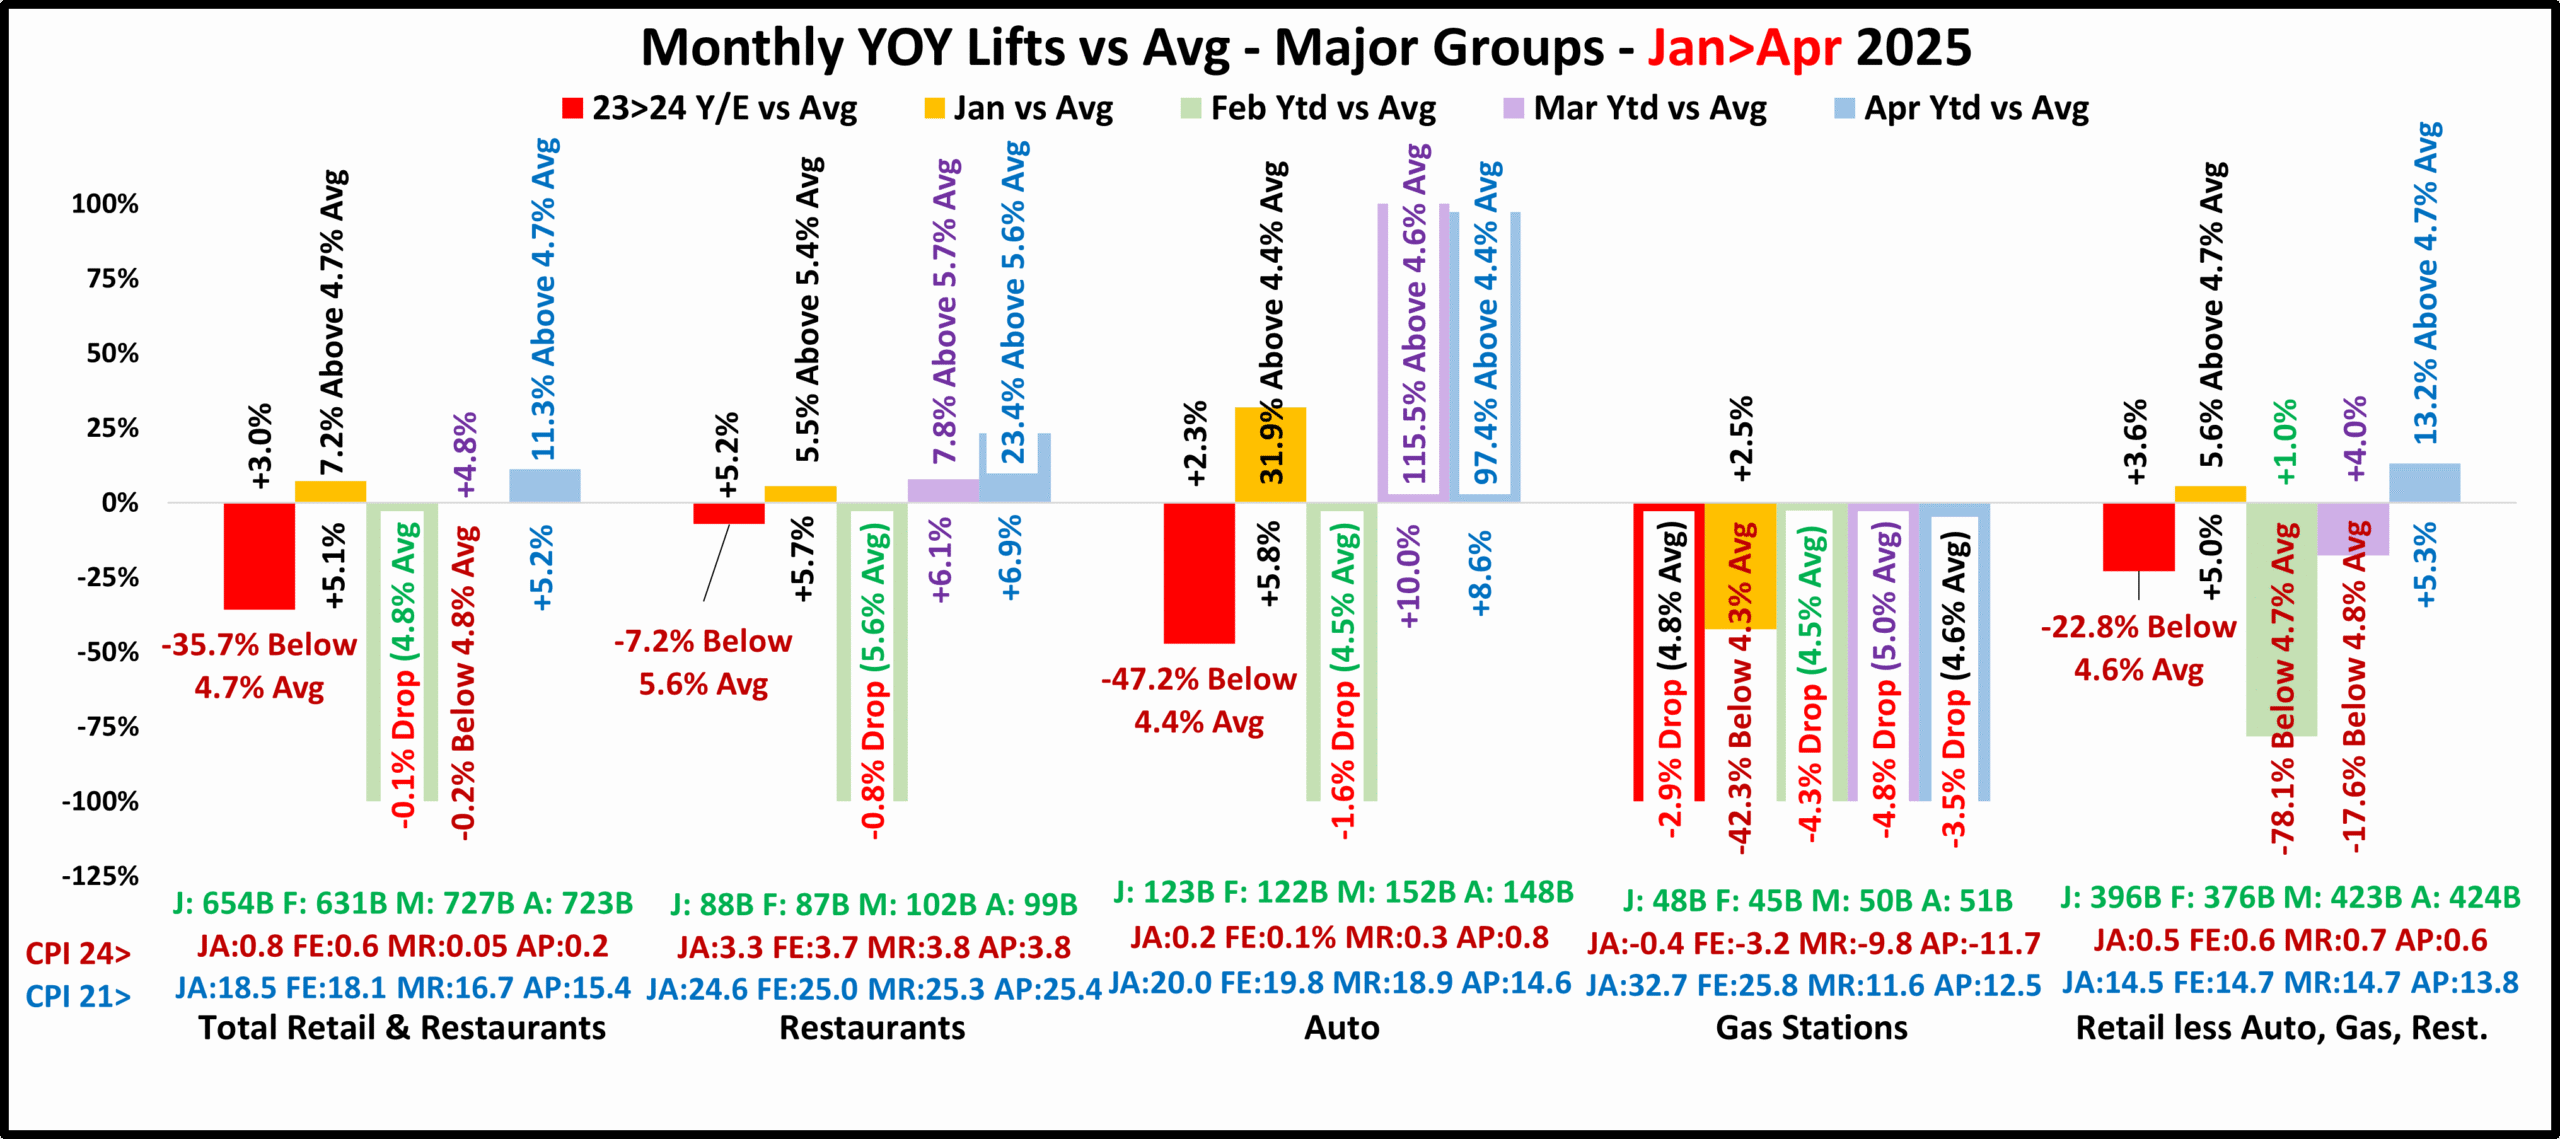
We also included the Y/E numbers for 2024, both actual & average, to show our goal – Beat these lifts!
There are 3 things that immediately stand out. One is expected – a BAD February. It is often the low point of the Retail year. In 2025, the lift vs 24 was -78% below avg for Relevant Retail, but Total and all other groups had drops. The big “surprise” is January. Gas Stations had their only monthly lift in 25. It was -42% below avg but all other groups had above avg lifts. A factor is that holiday spending has moved earlier. This encourages January spending. The final “stand out” is the big Mar>Apr lift in Auto. This is due to impending tariffs. People are buying now to avoid tarifflation’s high prices.

Restaurants – The February drop was small and the other 3 months had lifts above average. The lifts consistently increased reaching +6.9% in April, 23.4% above average. If they can continue their non-February performance, they will likely have a great year.

Auto – Their pattern is almost exactly the same as Restaurants but with lifts much more above average, especially in March & April. The Mar & Apr lifts were double the average. The 25% tariff was effective 4/3/25. Consumers saved thousands of dollars.

Gas Stations – They are truly in turmoil. Their only plus month was -42% below avg and all drops were bigger than 2024.

Relevant Retail – They do about 60% of Total Retail $ so it’s no surprise that they have a similar pattern. 1 big difference is that they were +1% in Feb – no drop. The Feb & Mar lifts were below avg while the Jan & Apr lifts were above. Their 23>24 lift was above Total Retail. In 25, only Feb & Apr were bigger. The chart clearly shows their Feb>Apr progress.

Total Retail – They had a drop in February, but March was basically equal to the average and Jan & Apr were slightly above average. All non-Feb months had lifts above the annual average and were 60+% more than the actual 3.0% lift in 2024. They are making progress but it is slow.

Summary: JAN: $↓: 0; ↑Avg: 4; ↓Avg: 1; FEB: $↓: 4; ↑Avg: 0; ↓Avg: 1; MAR: $↓: 1; ↑Avg: 2; ↓Avg 2; APR: $↓: 1; ↑Avg: 4; ↓Avg: 0

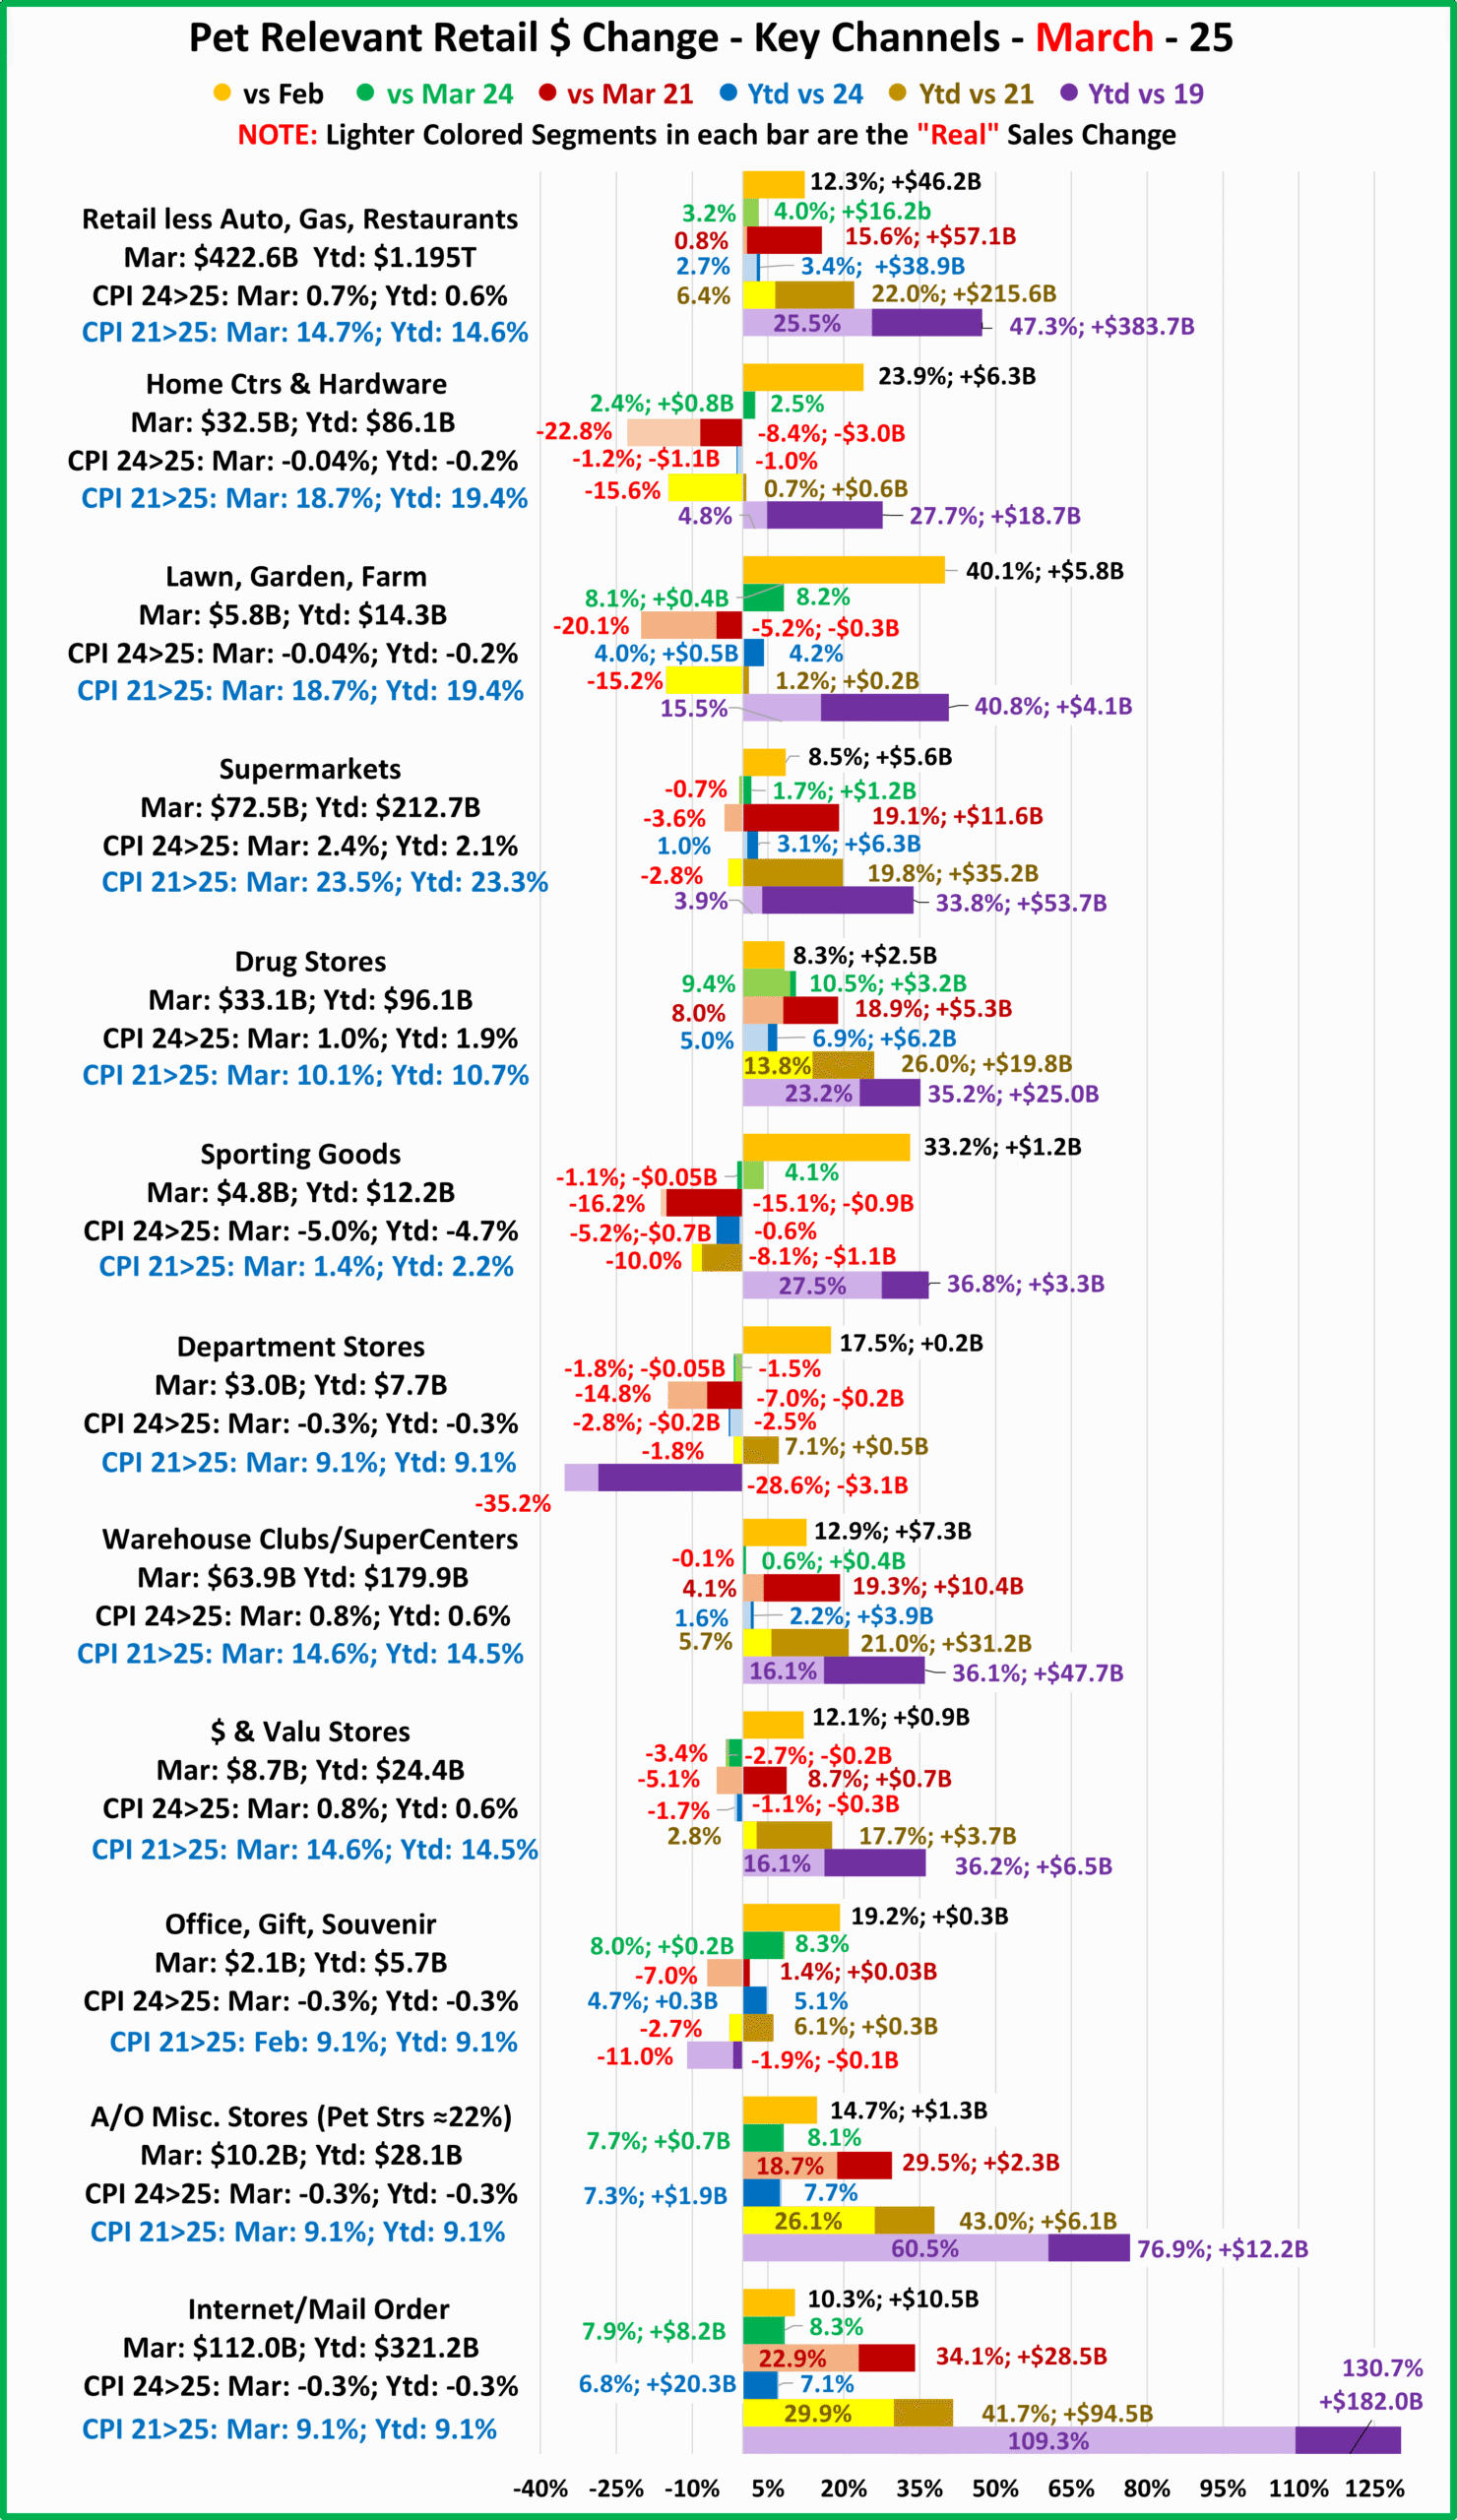
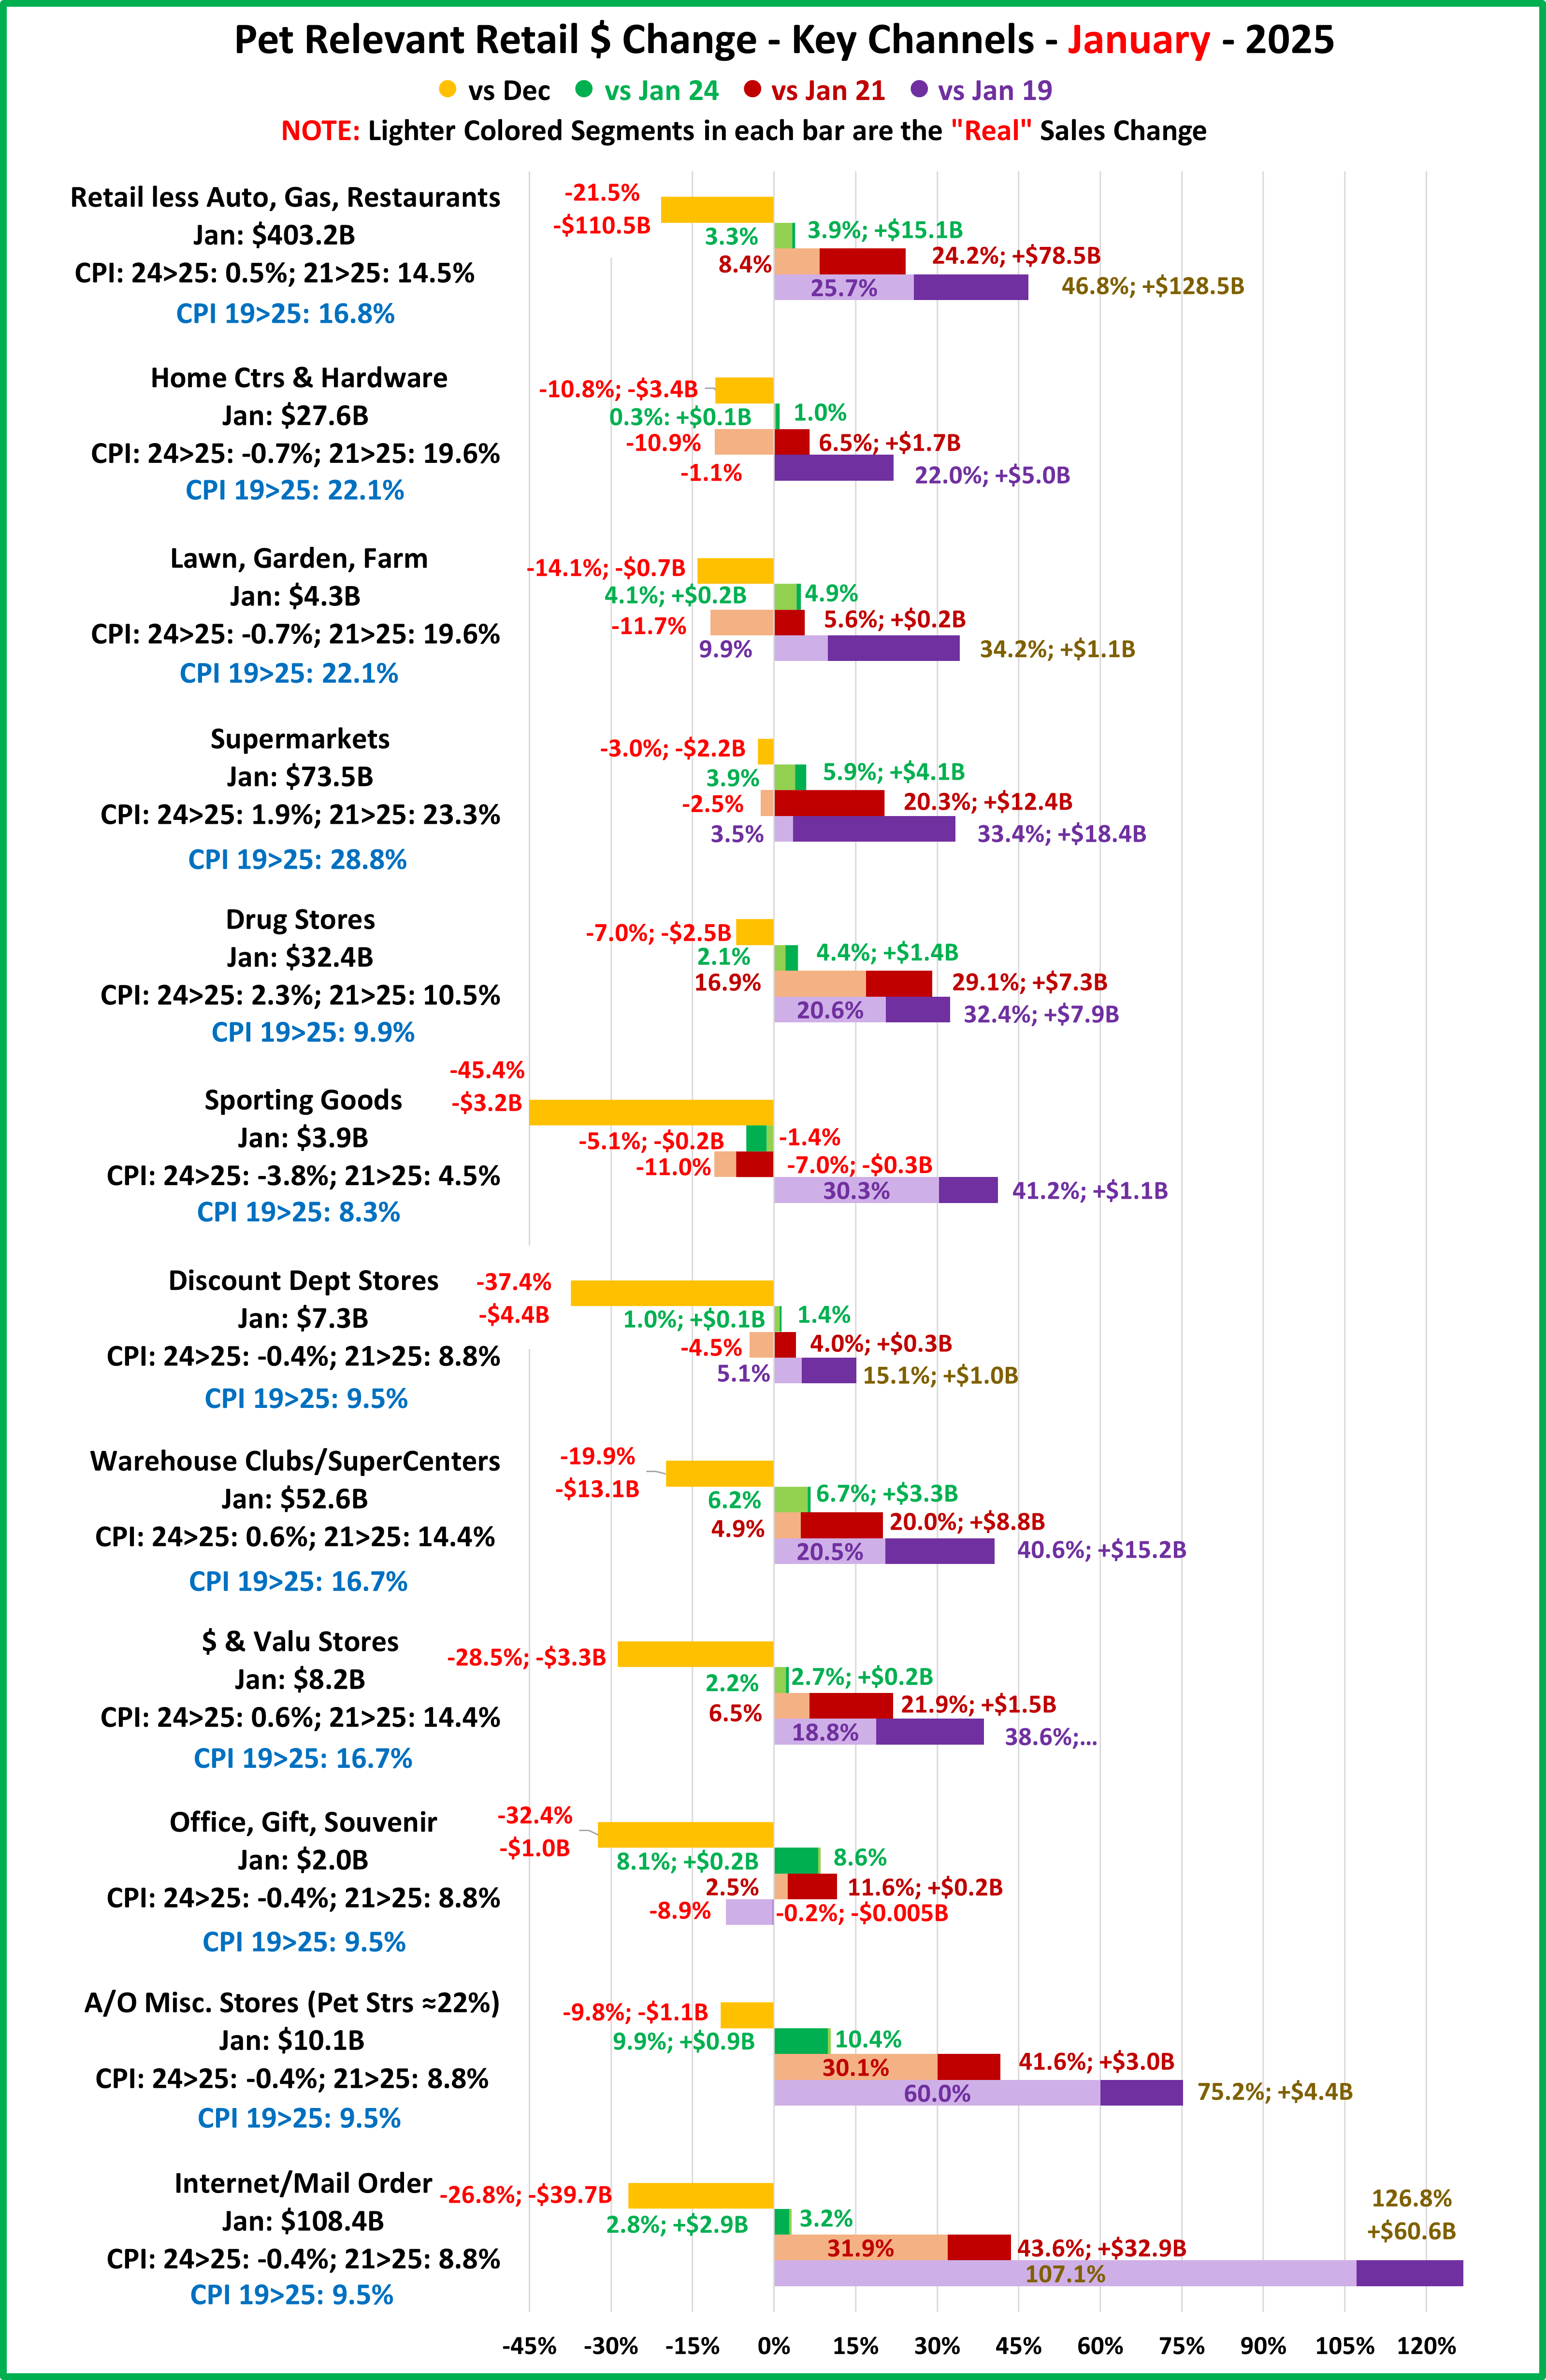
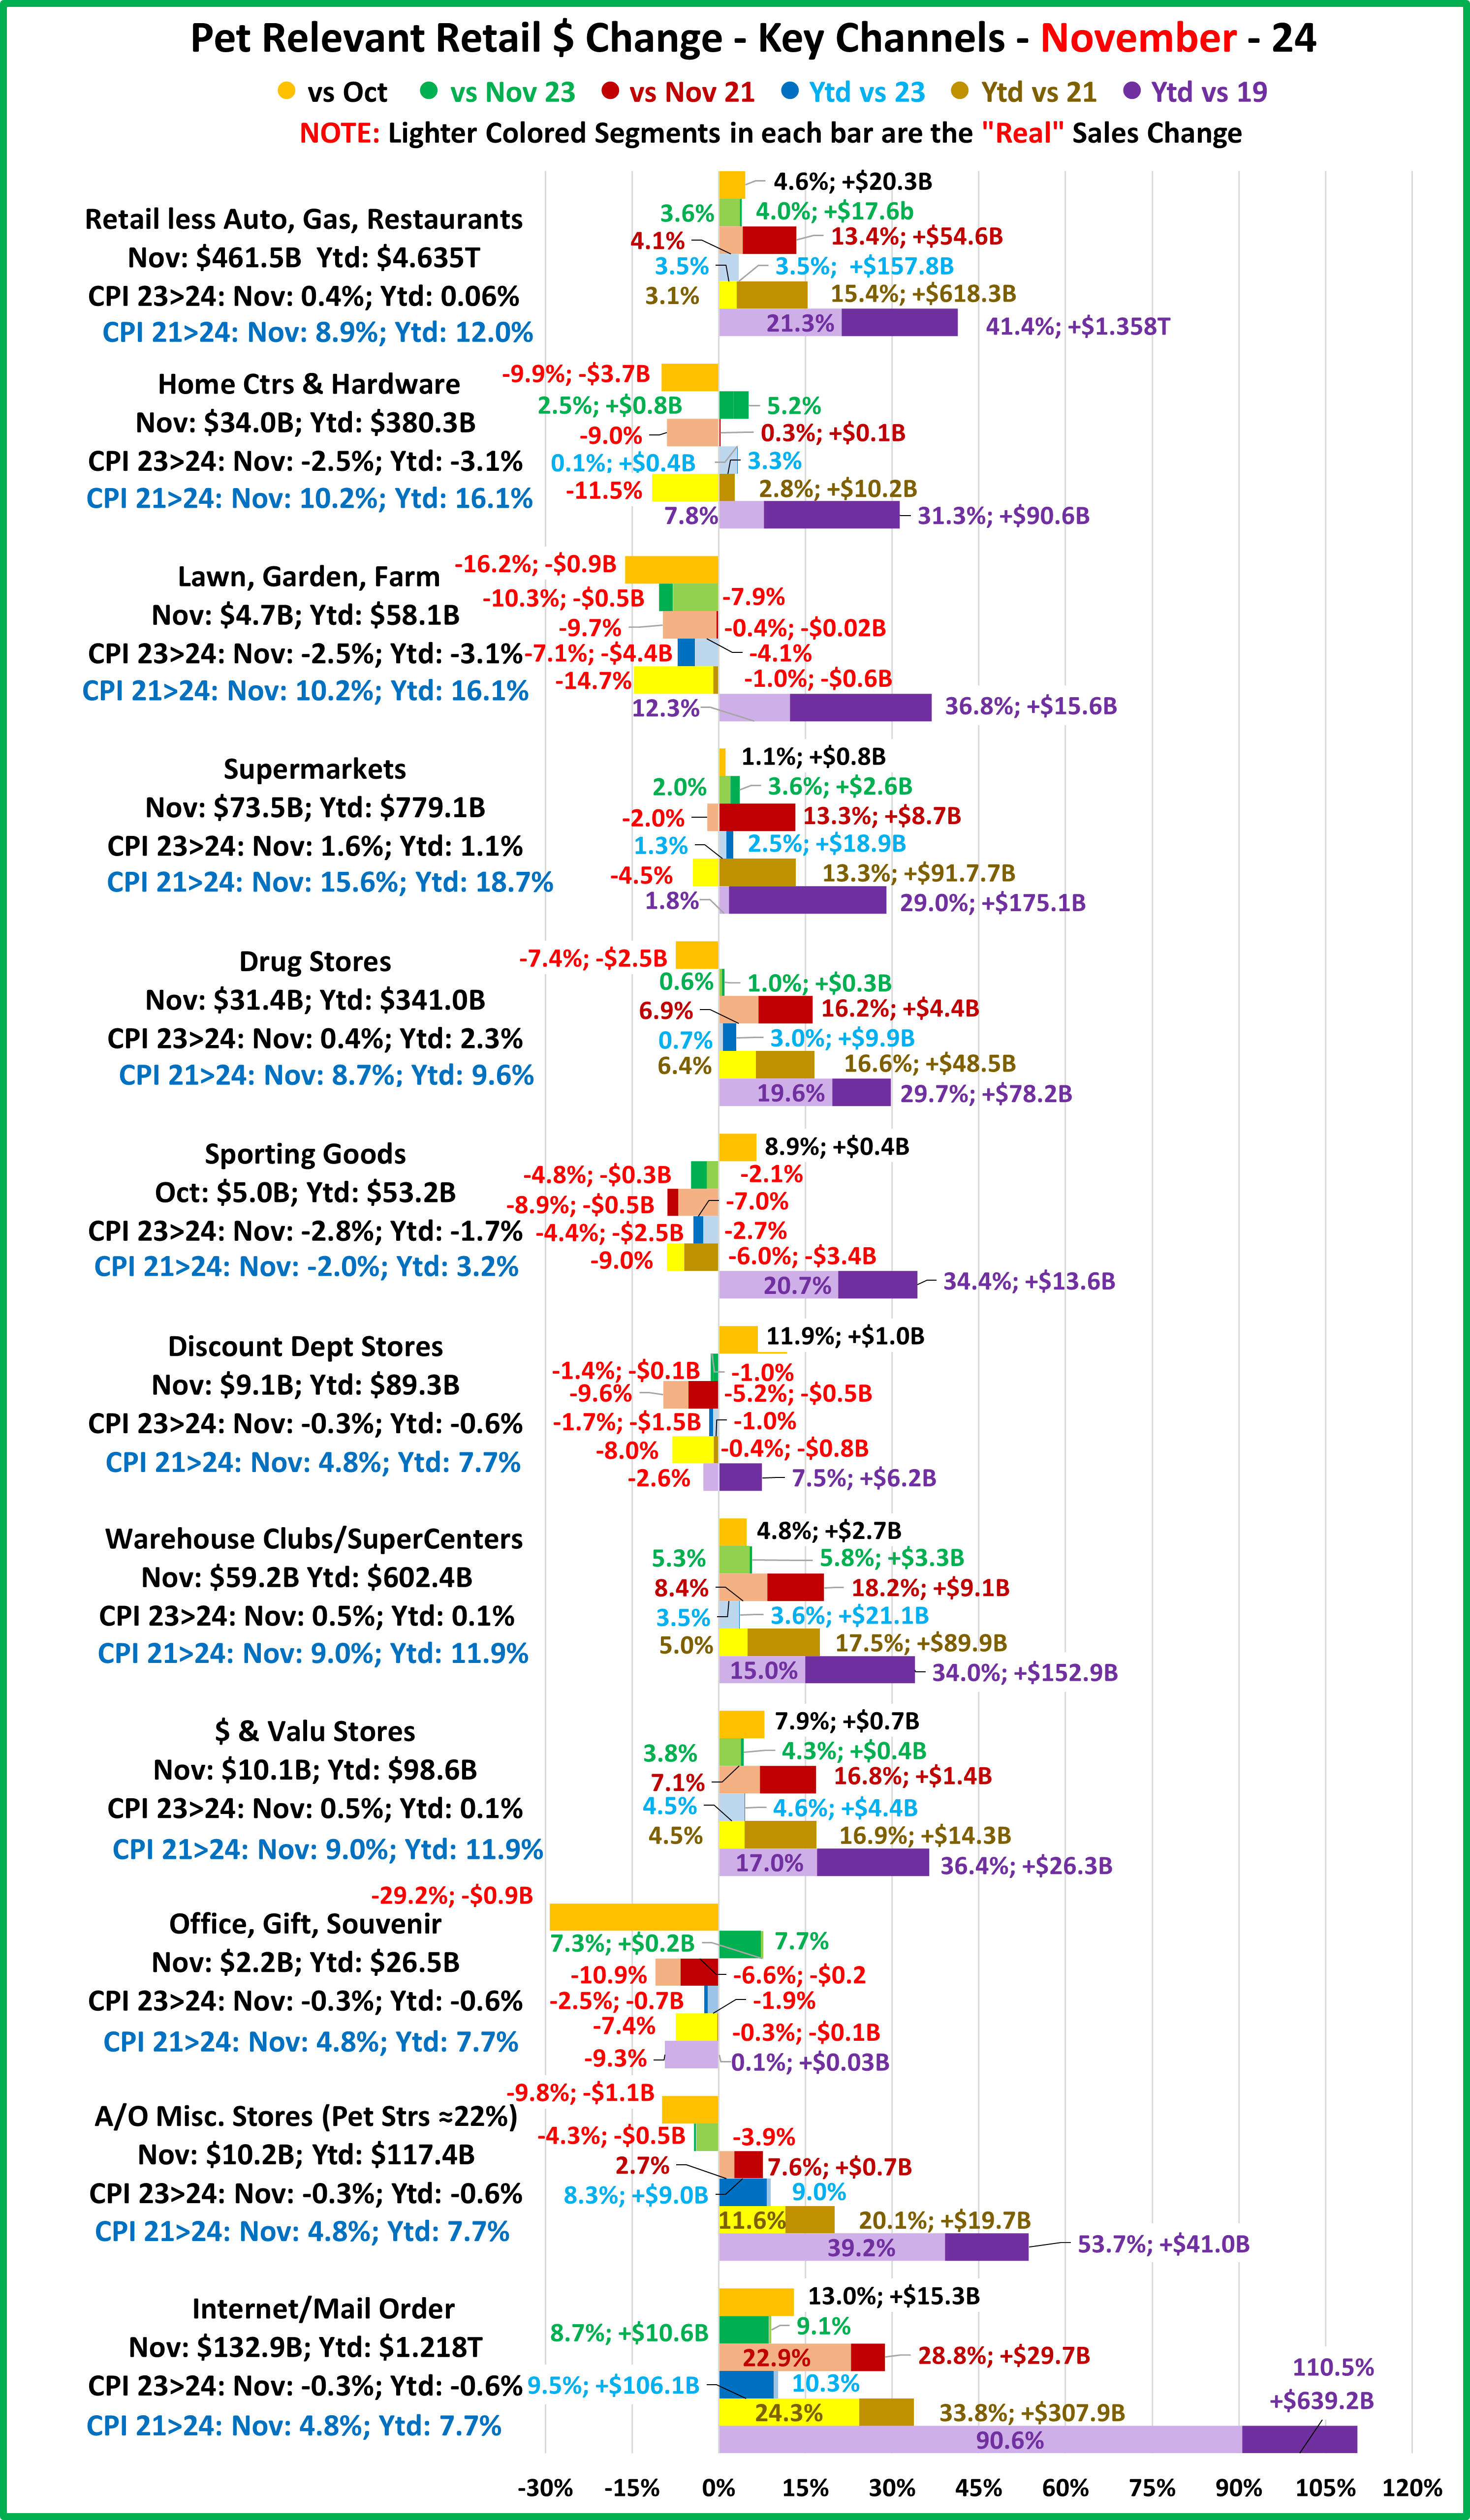
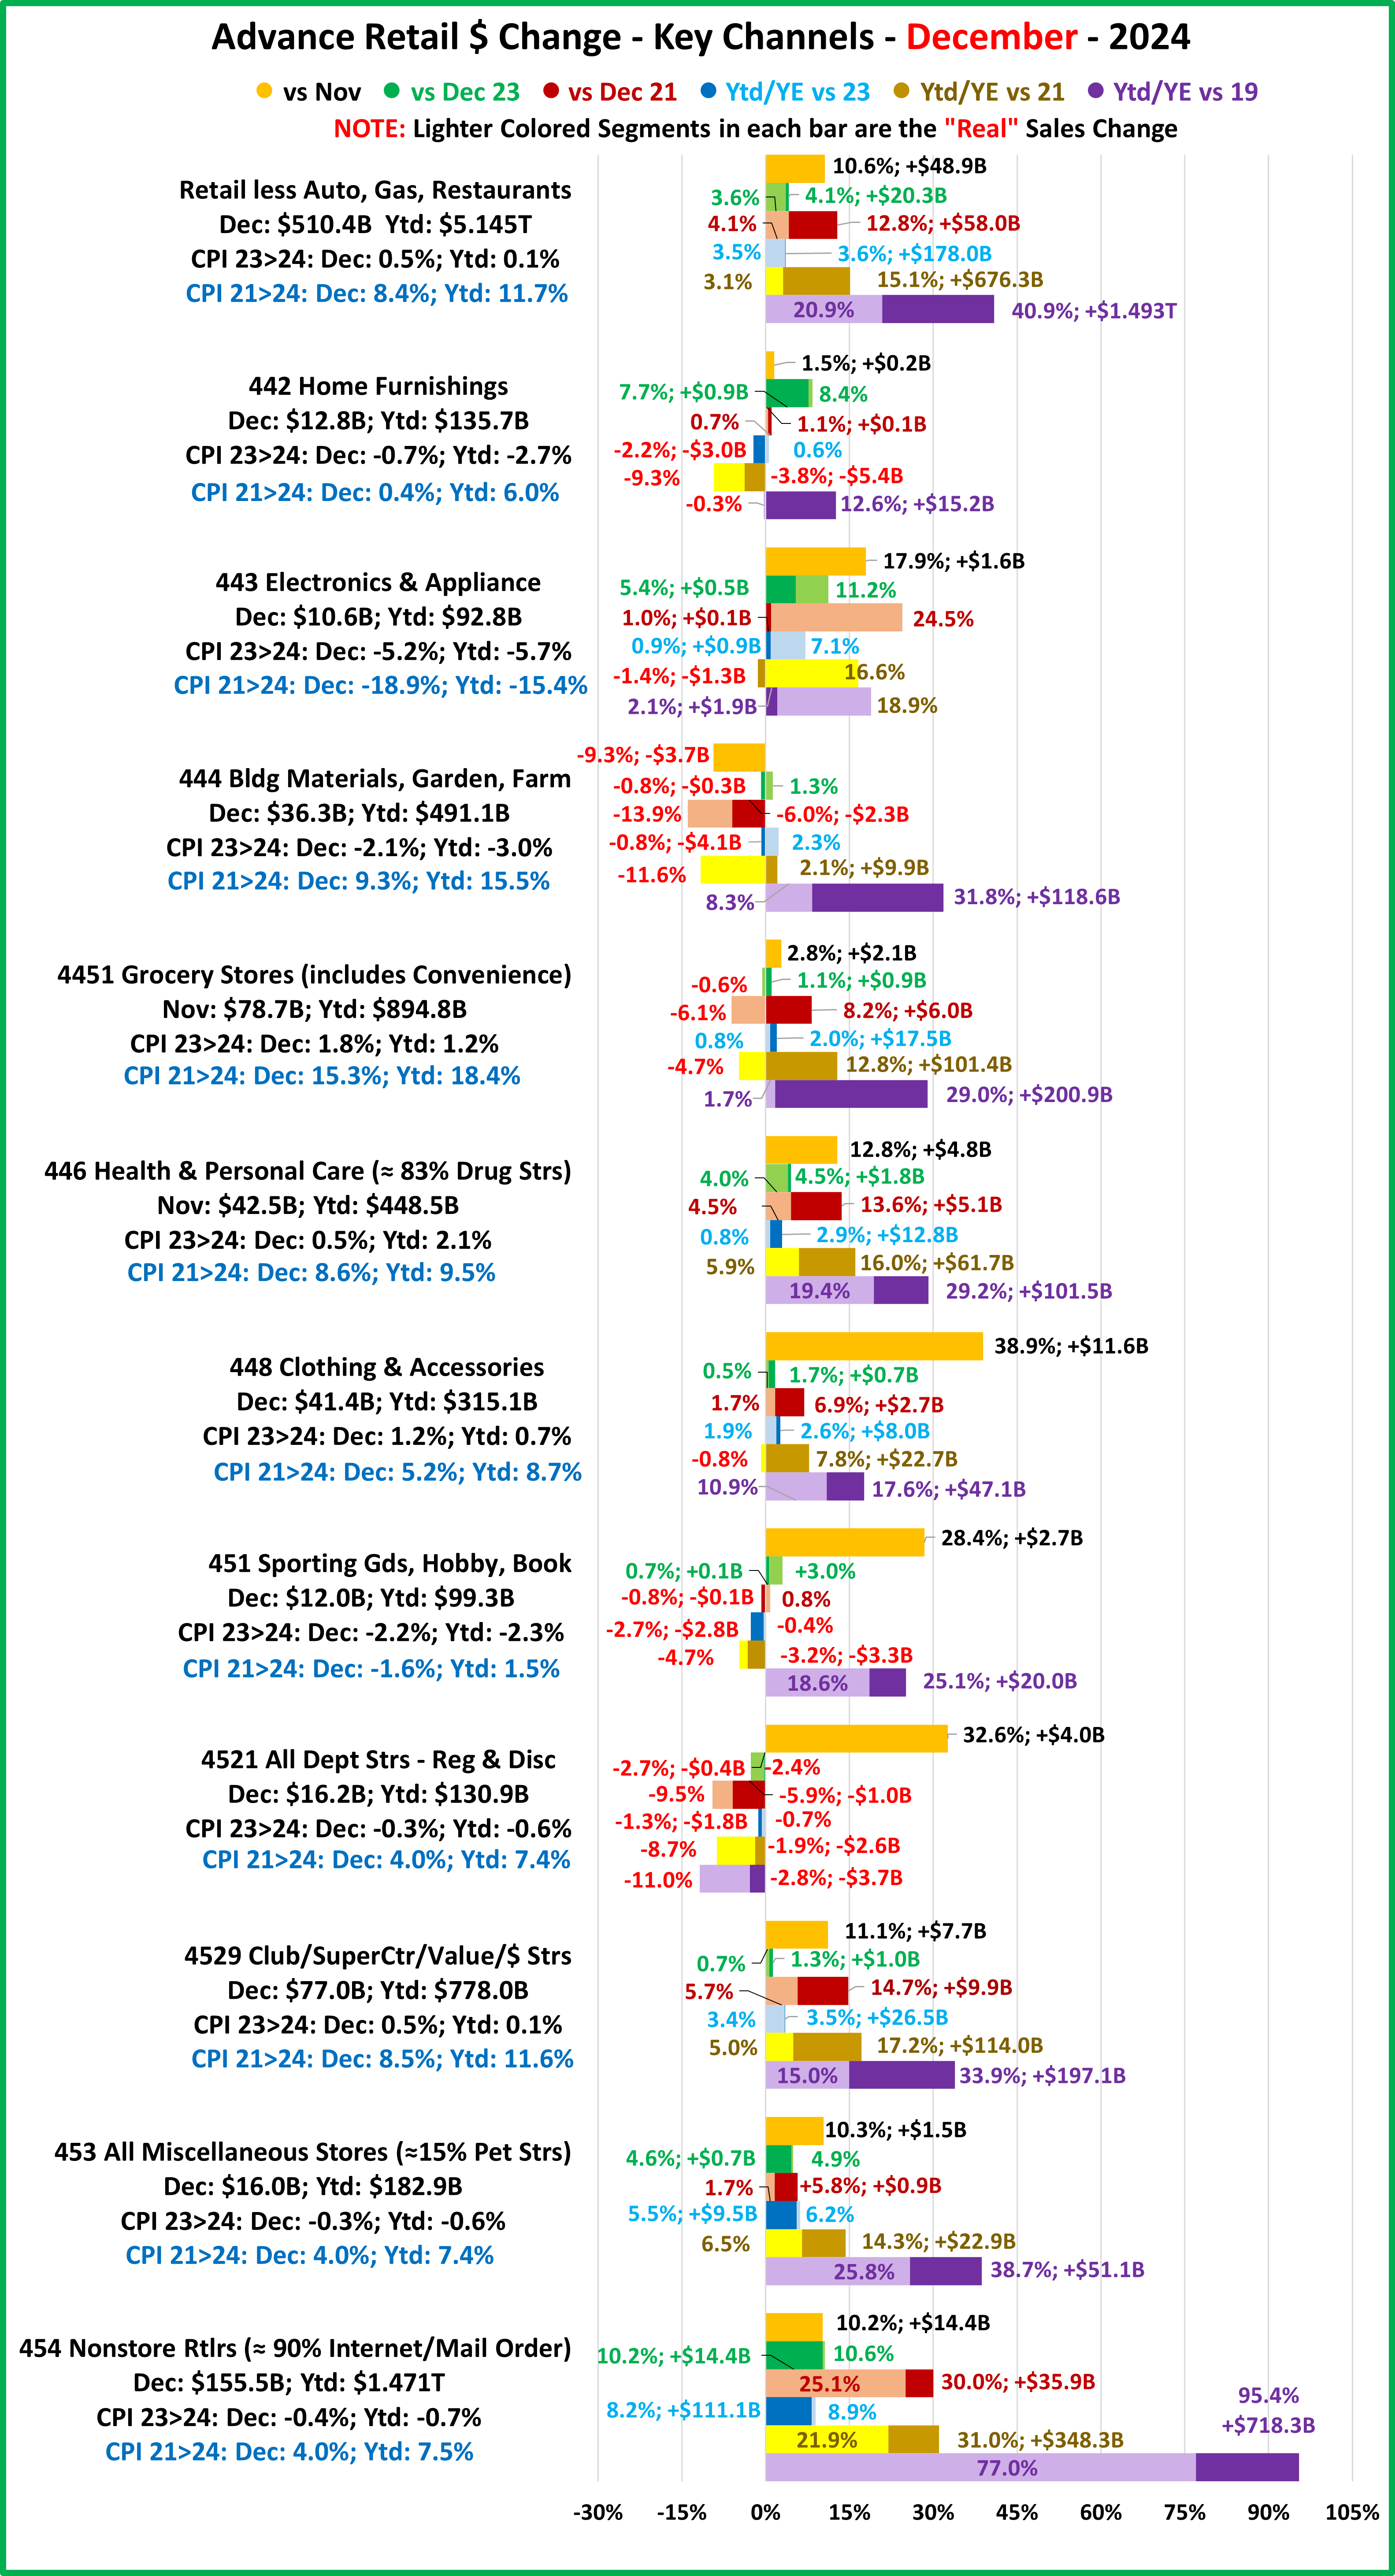
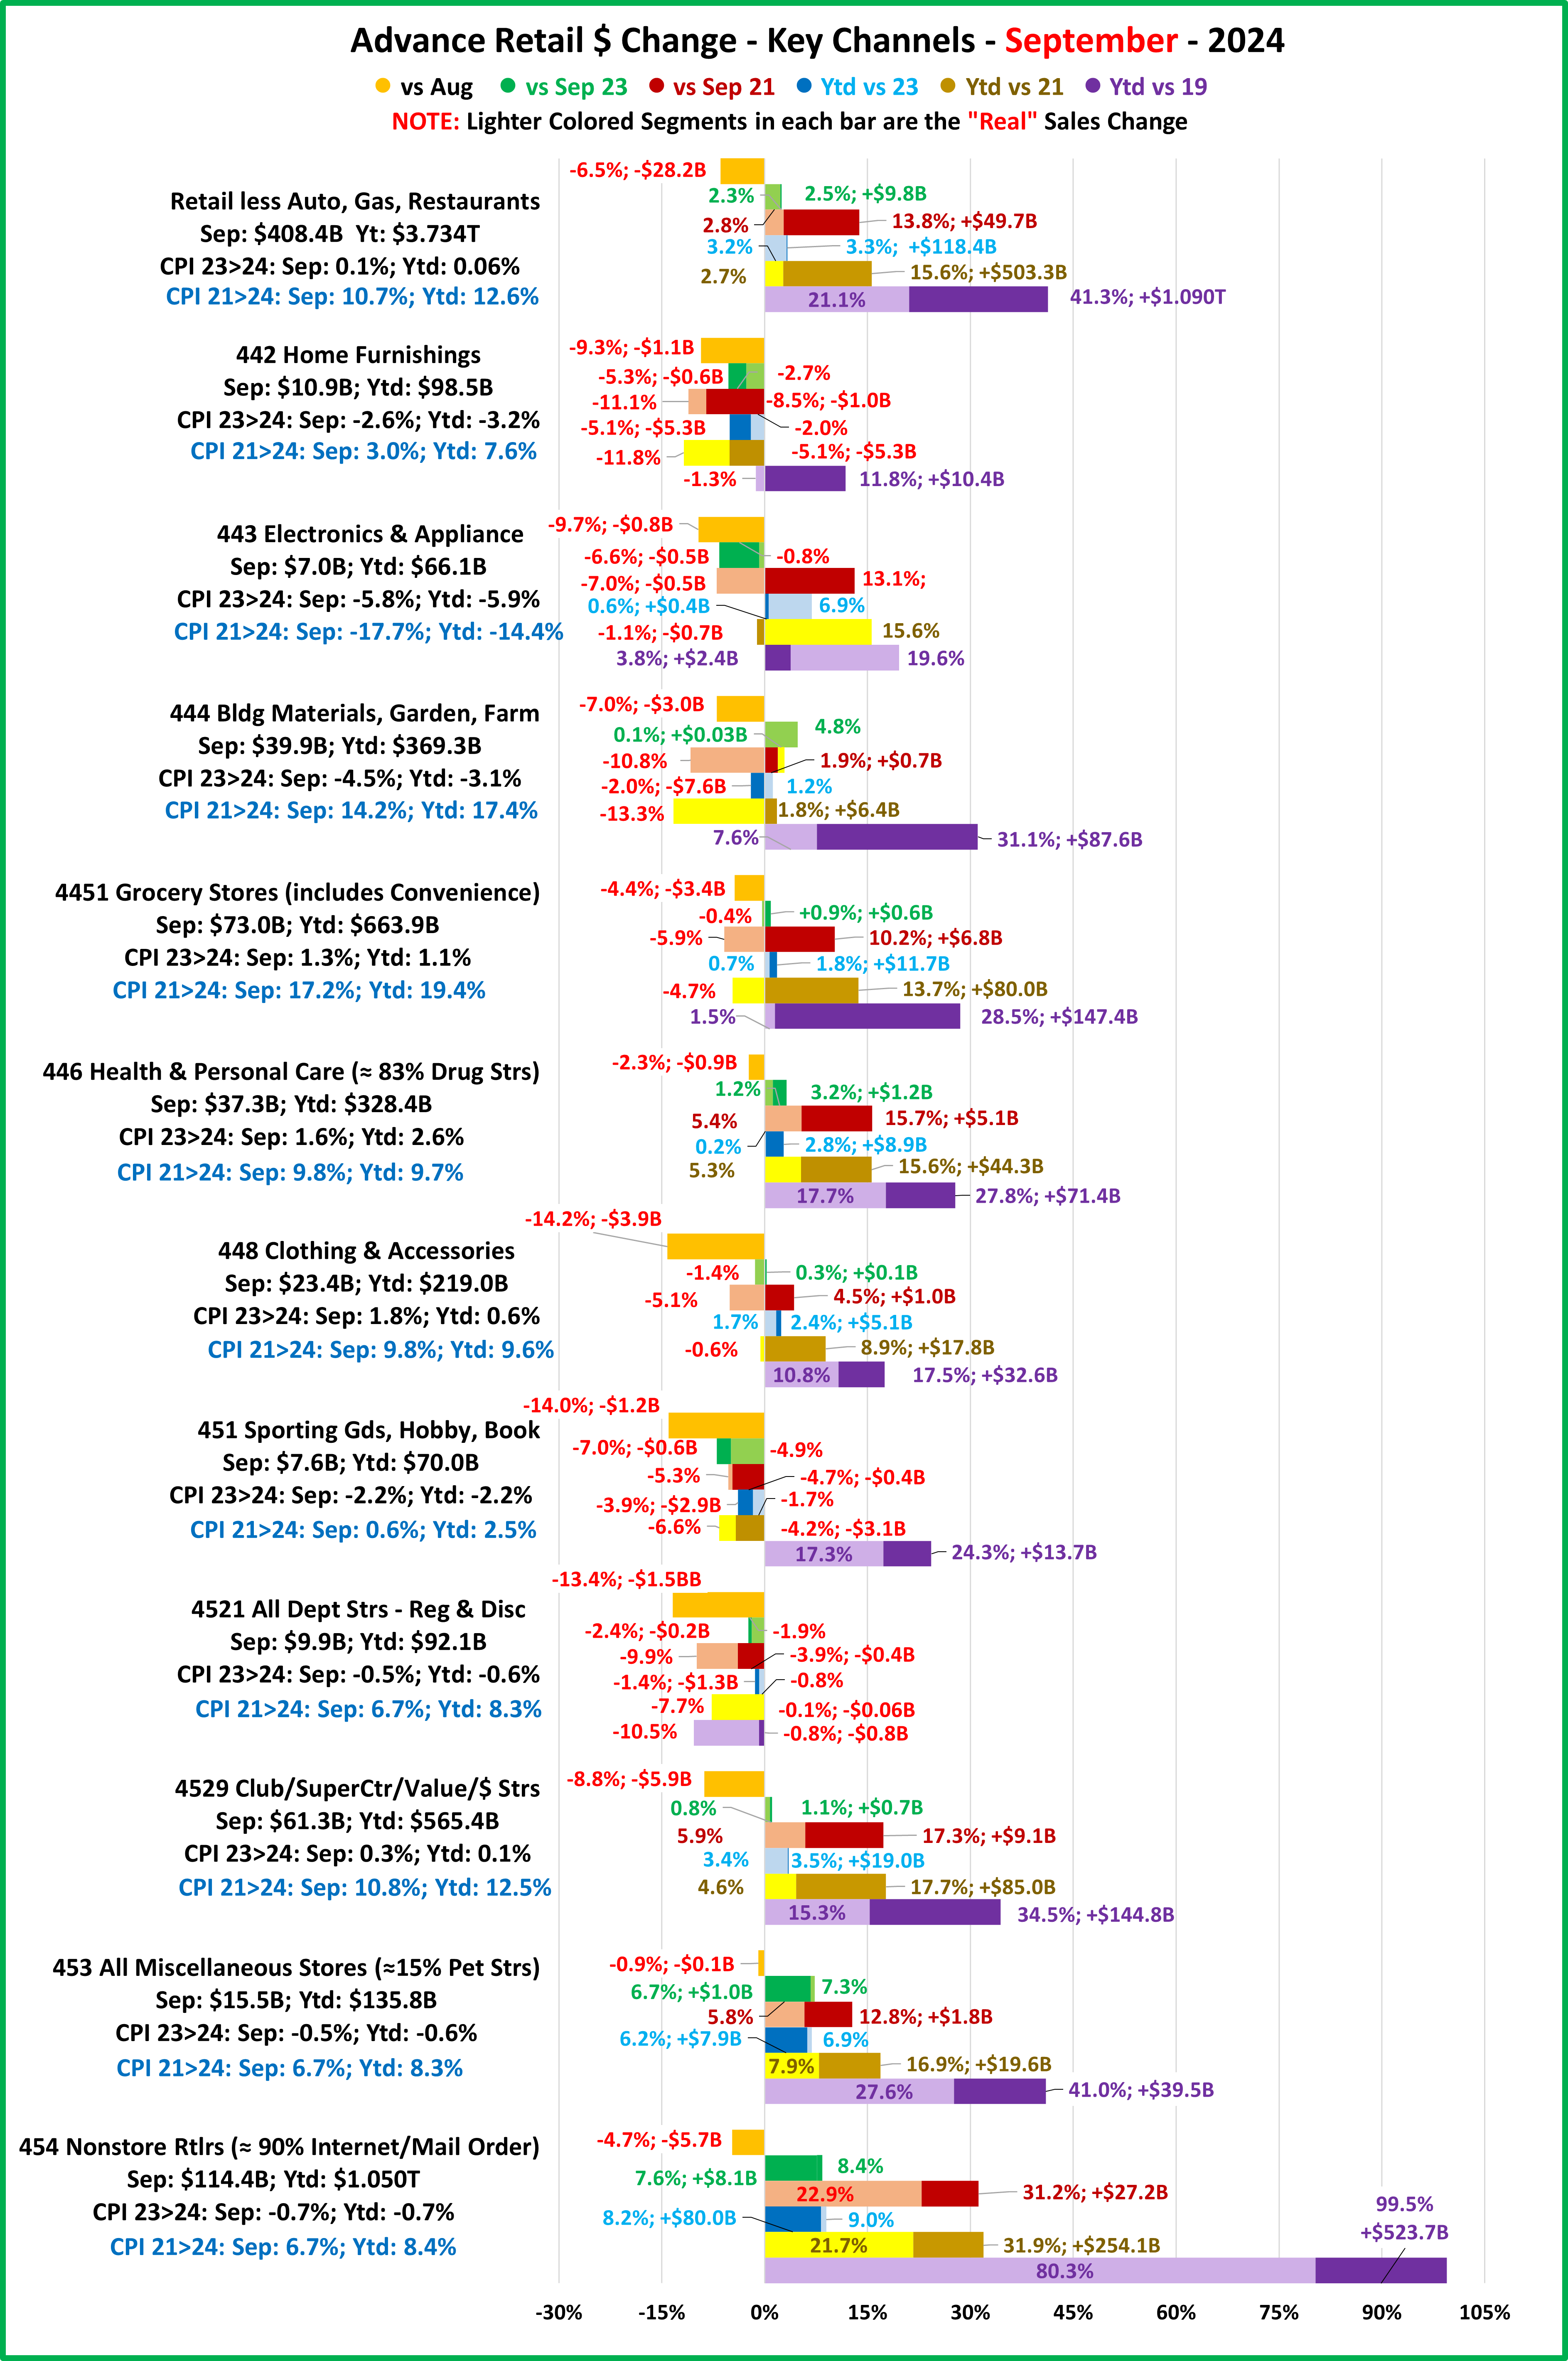
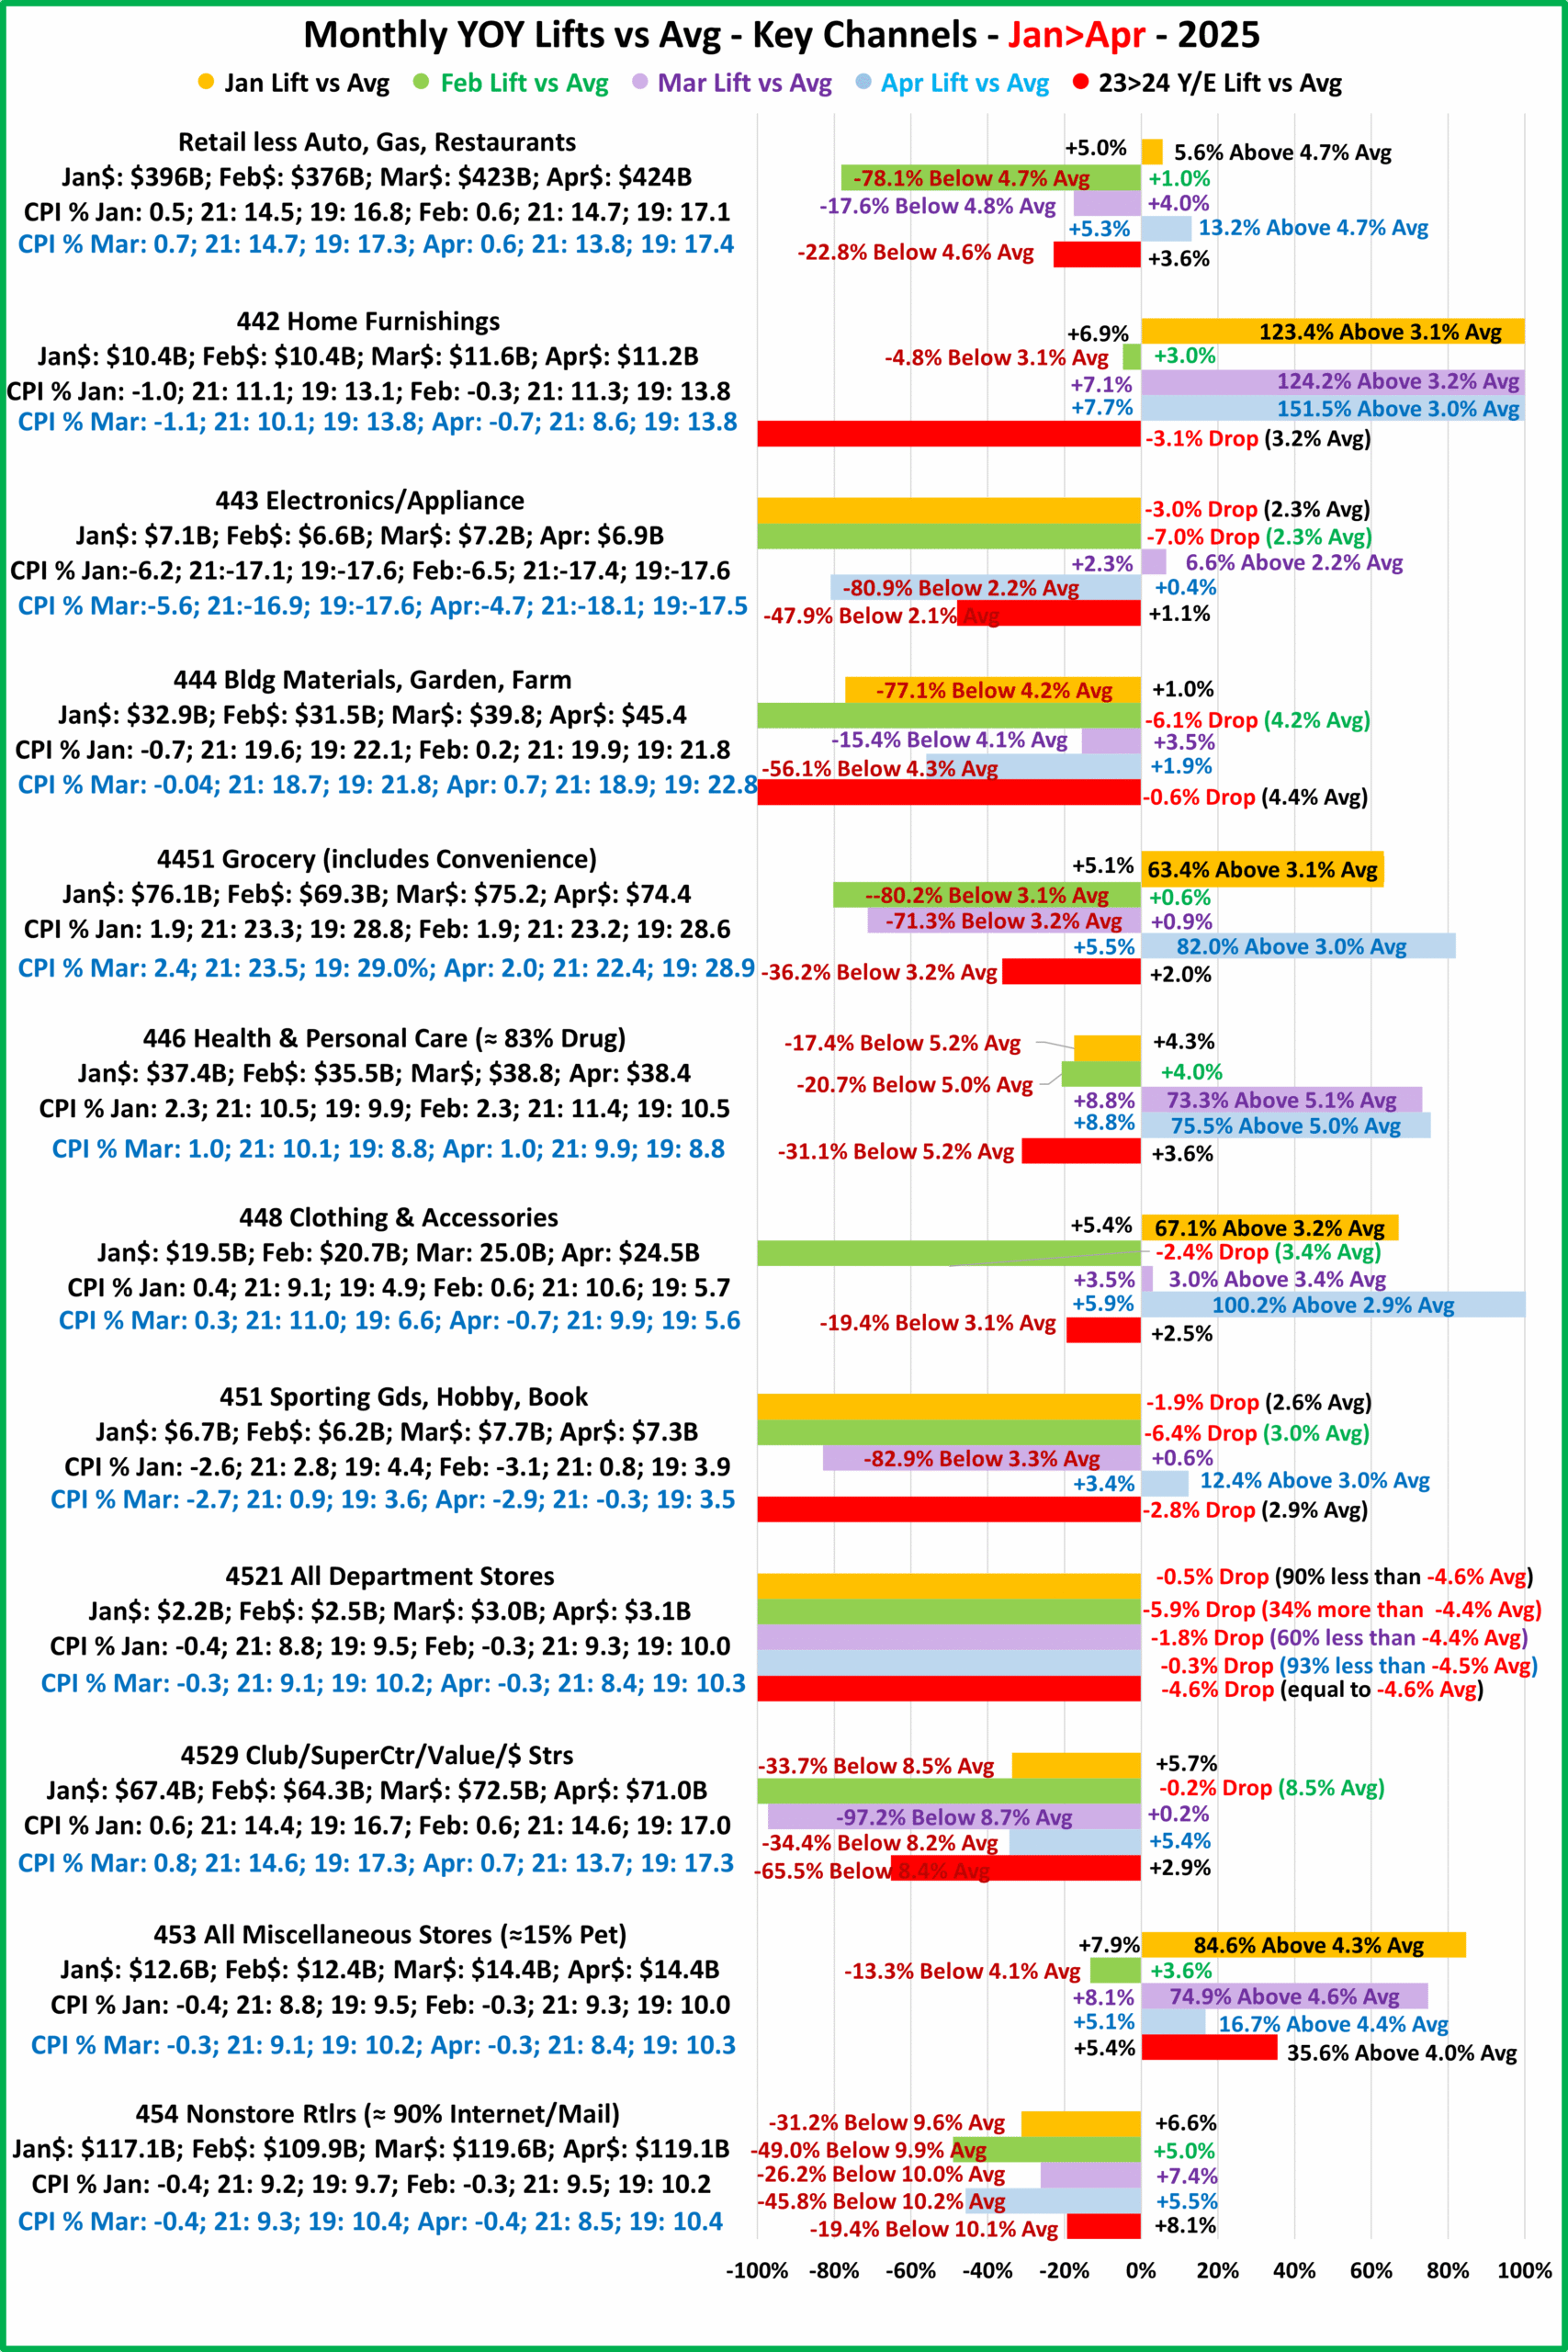
Now let’s take a closer look at Relevant Retail. We will report the same lift data for the 11 channels in our Advance Retail Sales report. They generate 98% of Relevant Retail $ so it is an accurate representation of this part of the Retail Market.

11 Relevant Retail Channels (98% of Ytd $)

Relevant Retail – Their +3.6% lift in 24 was -22.8% below average. No drops in 25. The lifts for February & March were below average but January & April were above average.

Furniture – No drops. Lifts were double the average in January, March and April. The big lifts in Mar>Apr were probably due to fear of skyrocketing prices from impending tariffs.

Electronics/Appliances – They have ongoing high deflation. $ Drops in both January & February. Sales turned positive in Mar>Apr but only the lift for March was above average.

Bldg Matl/Garden/Farm – They had the smallest of the 4 drops in 23>24, -0.6% but the 3rd biggest decrease in February, -6.1%. They had lifts in Jan, Mar & Apr but all were below average. This includes their normal Spring lift. The April increase was -56% below average. Cumulative 20% inflation was undoubtedly a factor.

Grocery – Sales were only +2% in 24, -36% below average but they surged in January to +5.1%, 63% above average. Growth slowed to less than 1% in Feb>Mar, over 70% below average. However, they had a strong rebound in April. Sales were +5.5% vs 24, 82% above average.

Health/Drug – Sales were +3.6% in 24, -31% below average. The lift grew slightly in Jan>Feb to 4+% but it was still about -20% below average. Sales surged in Mar>Apr to +8.8%, 73+% above average.

Clothing – They had a slow 24, +2.5%, -19% below average, but started 25 strong, +5.4%, 67% above average. Then sales fell -2.4% in February. In March the lift exceeded the average by 3% but they “took off” in April to +5.9%, more than double the average lift. Like Furniture, the big April lift was likely due to fear of impending tariffs.

Sport/Hobby/Book – They were -2.8% in 24. This trend continued in Jan>Feb, peaking at -6.4% in February. In March they turned slightly positive, +0.6% but this grew in April to +3.4%, 12% above average – a big turnaround.

Department Strs – It’s difficult to find something positive. They were -4.6% in 24 had drops Jan>Apr in 25. The biggest drop was -5.9% in February – no surprise. Sort of good news: 3 of drops were 60+% less than average.

Clubs/SupCtrs/Value/$ – They offer Brick ‘n Mortar value and the convenience of 1 stop shopping. They have had strong growth since their creation in the 80’s. COVID further accelerated growth so it is no surprise that all lifts are below avg. They even had a small -0.2% drop in February. Things slightly improved in March, +0.2%, then rose to +5.4% n April.

Miscellaneous – Pet Stores account for 15+% of this group’s sales. They had a -13% below average lift in February. All other measurements  were above average, and their lifts peaked at +8.1% in March. They have the best performance of any channel, even Furniture Stores, and they did it without the benefit of a pre-tarifflation buying surge.

Nonstore – 90% of $ are from internet/mail order (vast majority is internet). The Internet has had strong sales growth since its inception, but it skyrocketed due to COVID’s “stay at home” behavior. They have an average lift of about 10%. Their 24 lift was +8.1%. All lifts in 25 were below this and below average – no surprise. Low: Feb +5.0%; High: Mar +7.4%

SUMMARY

23>24 – Drops: 4; Below Avg Lifts: 6; Above Avg Lifts: 1

25 Jan – Drops: 3; Below Avg: 4; Above Avg: 4                 25 Feb – Drops: 6; Below Avg: 5; Above Avg: 0

25 Mar – Drops: 1; Below Avg: 5; Above Avg: 5               25 Apr – Drops: 1; Below Avg: 4; Above Avg: 6

In the above Summary, regarding Drops and Above Average lifts, green indicates the best and red is the worst. Obviously, the best month is April and the worst is February. However, the biggest positive change occurred in March. 5 channels with drops turned positive. 3 became below average and 2 above average. 3 with below average lifts moved up to above average. The classification of 3 was unchanged so 8 fueled the improvement. April was only a little better than March as 1 below average moved up. However, we should note that now more than half of the channels are above average. We also can’t forget January. There was only a slight improvement in the number of positive lifts vs Y/E 24, from 7 to 8 but the number with above average increases rose from 1 to 4 – a significant change. The situation has definitely improved since hitting bottom in February. The CPI is still low and impending tariffs have not had a significant negative impact.

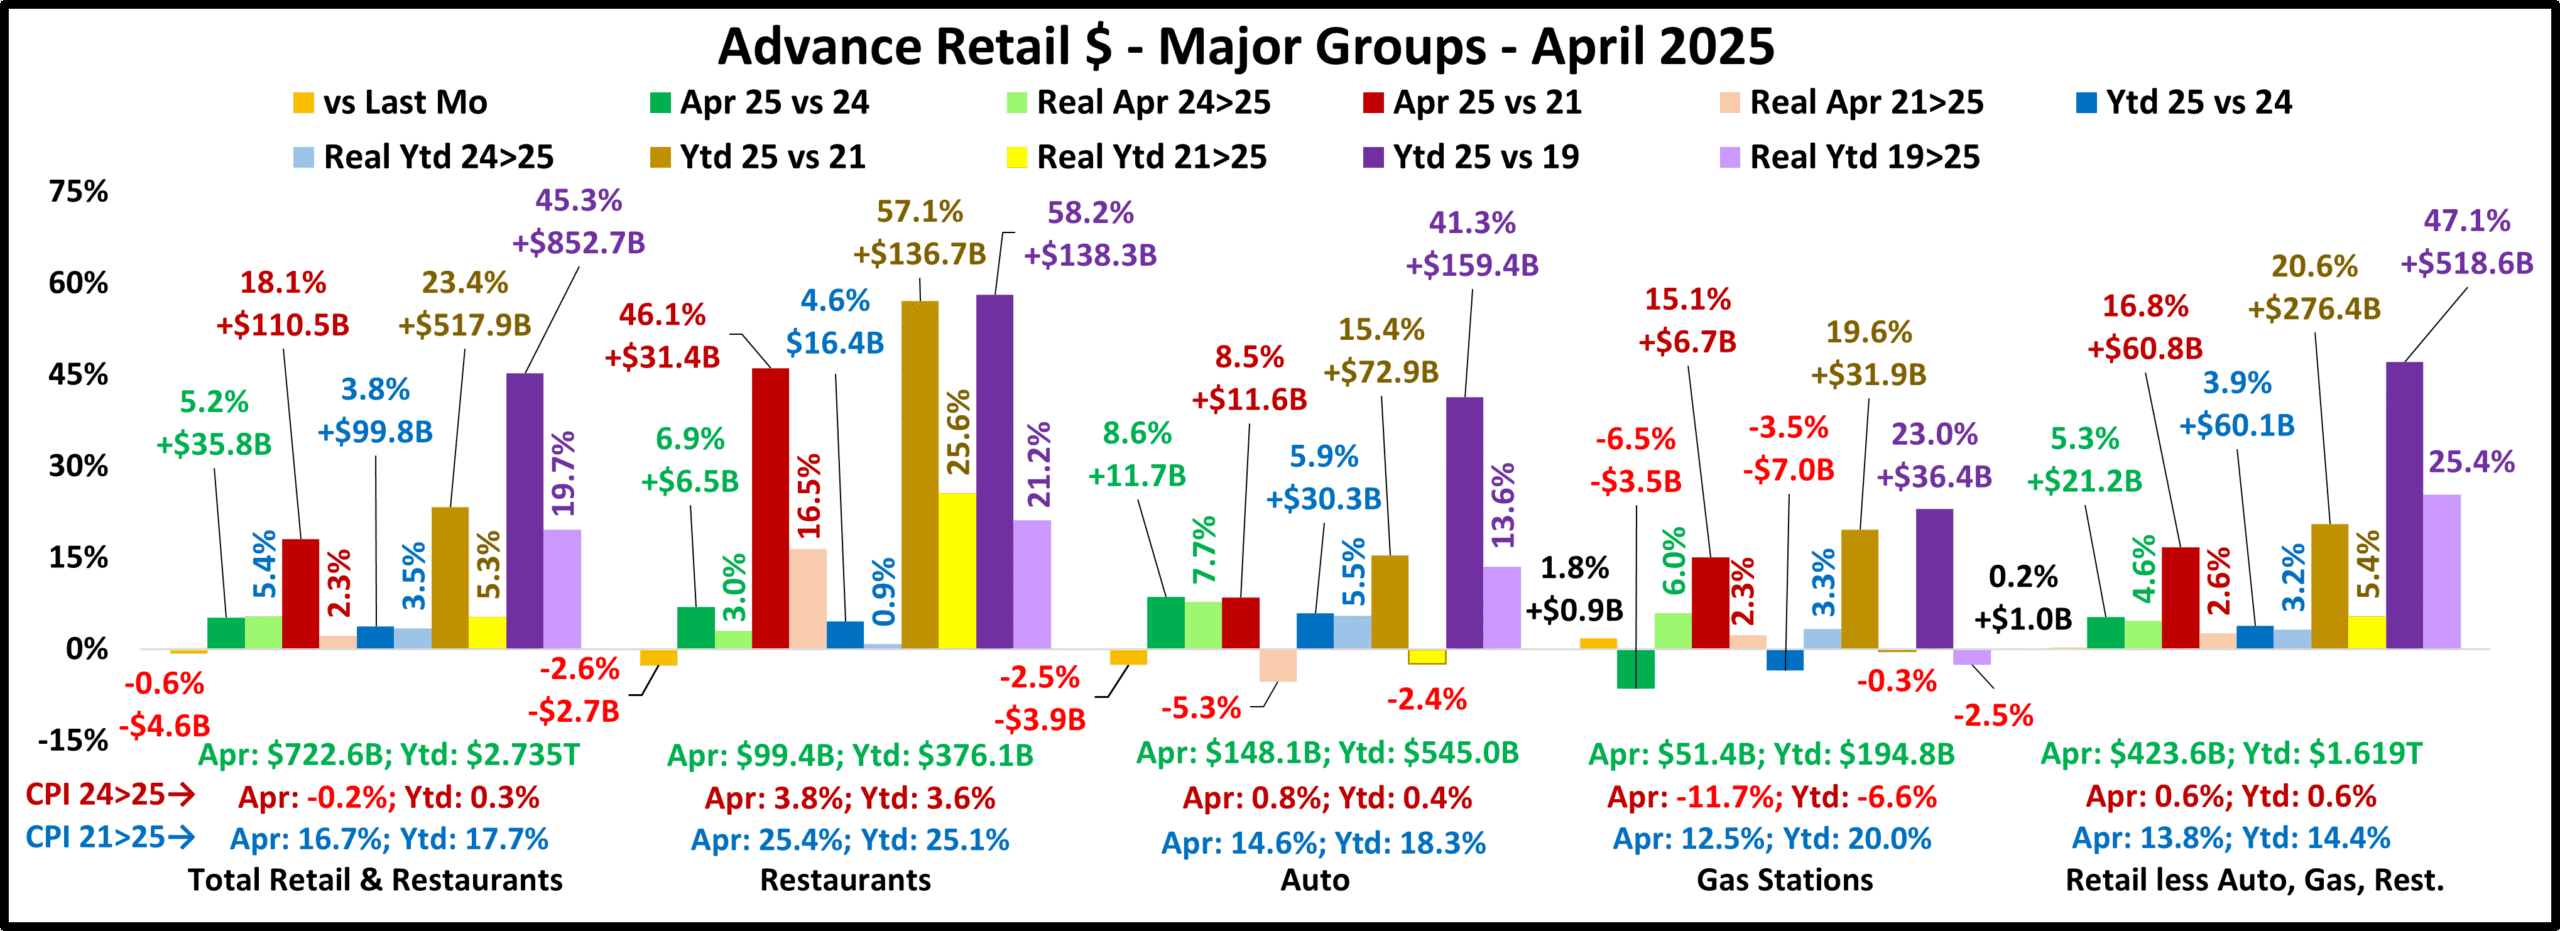
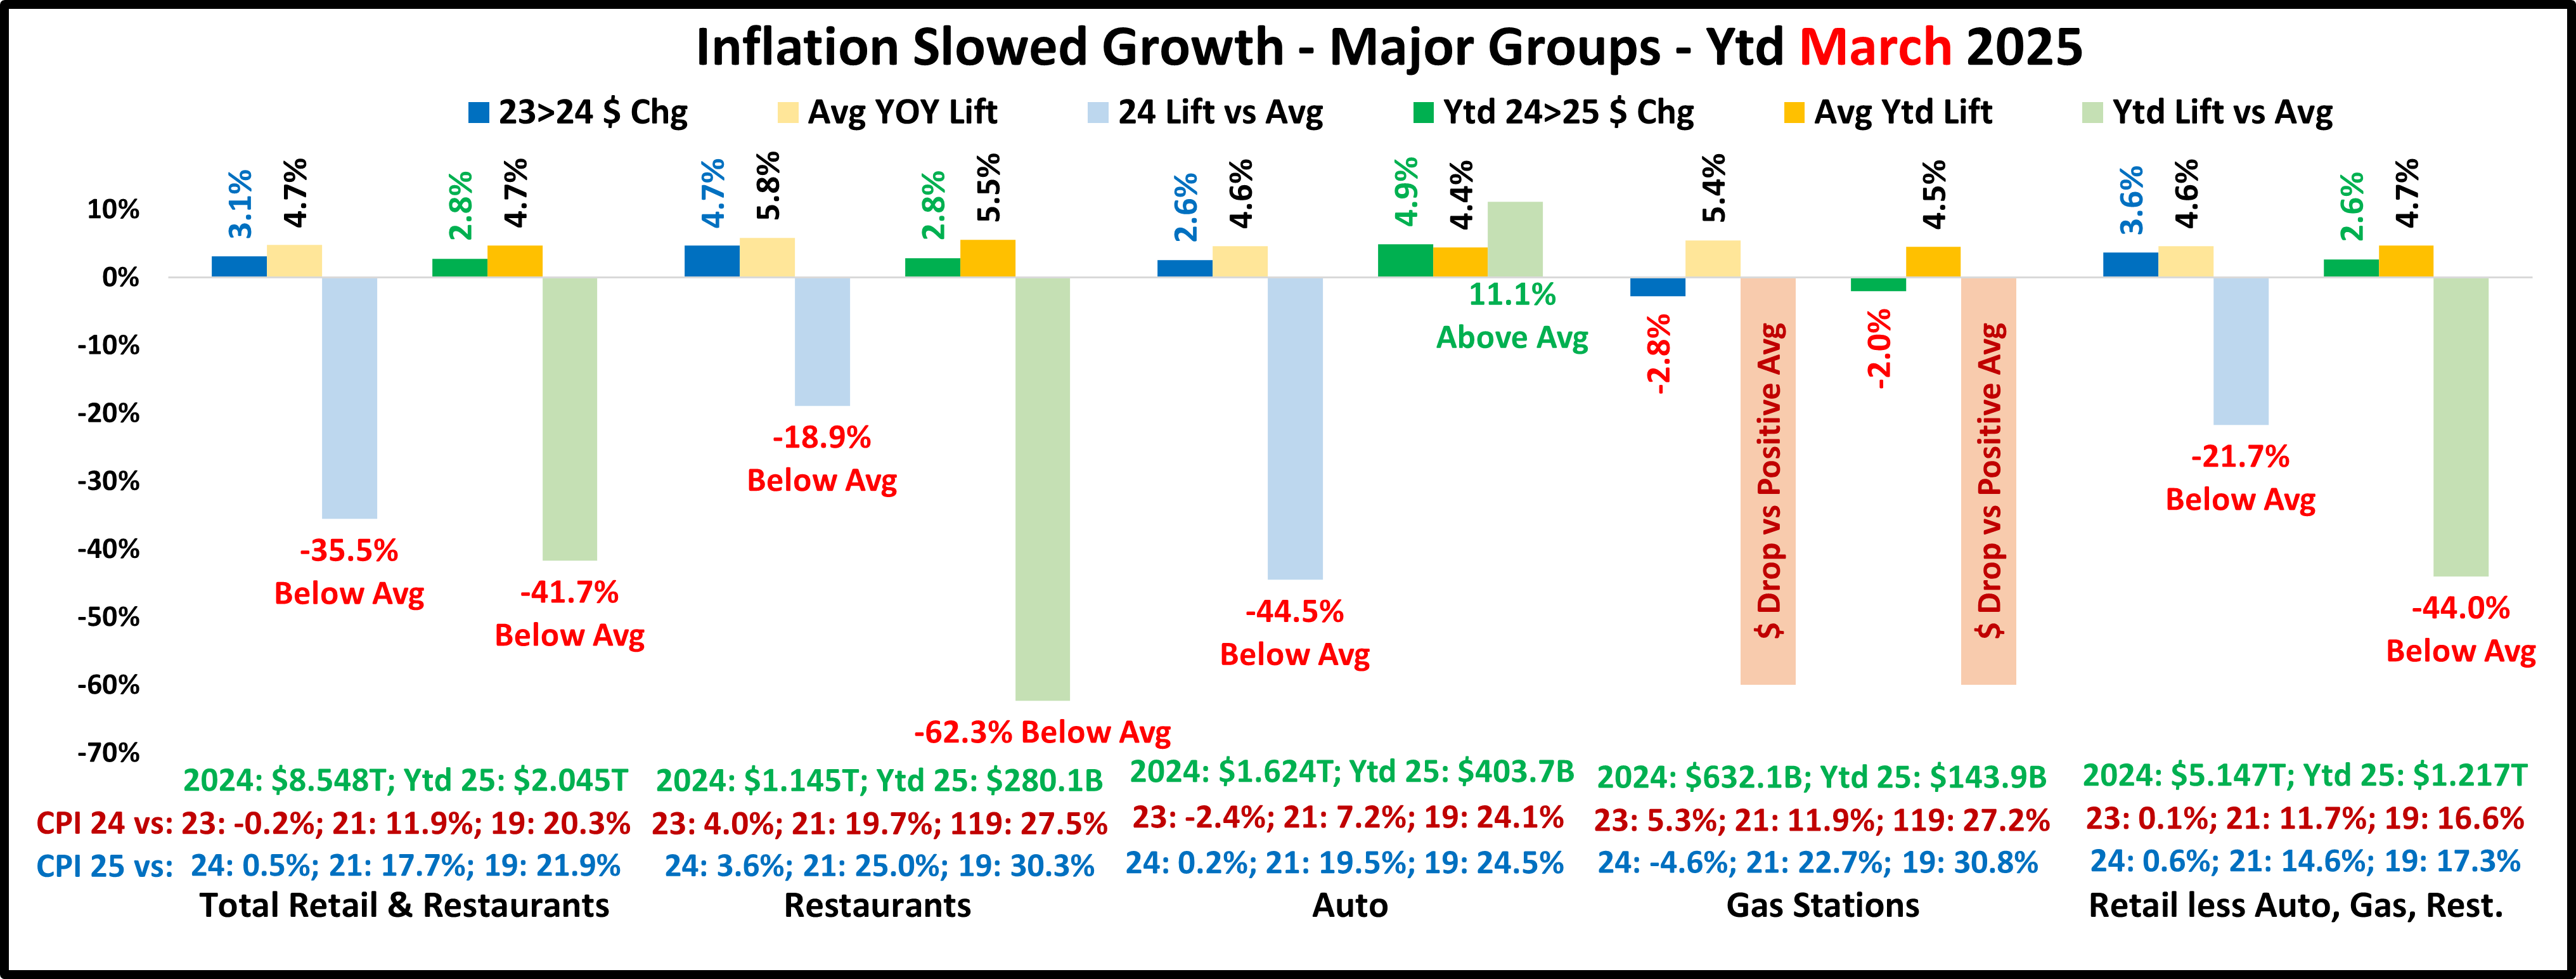
Now let’s take a different view of the data from the Big Groups and the same 11 channels. Rather than monthly sales, we we look at Ytd numbers. We will still view them monthly so we can see any trends.

The Ytd numbers are arguably the most important. In December, they become Year-End, which is the most quoted and remembered data in any year. While the monthly data shows what’s happening in the marketplace right now, the Ytd data consolidates the data. This blending reduces the impact of sales spikes – positive or negative. This can be either good or bad. The impact of the big drop in February 25 was lessened by the widespread Above Average January lift. It can also work the other way. The big February drop is still reducing the positivity of strong lifts in March and April. We’ll begin our analysis with the Big Retail Groups.

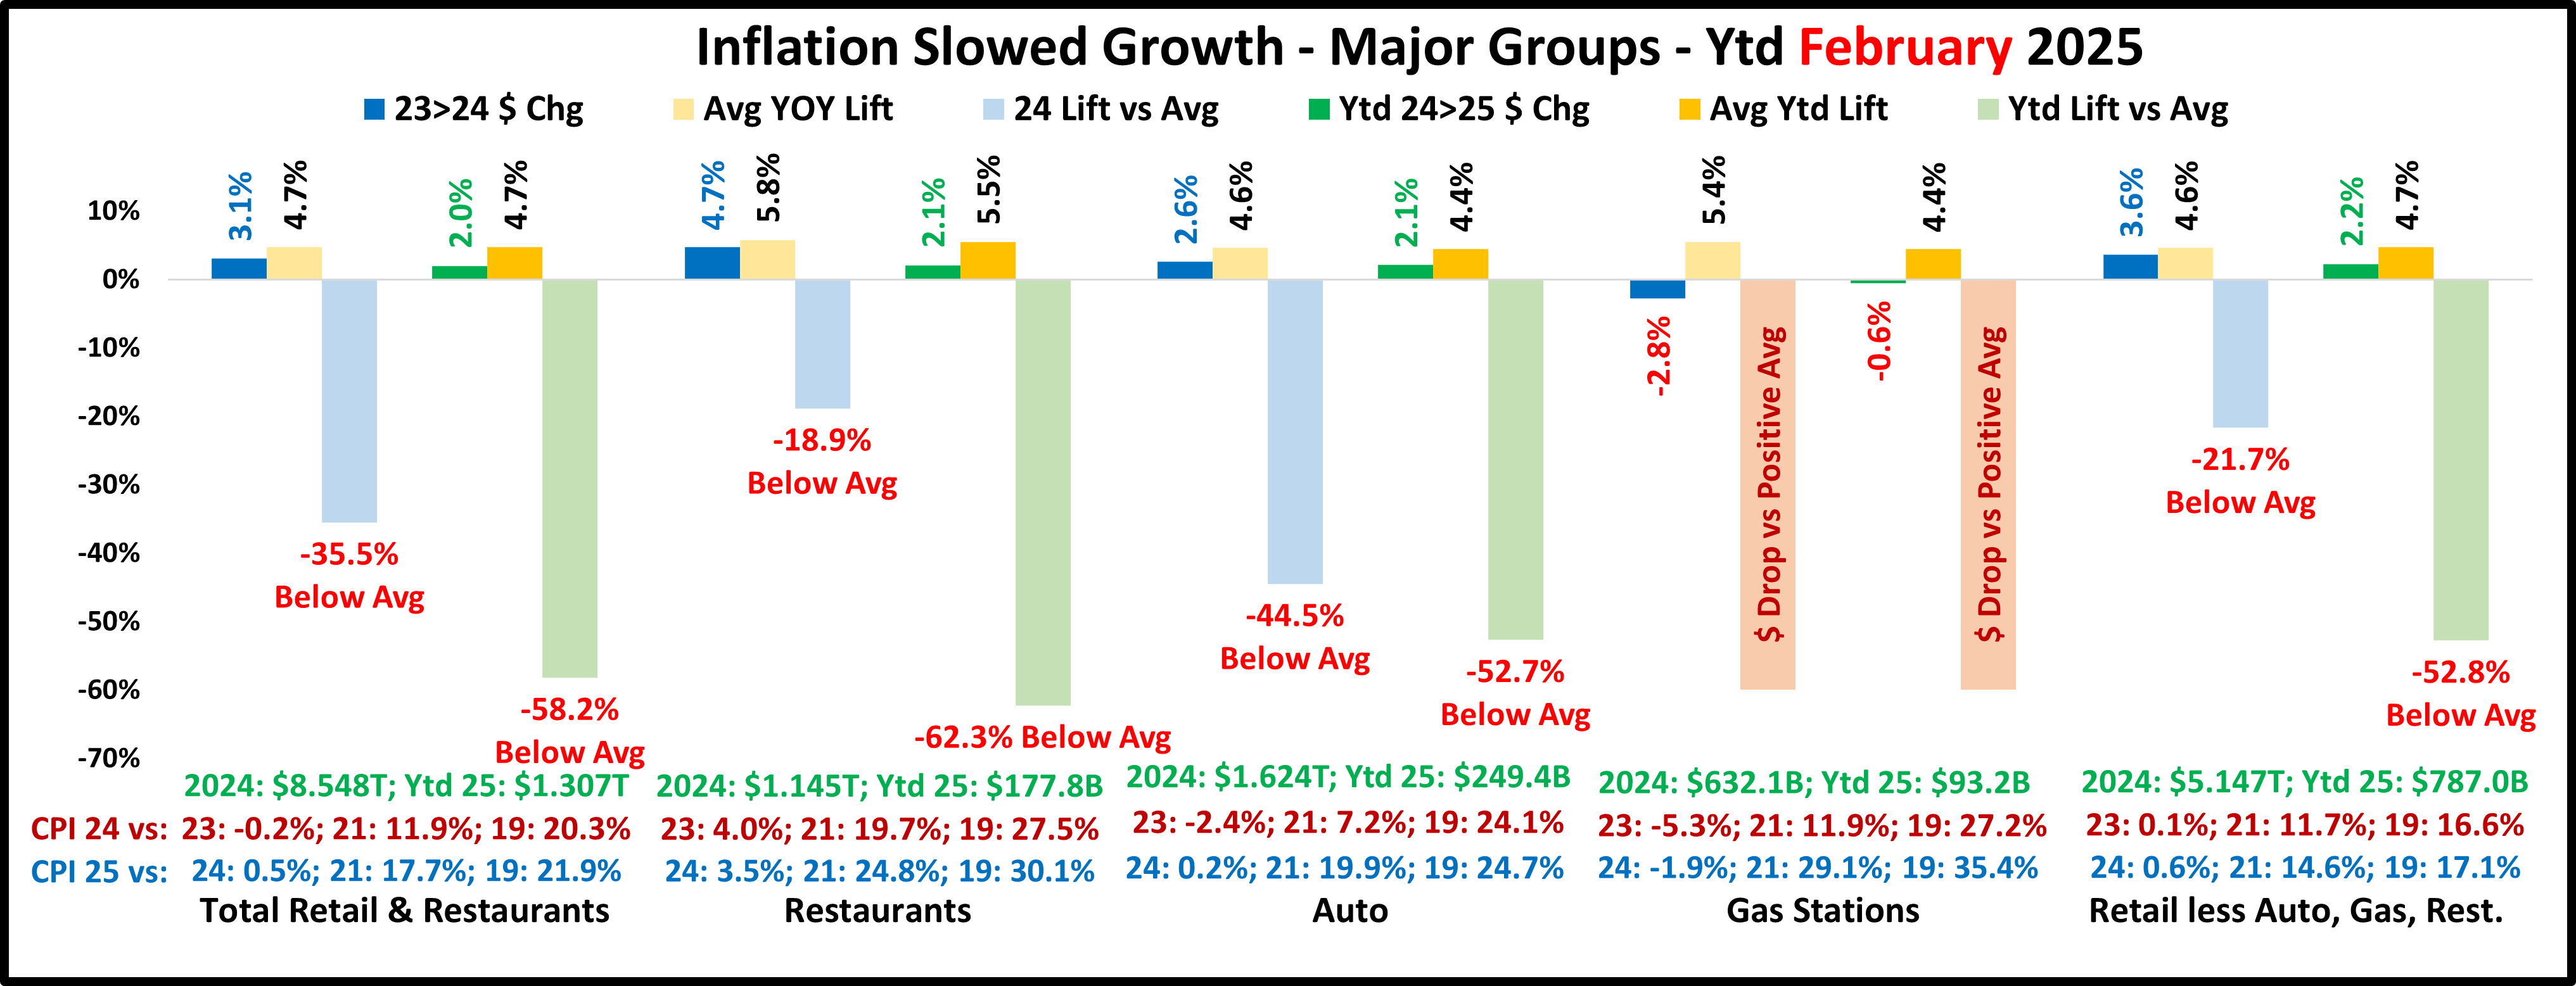
The first thing that you notice is that the spending patterns for Restaurants and Relevant & Total Retail are virtually identical. All groups had January lifts and all but Gas Stations were Above Average. However, only Auto had Above Average lifts in either March or April. Also, only Gas Stations had any sales drops.

Restaurants – Sales for 24 were +5.2%, -7% below average. They flipped in January as the lift vs last year grew to +5.7%, 5.5% above average. The lift radically slowed in February to +2.4%, -57% below average. The situation steadily improved in March & April as the YOY increase grew to +4.6%, -18% below average.

Auto – Sales were +2.3% in 24, -47% below average and the worst “positive” performance of any group. They turned it around in January with a +5.8% lift, 32% above average. The lift dropped to +2.0% in February, -55.5% below average and the smallest lift of any positive big group. Thanks to pre-tarifflation buying the YOY lift took off in March & April, reaching +5.9% in April, 33% above average. As we said, they were the only Big Group with any Non-January above average lifts.

Gas Stations – Whether you look at the data monthly or Ytd, they are doing bad. The April Ytd sales drop of -3.5% is even worse than the -2.9% at Y/E 24. That does not bode well for 2025.

Relevant Retail – Except for January, +5.0%, they seem to be stuck in the 3% lift range. April Ytd, +3.9%, did finally exceed the +3.6% in 24. This is not a surprise as April had their only non-January above average monthly lift. They have made slow but steady progress since February.

Total Retail – The pattern matches Relevant Retail but the YOY changes for all but January are smaller. The averages are about the same so Total has bigger disparities. Total also includes Auto and Gas Stations which have had extreme lifts and drops. However, they are making steady progress since February and their Ytd lift has been above 24 since March.

Summary and Comparison of Monthly to Ytd

  Monthly: Drops: 6; Below Avg Lifts:  4; Above Avg Lifts: 10

         Ytd: Drops: 3; Below Avg Lifts: 11; Above Avg Lifts: 6

Mon: JAN: $↓: 0; ↓Avg: 1 ↑Avg: 4; FEB: $↓: 4; ↓Avg: 1 ↑Avg: 0; MAR: $↓: 1; ↓Avg 2 ↑Avg: 2; APR: $↓: 1; ↓Avg: 0; ↑Avg: 4

Ytd: JAN: $↓: 0; ↓Avg: 1 ↑Avg: 4; FEB: $↓: 1; ↓Avg: 4 ↑Avg: 0; MAR: $↓: 1; ↓Avg 3; ↑Avg: 1; APR: $↓: 1; ↓Avg: 3; ↑Avg: 1

Obviously, January  Monthly & Ytd are the same. The summary clearly shows that the Ytd report levels the Feb>Apr data. The situation doesn’t look good Ytd but both reports show that it is improving for all but Gas Stations.

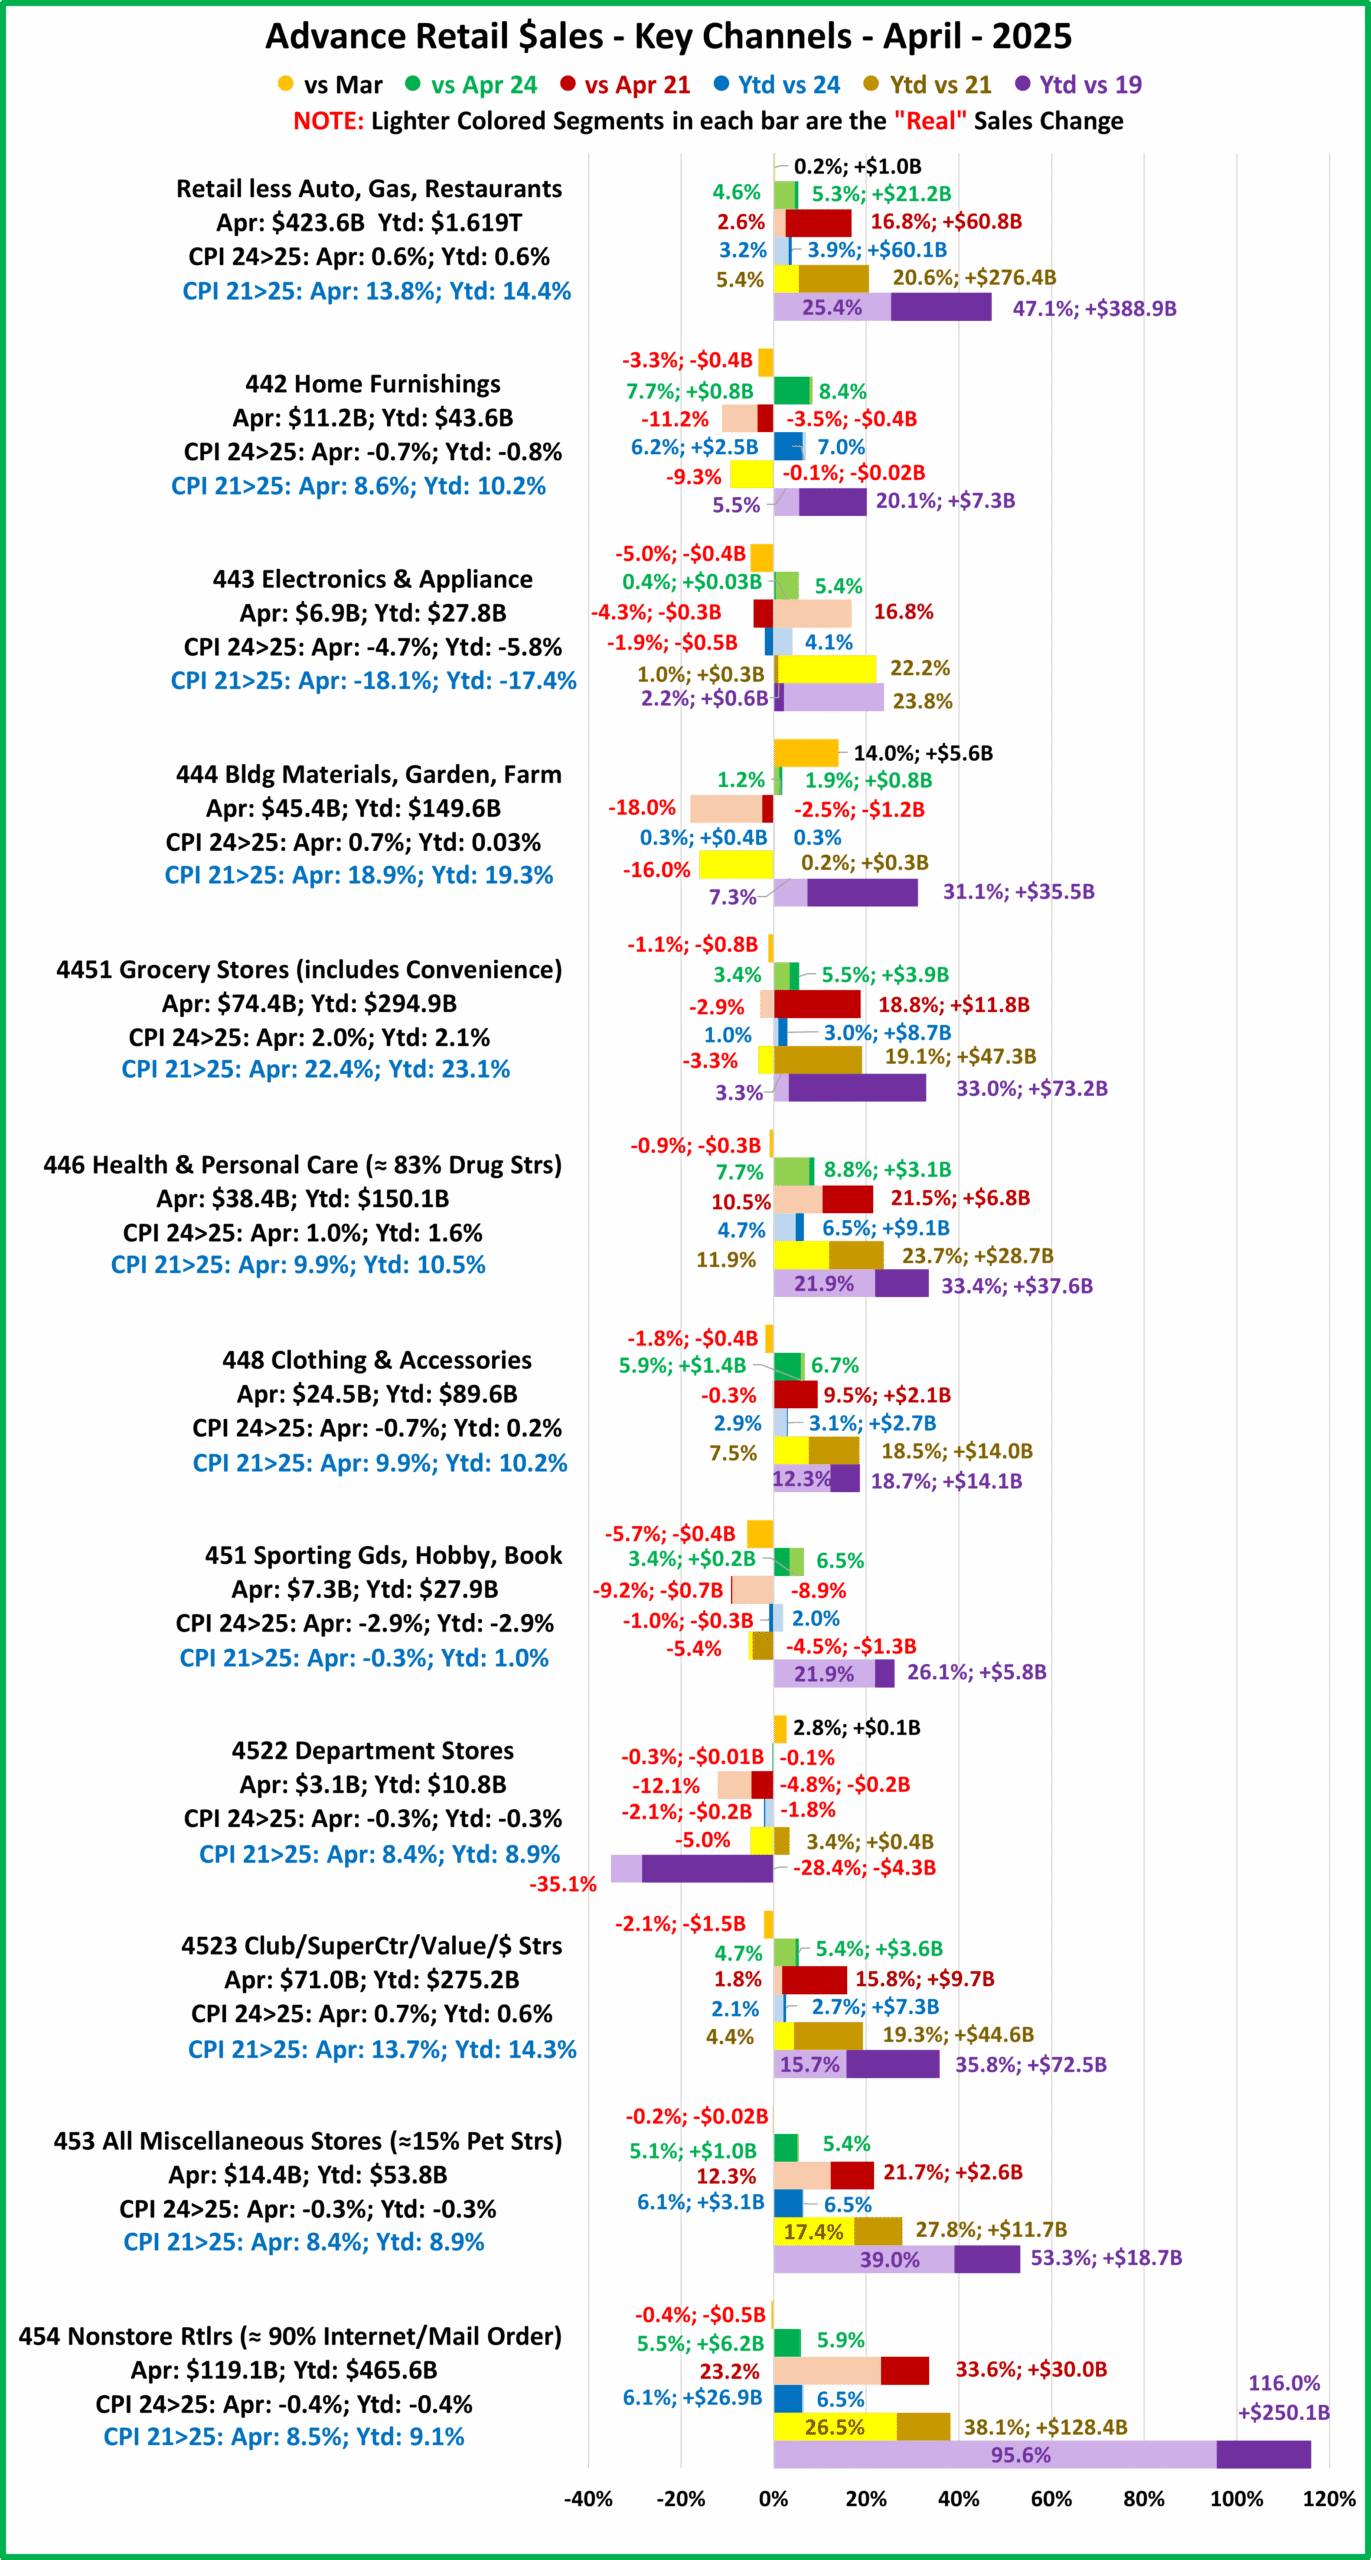
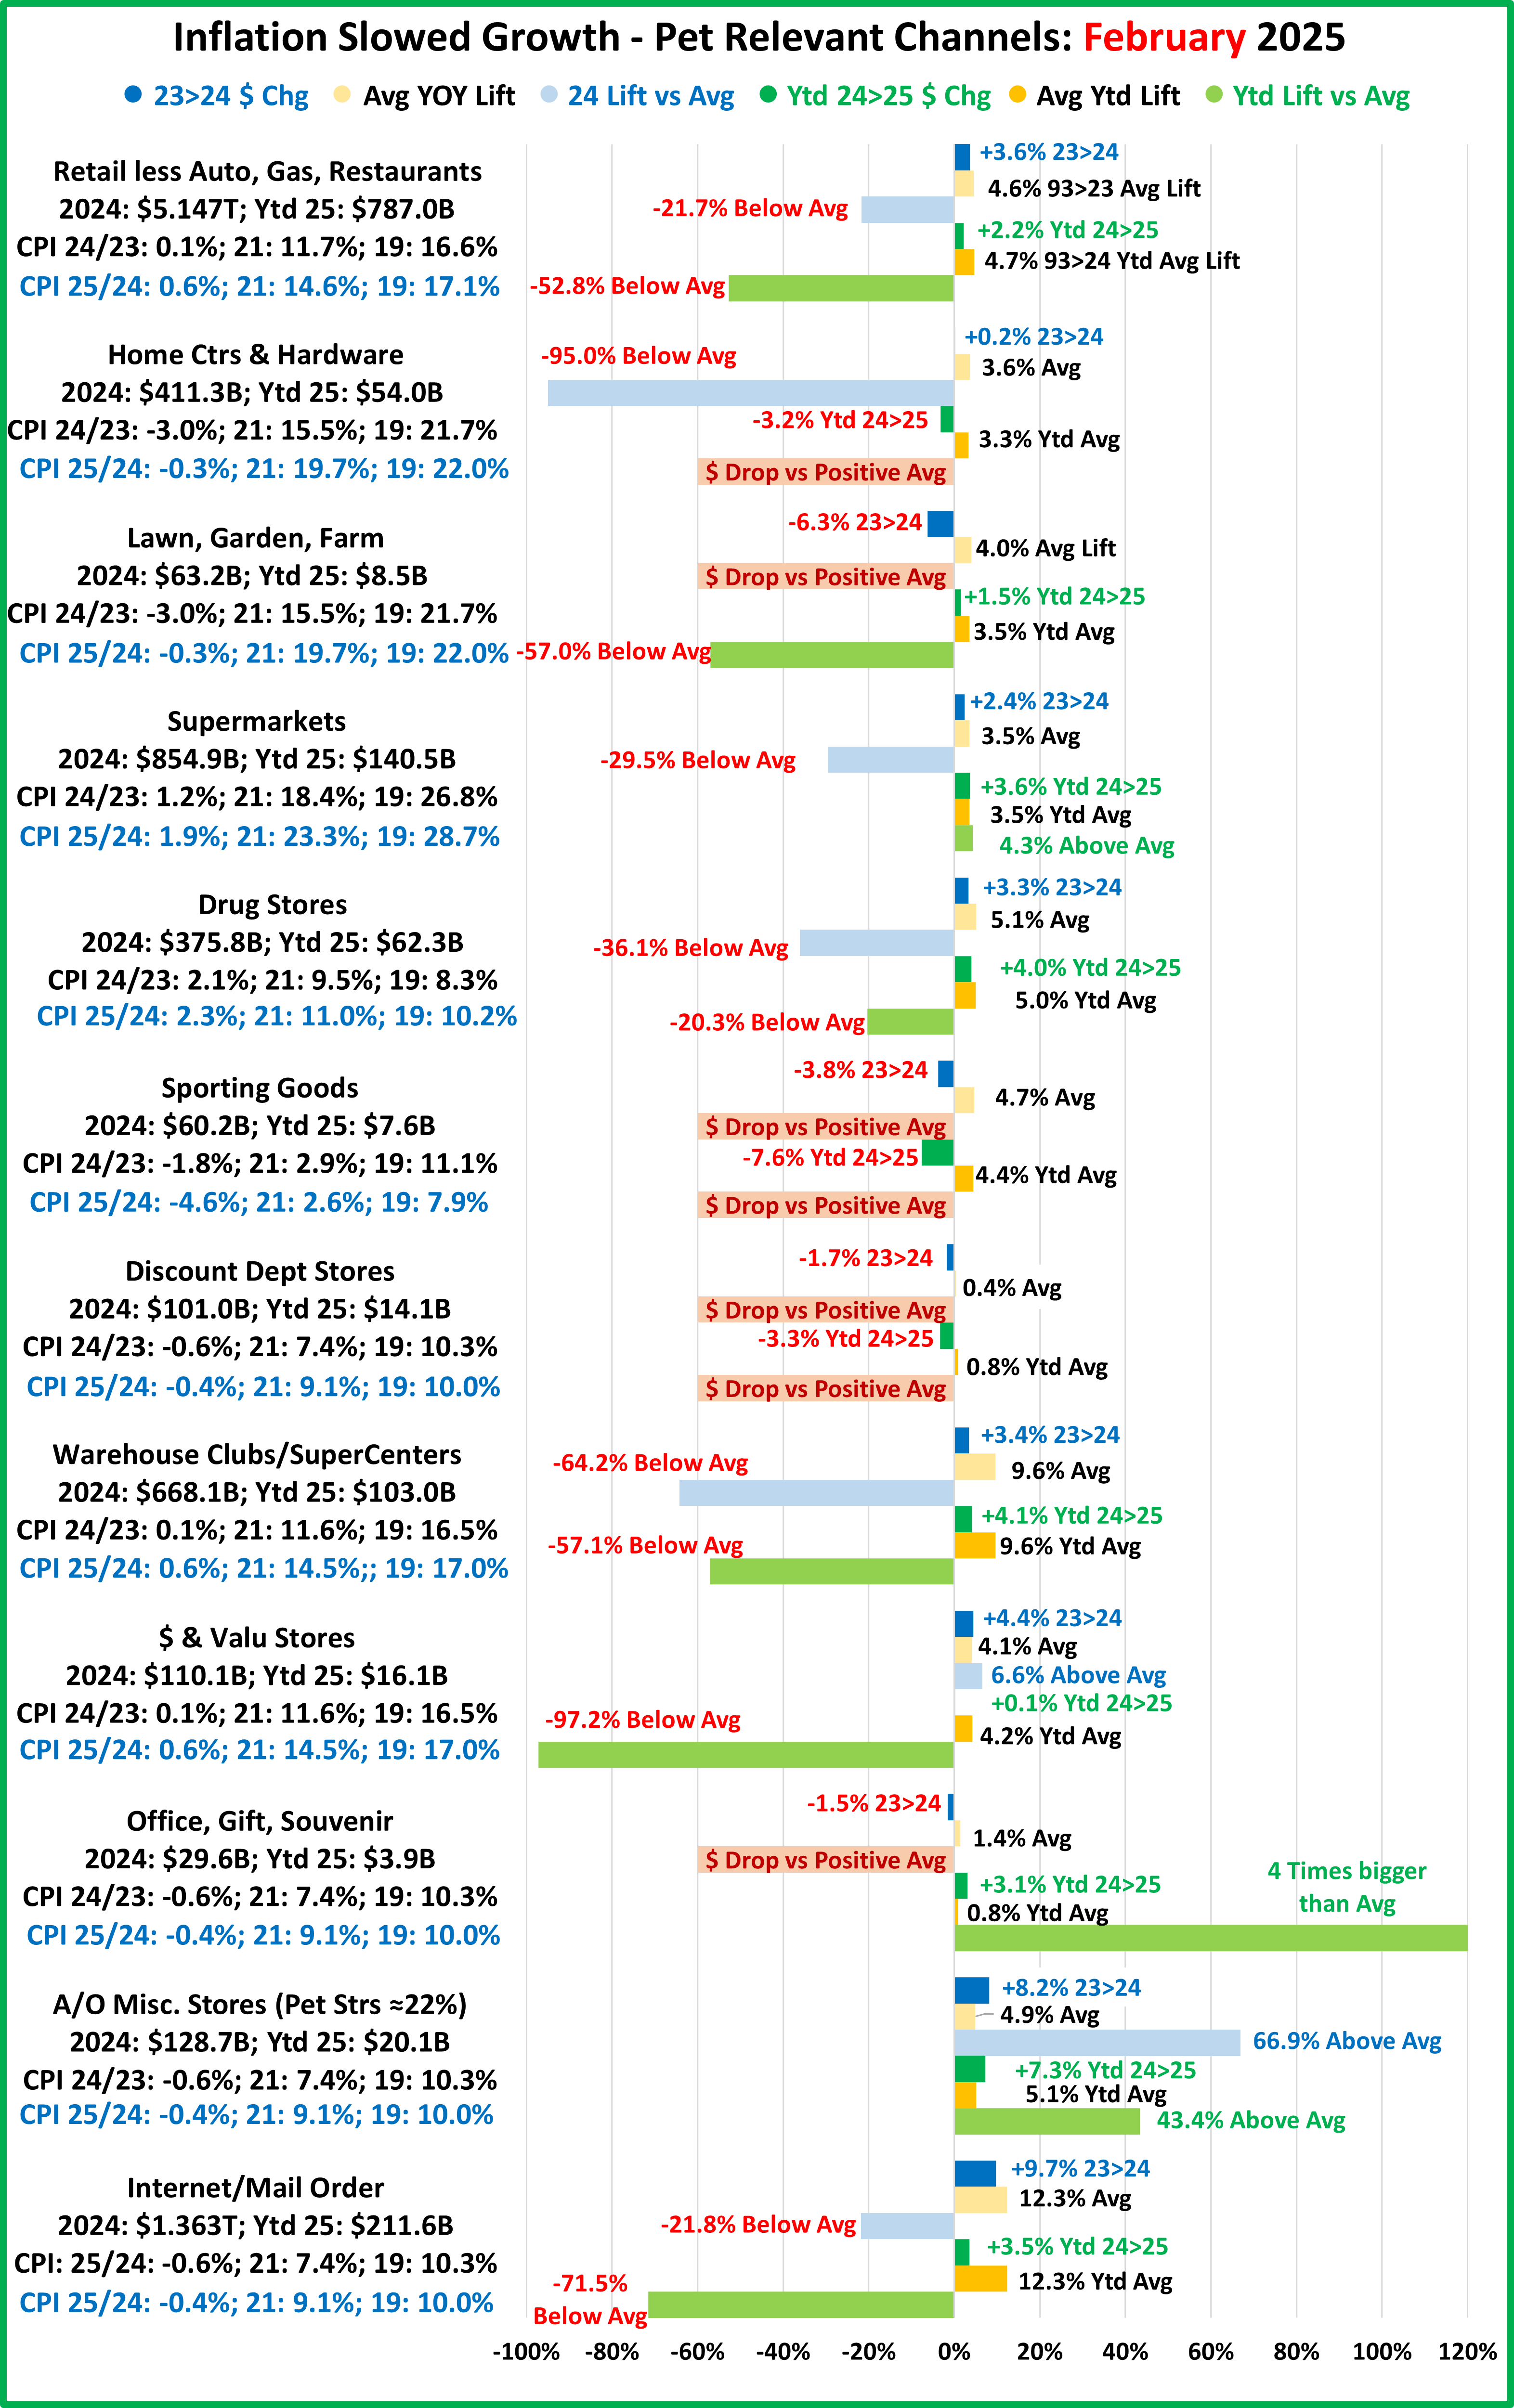
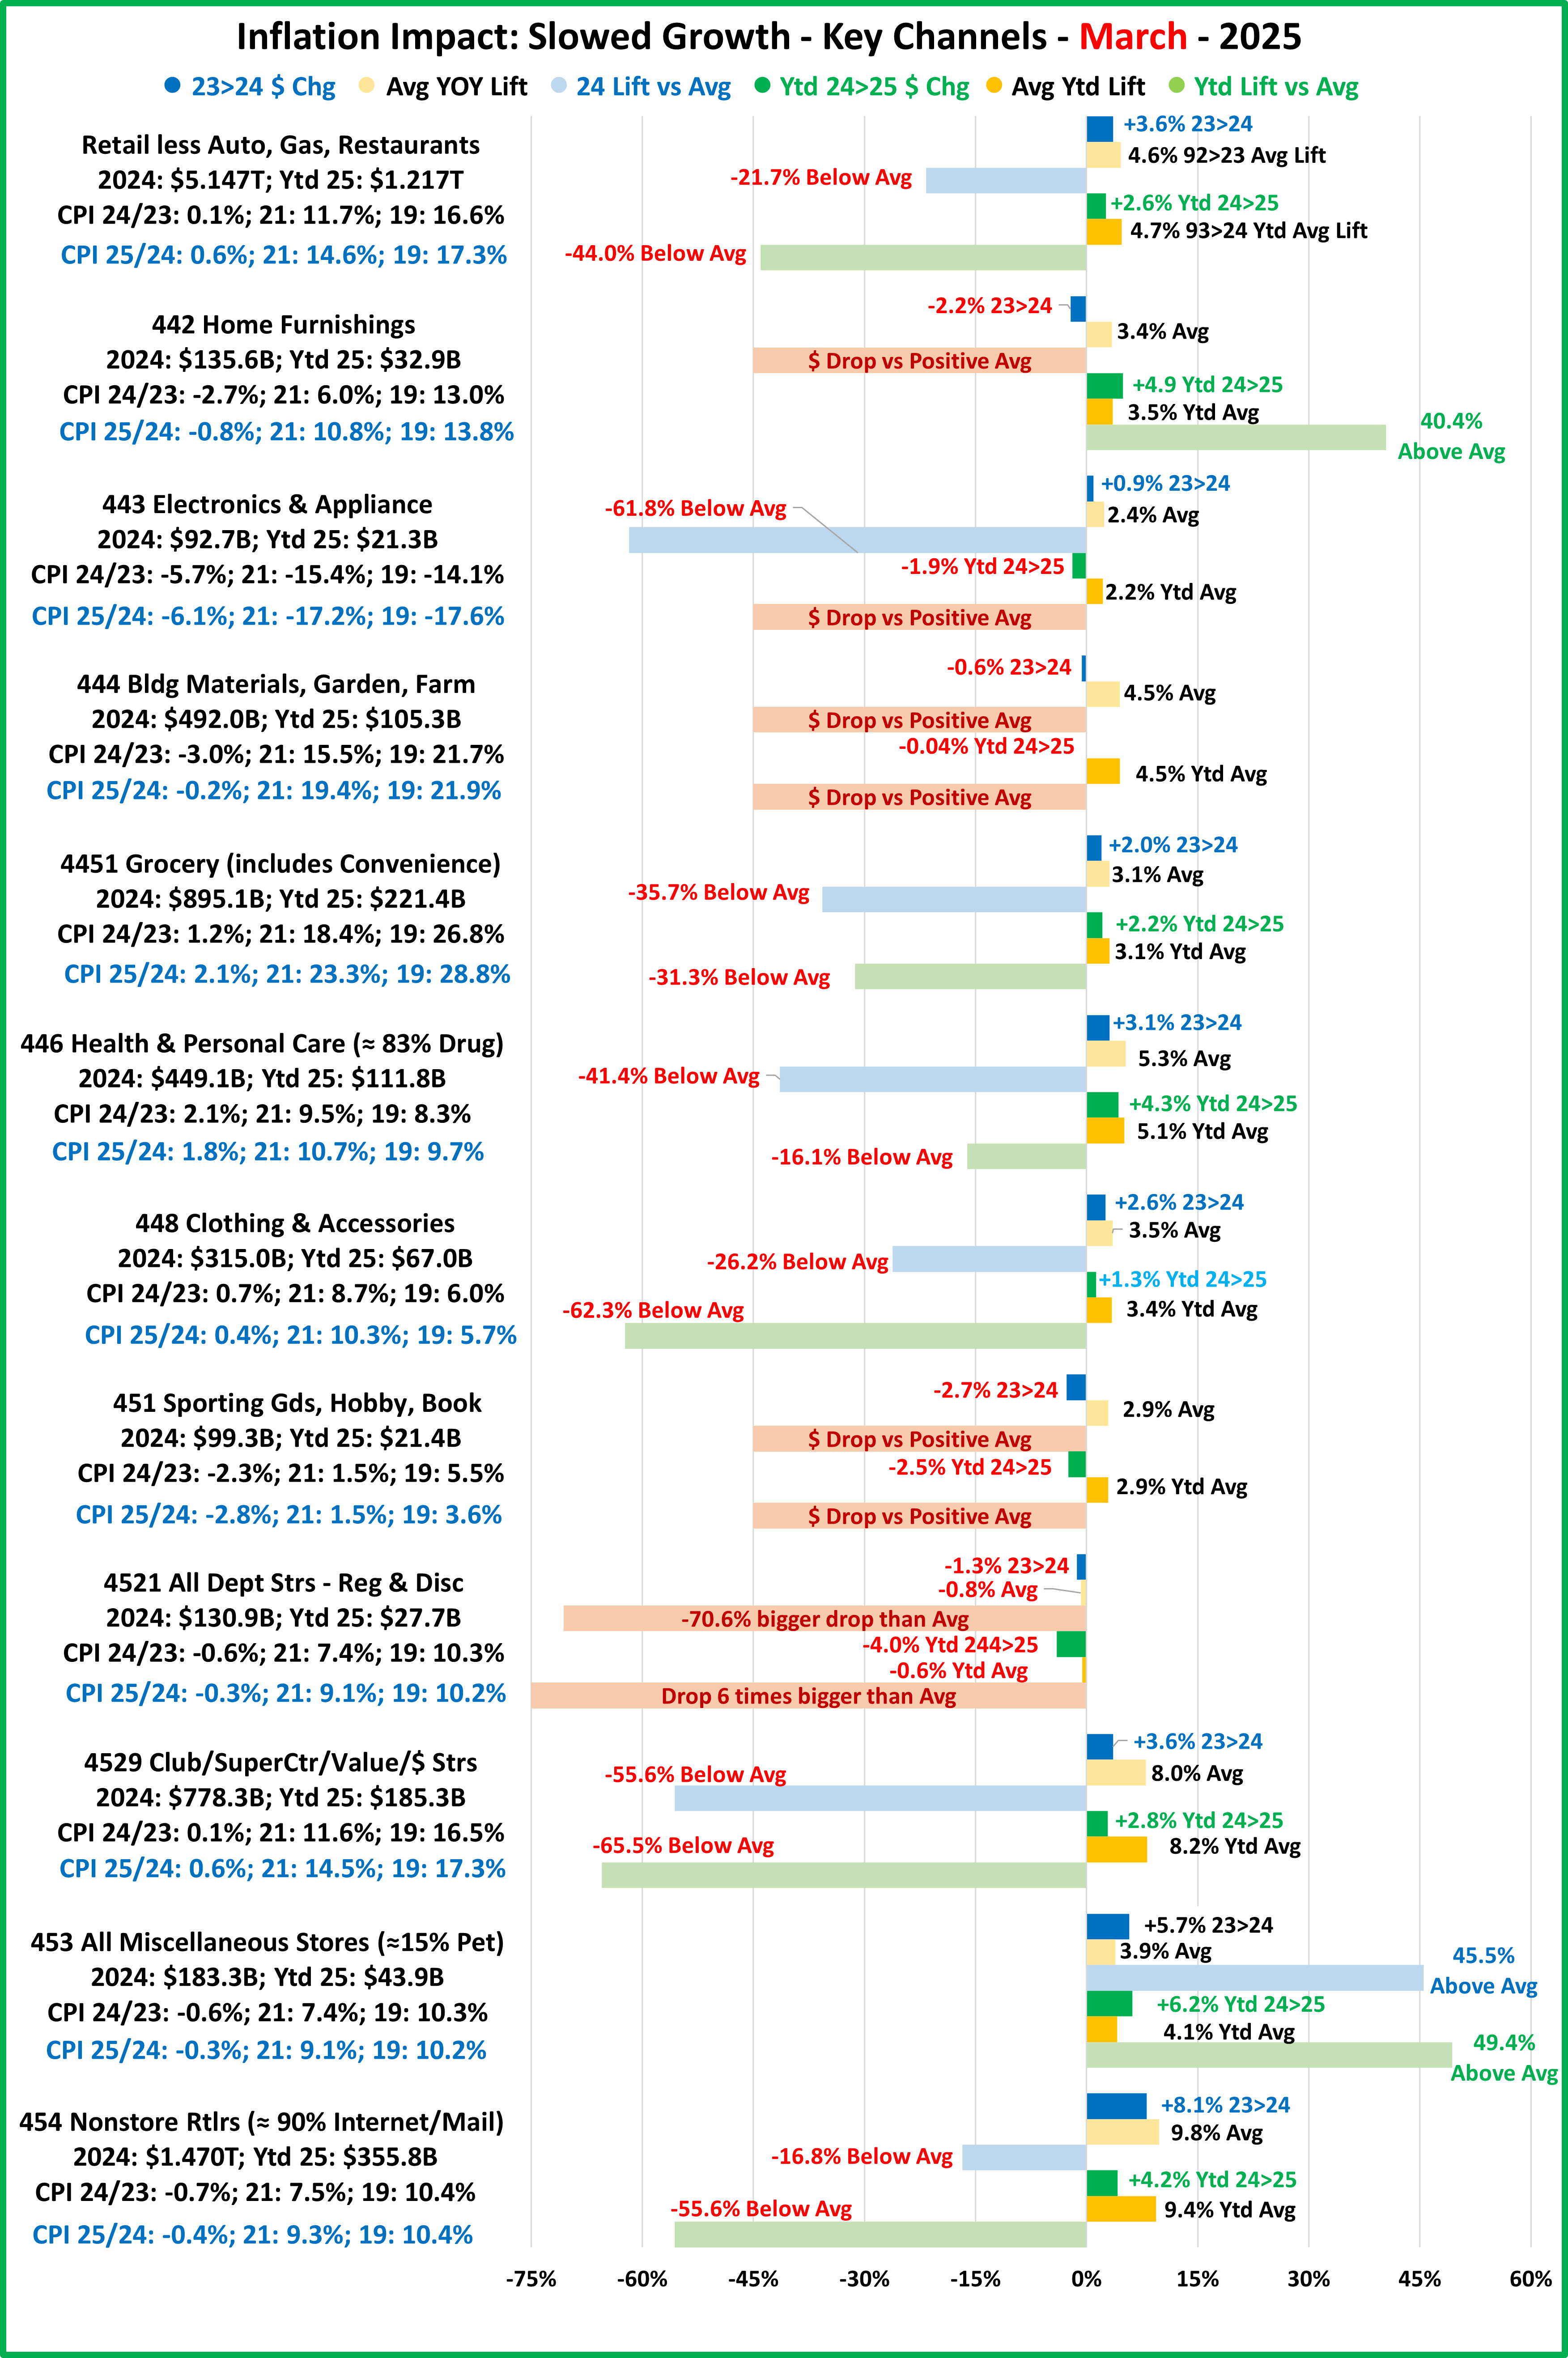
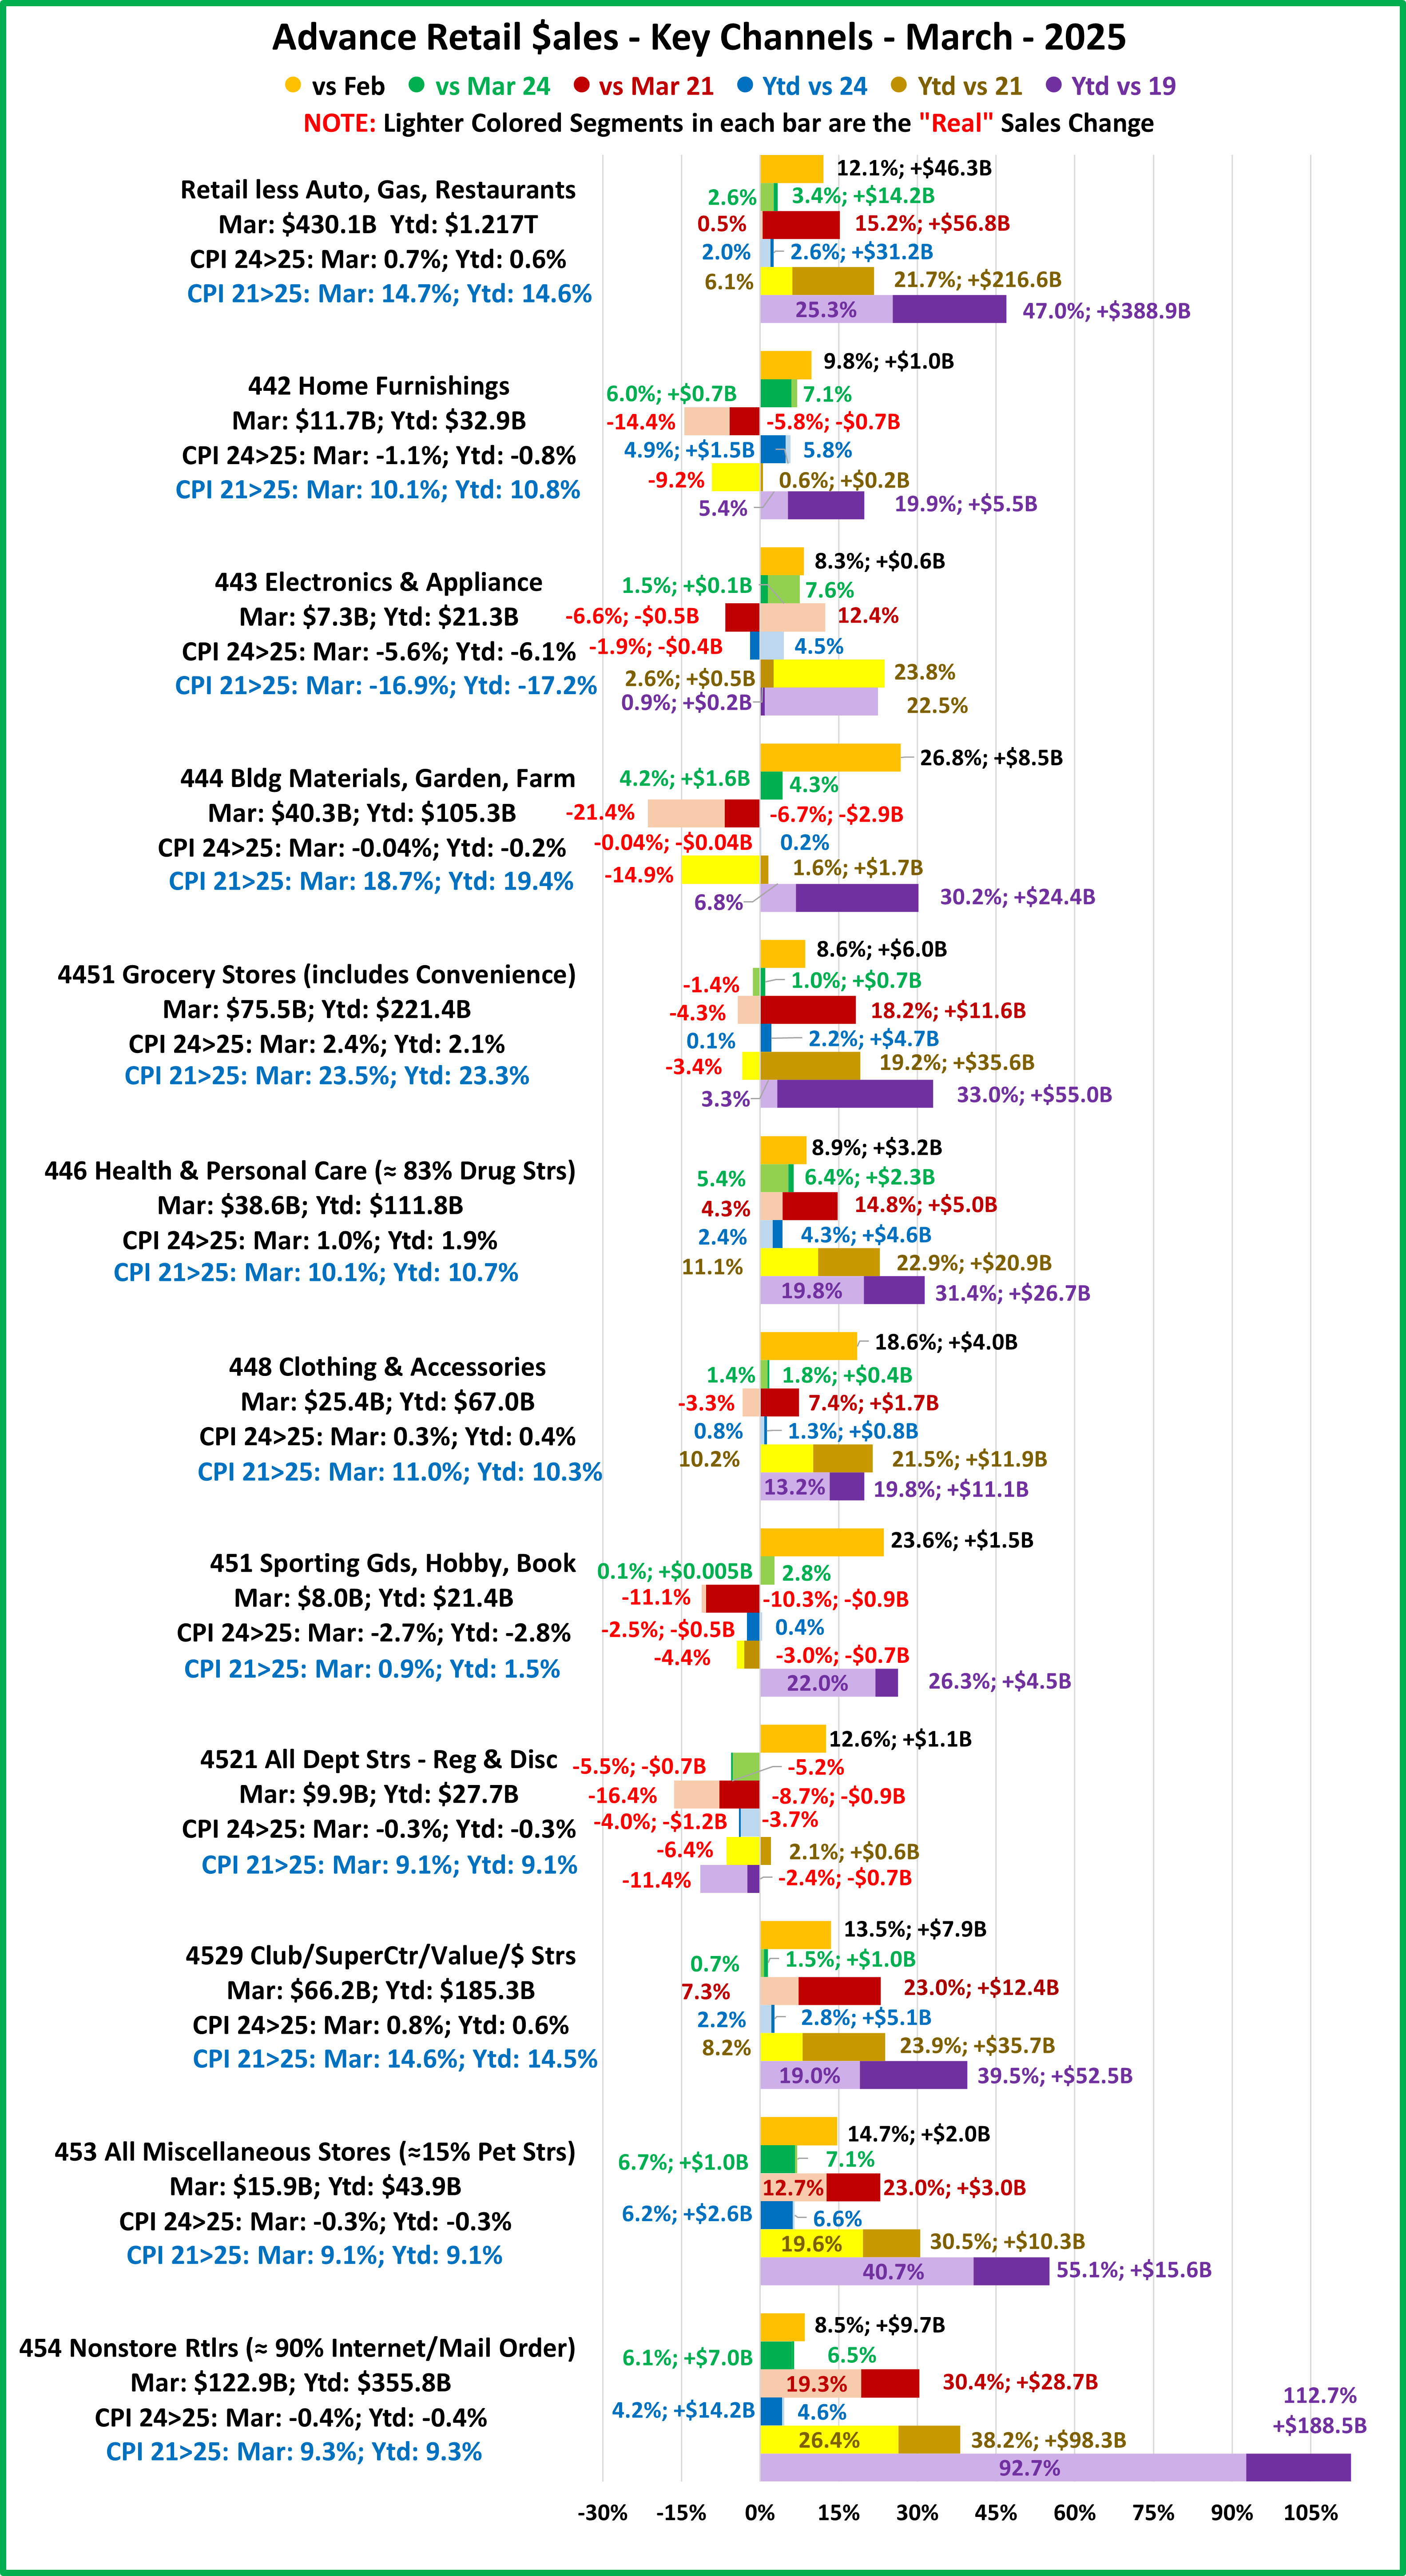
Now, Let’s look at Ytd Sales for Key Relevant Retail Channels

The Ytd chart looks a little worse than the Monthly chart. It turns out that this is true. Both charts have the same number of Below Average lifts, 41% of all entries. However, the Ytd version has 27% more drops and -20% less Above Average lifts. Ytd also has 3 channels that had drops every month in 2025. Monthly has only 1. However, Ytd has 2 channels with Above Average lifts every month. Monthly has none. It’s a complex situation. Let’s get into the specifics.

Furniture Stores – They are going strong. Their huge January lift pushed the February Ytd lift from below to above avg. Now, all months are above average. Tarifflation fear caused binge buying in Mar>Apr so the current lift is double the avg.

Electronics/Appliance – Ytd they are all negative. This version hides Mar>Apr lifts. March was even 6.6% above average. The impact in the Ytd chart was that their YOY drop slowed from -5.0% in February to -1.9% in April.

Bldg Matl/Garden/Farm – Their big February drop turned March from a below average monthly lift to a -0.4% Ytd drop. Both charts show a slight improvement in April.

Grocery – Their big January lift made  their situation look significantly better in Ytd. However, it effectively hid the above average lift in April. Note: The current Ytd lift (+3.0%) is 50% above 24 Y/E and just 6% below the annual average.

Health – Both Monthly & Ytd have the same pattern – Jan>Feb, below average lifts; Mar>Apr, above avg. However, the Mar>Apr Ytd lifts are not as big as monthly – both actual and vs average.

Clothing – They had a +5.4% lift in January, 67% above avg. This eliminated the February drop in Ytd but the February drop changed Mar>Apr from above to below average in Ytd. April Ytd is 24% more than 24 & equal to the annual avg.

Sport/Hobby/Book – They had drops in Jan>Feb. Feb was -6.4%. This turned Ytd all negative. It also hid the possible start of a recovery. Mar>Apr both had monthly lifts. March was below avg but April was 12% above avg.

Department Strs – Both reports show drops every month. They have been fading for years. It continues.

Club/SupCtr/Value/$ – They offer value and convenience, the biggest shopping drivers. Some $ stores are struggling but SuperCenters are still going pretty strong. Besides the internet, one problem in sustaining strong growth is that they are running out of new customers. The Monthly report had a 0.2% drop in February and only a 0.2% lift in March. The Ytd numbers look better. There are no drops, but the April Ytd lift is only +2.7%, 68% below average.

Miscellaneous – This is probably our favorite channel because it includes pet stores. They also have great performance. In the Monthly report, the YOY lift for February was +3.6%, -13% below average. All other months are above average. The Ytd report is even better. All months are above average and April is +6.2%, 42% above average and 15% more than Y/E 24

Nonstore – They are driven by the internet which has had the strongest growth and became the biggest $ channel in 2020. The Monthly & Ytd reports have similar patterns – all months below avg. April Ytd is +6.1. That sounds great but it is -38% below average. We’re seeing that it is difficult, if not impossible to maintain double digit growth…forever.

Relevant Retail – Their $ come from a mixture of different spending patterns. They had no drops and both Monthly & Ytd show steady improvement since February. Ytd hides the Above avg April lift but it shows that the group’s performance in April now exceeds 2024…+3.9% to +3.6%. Here is a summary and comparison of Monthly to Ytd for the 11 channels.

                                                        Monthly: Drops: 11; Below Avg Lifts: 18; Above Avg Lifts: 15

                                                                 Ytd: Drops: 14; Below Avg Lifts: 18; Above Avg Lifts:  12

Mon: JA $↓: 3; ↓Avg: 4 ↑Avg: 4; FE $↓: 6; ↓Avg: 5 ↑Avg: 0; MR $↓: 1; ↓Avg 5 ↑Avg: 5; AP $↓: 1; ↓Avg: 4;↑Avg: 6

Ytd:   JA $↓: 3; ↓Avg: 4 ↑Avg: 4; FE $↓: 4; ↓Avg: 5 ↑Avg: 2; MR $↓: 4; ↓Avg 4;↑Avg: 3; AP $↓: 3; ↓Avg: 5;↑Avg: 3

The key differences between the Monthly & Ytd reports are in the extremes – drops & above avg lifts. Both views are critically important. Monthly shows what is currently happening in the marketplace and Ytd puts it into perspective. They also show trends over time. Ytd provides an overview while Monthly shows the details fueling the movement.

Inflation negatively affects retail growth both in the short term, with spikes or drops, and in the long term, with cumulative high prices. It can even have an impact before it happens. We are seeing this with pre-tarifflation “fear” buying. The current retail situation is not good. The YOY lifts vs 2024 are generally below the long term average for most channels. Retail seems to have “hit bottom” in February but most channels (not Gas Stations or Department stores) have showed some improvement in March and especially in April. Inflation is relatively low with some deflation, but prices are still high. We’ll continue to track the situation.

Retail Channel $ Update – March Monthly & April Advance

In April, the Commodities CPI fell to -0.2% from 0.05% and Total Retail sales were +5.2% vs 24, 11.3% above their average April Lift. The Relevant Retail CPI slowed to 0.6% from 0.7% and sales vs 24 were +5.3%, 13.2% above average. There are other factors currently impacting sales, including high cumulative inflation and pre-tarifflation binge buying. The situation is complex but in regard to the size of YOY sales lifts vs 24, April is better than March.

It is also time for the annual adjustment of the survey by the Census Bureau. There are 2 big changes. Non-employer companies (about 1.8% of Retail $) were removed to match other reports like the Economic Census. This is minor but widespread, affecting data back to 1992. The other change is more visible. The NAICS code for Discount Department Stores has been discontinued. In recent years they have added a significant amount of grocery items to their stores so they are now classified as Club/SuperCtrs. This became effective in 2013. From 1992>2012, they are listed as Department Stores. I have revised my entire 1992>2025 monthly sales by channel database to reflect all changes.

The layout of my report is unchanged. We will begin with the Census Bureau’s March Monthly Report and then go to their April Advance Report. Our focus is still comparing to last year but also 21 & 19. We’ll show both actual and the “real” change in sales as we factor inflation into the data. Note: There is 1 change in the methodology for determining 92>24 Avg $ales lifts. I now use the POWER function.

Both reports include the following:

  • Total Retail, Restaurants, Auto, Gas Stations and Relevant Retail (removing Restaurants, Auto and Gas)
  • Individual Channel Data – This is more detailed in the Monthly reports, and we’ll focus on Pet Relevant Channels.

The data will be presented in detailed charts to facilitate visual comparison between groups/channels. The charts will show 11 separate measurements. To save space they will be displayed in a stacked bar format for the channel charts.

  • Current Month change – % & $ vs previous month
  • Current Month change – % & $ vs same month last year and vs 2021.
    • Current Month Real change vs last year and vs 2021 – % factoring in inflation
  • Current Ytd change – % & $ for this year vs last year, 2021 & 2019.
    • Current Ytd Real change % for this year vs last year and vs 2021 and 2019
  • Monthly & Ytd $ & CPIs for this year vs last year and vs 2021 which are targeted by channel will also be shown. (CPI Details are at the end of the report)

First, the March Monthly. All Big Groups were up from February but there were 2 actual YOY sales drops, Gas Stations vs 24. We should note that they are selling less product than in 21 & 19. 3 groups are “all positive”. There were none in February. Relevant Retail has been all positive in 12 of the last 16 months and in 8 of the last 10. ($ are Not Seasonally Adjusted)

Primarily due to the annual adjustment, the March Monthly is $10.2B less than the Advance report. Restaurants: -$0.3B; Auto: -$2.3B; Gas Stations: -$0.1B; Relevant Retail: -$7.5B. All big groups were up double digits from February. A Feb>Mar increase in Total Retail  has happened in every year but 2020 since 1992. Plus, the 15.3% lift was 14.6% bigger than the 13.3% average. There were only 2 YOY drops in actual sales vs 5 in February. There were also only 5 “real” sales drops (8 in Feb) and 3 groups were “all positive” (None in Feb). Restaurants still have the biggest increases vs 21 & 19 but Relevant Retail stayed at the top of “real” performance vs 2019. However, only 54% of their growth is real.

Now, let’s see how some Key Pet Relevant channels did in March (82% of Mar Ytd Rel Retl $)

Overall– All 11 were up from February. Vs Mar 24, 8 were actually and 7 “really” up. Vs Mar 21, 7 were up but only 4 were real increases. Vs 2019, The only negatives were Off/Gift/Souv & Dept Strs. Both were actually & really down.

  • Building Material Stores – The pandemic focus on home has produced sales growth of 33.5% since 2019. Prices for the Bldg/Matl group have inflated 18.7% from 21 and 21.9% from 2019 which is having an impact. Sales vs February were +23.9% for HomeCtr/Hdwe and +40.1% for Farm Stores. Vs other years, actual $ are only down monthly vs 21 for both & Ytd vs 24 for Home/Hdw. In Real $, both are down vs 21 and Home/Hdw is also down Ytd vs 24. Plus, only 22% of the Bldg Materials group’s 19>25 lift was real. Avg 19>25 Growth: HomeCtr/Hdwe: 4.2%, Real: 0.8%; Farm: 5.9%, Real: 2.4%
  • Food & Drug – Both are truly essential. Except for the pandemic food binge buying, they tend to have smaller changes in $. In terms of inflation, the Grocery rate is now 2.4 times higher than the rate for Drug/Med products. Drug Stores are positive in all measurements and 66% of their 2019>25 growth is real. Supermarkets’ actual $ are up in all comparisons. They are only “really” down monthly vs 2024 & 2021 and Ytd vs 2021. However, only 11.5% of their 19>25 increase is real growth. Avg 19>25 Growth: Supermarkets: +5.0%, Real: +0.6%; Drug Stores: +5.1%, Real: +3.5%.
  • Sporting Goods Stores – They also benefited from the pandemic in that consumers turned to self-entertainment, especially sports & outdoor activities. Sales are up +33.2% from February, but their only positives are vs 2019 & real vs Mar 24. Prices are still deflating, -5.0% vs 24. Deflation started in April 23 and is a big change from +1.1% in 22>23 and +7.9% in 21>22. The caused 74.7% of their 36.8% lift since 19 to be real. Avg 19>25 Growth Rate is: +5.4%; Real: +4.1%.
  • Gen Mdse Stores – All sales but real vs Mar 24 were up for Club/SupCtrs. $ Stores are actually & really down Monthly & Ytd vs 24 and really vs Mar 21. Department Stores are only actually up Ytd vs 21. Actual sales are -28.6% from 19, so negative growth for them – both actual & real. The other channels have an average of 44.6% in real growth. Avg 19>25 Growth: SupCtr/Club: 5.3%, Real: 2.5%; $/Value Strs: +5.3%, Real: +2.5%; Dept. Strs: -5.4%, Real: -7.0%.
  • Office, Gift & Souvenir Stores – After 2 consecutive monthly drops, sales grew +19.2% from February. However, they are still actually & really down Ytd vs 2019 & really down monthly & Ytd vs 21. Their recovery started late, but their progress may be slowly restarting again. Avg Growth Rate: -0.3%, Real: -1.9%
  • Internet/Mail Order – Sales are +10.3% from February and set a new March record of $112.0B. All measurements are positive, but their YOY growth, +6.8%, is only 46% of their average since 2019. However, 83.6% of their 130.7% growth since 2019 is real. Avg Growth: +14.9%, Real: +13.1%. As expected, they are by far the growth leader since 2019.
  • A/O Miscellaneous – Pet Stores are 22>24% of total $. In May 2020 they began their recovery which reached $100B for the first time in 2021. In 2022 their sales dipped in January, July, Sept>Nov, rose in December, fell in Jan>Feb 23, grew Mar>May, fell Jun>Aug, rose Sep>Nov, fell Dec>Jan 24, grew Feb>May, fell Jun>Sep, grew Oct, fell Nov, rose Dec, fell Jan>Feb, then grew in Mar. All measurements are again positive and they are in 2nd place, behind the Internet, in the % increase vs 19 and vs 21. Also, 79% of their 76.9% growth since 2019 is real. Average 19>25 Growth: 10.0%, Real: +8.2%

March had its usual lift vs February, but the Relevant Retail lift was only 1% above avg. All big & small channels were up. The YOY March lift was 18% below avg for Relevant Retl and $ were down for 3 smaller channels and 1 big group. Prices are deflating in 7 channels (5 in Feb) but cumulative inflation still impacts sales as only 4 channels were really up vs Mar 21. The Retail Recovery is still slow. The March commodities CPI was 0.05% but dropped to -0.2% in April. Let’s see if it impacts Retail.

Mar>Apr sales were down for Total, Restaurants & Auto. A Mar>Apr Total Retail drop has happened 85% of the time since 1992 but the 0.6% drop is 65% less than average. There were 2 YOY $ drops, the same as March. $ for all Big Groups but Gas Stations were up vs Apr 24 and the Total Retail lift of 5.2% vs Apr 24 was 11% above their +4.7% 92>24 avg. The Relevant Retail 5.3% increase vs 24 was also above their +4.7% avg (+13.2%). Inflation is still a factor. The CPI for all commodities fell to  -0.2% but it is still 16.7% vs 21. The inflation surge was beginning to accelerate back then (+6.8%). There is some other good “real” news. 4 “real” measurements were down compared to 5 in March. Also, like March, 3 Big Groups were all positive. Relevant Retail has been all positive in 9 of the last 11 months.

Overall Inflation Reality– The Total Retail CPI fell to -0.2% and the $ lift vs 24 was 11% above avg. The Restaurant CPI stayed at +3.8% but their sales lift was 23% above avg. Gas prices fell to -11.7% but they are still in turmoil. Auto inflation rose to 0.8% and it is +14.6% vs 21. Auto sales grew 8.6% vs 24 (97% above avg – pre-tariff buying). Inflation slowed to 0.6% for Relevant Retail. Their YOY lift was 13% above avg and they are again all positive. Slow progress continues.

Total Retail – Since Jun 20, every month but Apr 23, Jun 24 & Feb 25 has set a monthly $ales record. In 2023>24, Sales were on a roller coaster. Up Jul>Aug, down Sept, up Oct>Dec, down Jan 24, up Feb>Mar, down April, up May, down Jun, up Jul>Aug, down in Sep, up Oct>Dec, down Jan>Feb 25, up in Mar, then down in Apr. Prices are -0.2% and YOY sales vs 24 are +5.2%, 11% above the 92>24 avg change of +4.7%. 43.5% of the 19>25 growth is real. Prices are deflating but cumulative inflation and pre-tariff buying are still impacting sales. Growth: 24>25: 3.8%; Avg 19>25: +6.4%, Real: +3.0%.

Restaurants – They were hit hard by the pandemic and didn’t begin recovery until March 2021. However, they have had strong growth since then, exceeding $1T for the 1st time in 2023. April $ are up vs 24 and they have the biggest lifts vs 21 & 19. Inflation was stable at 3.8% but is now +25.4% vs 21 and +30.5% vs 19. Their 6.9% YOY lift is 23.4% above their +5.6% 92>24 avg. They are all positive again, but just 36.4% of their 58.2% growth since 2019 is real. They are 3rd in performance behind Relevant & Total Retail. Recovery started late but inflation started early. Growth: 4.6%; Avg 19>25: +7.9%, Real: +3.2%. They just account for 13.7% of Total Retail $, but their strong growth has helped Total Retail.

Auto (Motor Vehicle & Parts Dealers) – They worked to overcome the stay-at-home attitude with great deals and advertising. They finished 2020 up 1% vs 2019 and hit a record $1.48T in 2021 but much of it was due to skyrocketing inflation. In 22, sales got on a rollercoaster. Inflation started to drop mid-year, but it caused 4 down months in actual $. Their YE real 2022 sales numbers were even worse, -8.2% vs 21 and -8.9% vs 19. 2023 started a true sales rollercoaster but the $ hit a record, $1.595T. $ fell in Jan 24, grew Feb>Mar, fell Apr, grew May, fell June, grew Jul>Aug, fell Sep, grew Oct, fell Nov, grew Dec, fell Jan>Feb 25, grew in Mar, then fell in Apr. April $ were +8.6% vs 24. (97% above avg – pre-tariff buying). Only real $ vs 21 are negative, but just 32.9% of 19>25 growth is real. Growth: 5.9%; Avg 19>25: +5.9%, Real: +2.1%

Gas Stations – Gas Stations were hit hard by “stay at home”. They started recovery in Mar 21 and inflation began. Sales got on a rollercoaster in 22 but set a record, $583B. Inflation started to slow in Aug 22 and prices slightly deflated in Dec & Feb 23, then strongly fell in Mar>Jul to -20.2%. In Aug they rose to -3.7%. In Sep they were +2.7% but began deflating to -4.2% in Feb 24. In Mar>May 24 their $ grew, fell June, rose July, fell Aug>Dec, rose Jan 25, then fell Feb>Apr. In Apr, $ are -6.5% vs 24 (4.9% avg) and only up vs Apr & Ytd 21 & 19. Real sales are down Ytd vs 21 & 19. Growth: -3.5%; Avg 19>25: +3.5%, Real: -0.4%. They show the cumulative impact of inflation and how deflation can be both positive and negative.

Relevant Retail – Less Auto, Gas and Restaurants – They account for ≈60% of Total Retail $ in a variety of channels, so they took many different paths through the pandemic. Their only down month until Feb 25 was April 2020, and they led the way in Total Retail’s recovery. Sales got on a roller coaster in 2022, but all months set new records with December reaching a new all-time high, $481B, and an annual record of $4.81T. In 2023, the roller coaster continued. A December lift set a new monthly record of $494.7B & an annual record of $4.997T. Sales fell Jan>Feb 24, rose in Mar, fell in Apr, rose in May, fell in June, rose Jul>Aug, fell Sep, rose Oct>Jan 25, fell in Feb, then rose Mar>Apr. The Apr 5.3% YOY lift is 13% above their 92>24 avg of +4.7%. They are all positive again and 54% of their 47.1% 19>25 growth is real – #1 in performance. Growth: 3.9%; Avg 19>25: +6.6%, Real: +3.8%. In 2024 their inflation rate dropped from 3.2% to 0.1%, stabilized at 0.5% Dec>Jan, rose to 0.7% in March, then slowed to 0.6% in April. Inflation is low but its cumulative impact can slow growth. We saw this in Feb>Mar. In April we saw some pre-tarifflation fear buying. We’ll see what happens next.

YOY inflation has slowed, but cumulative & impending lifts can affect sales. In April, 2 actual YOY $ comparisons were negative, the same as March. In April, there were 4 real drops, down from 5 in March. In March, Gas Stations were down vs 24 and only Restaurants & Auto had above avg lifts. In April, Gas Stations were again down but the YOY lifts for all other Big Groups were above avg. Also in April, 3 big groups were again all positive. Relevant Retail has now been all positive in 9 of the last 11 months. March was pretty good. April was better in some ways, but the recovery is still slow.

Here’s a more detailed look at April by Key Channels (98% of Apr Ytd Rel Retl $)

  • Relevant Retail: Growth: +3.9%; Avg 19>25: +6.6%, Real: +3.8%. Only 2 were up from March. Vs Apr 24: 10 were up, Real: 10, Vs Apr 21: 6 were up, Real: 5. Vs 19: Only Dept Stores were down – both actually & really.
  • All Department Stores – This group was struggling before the pandemic hit them hard. They began recovery in March 2021. Sales are +2.8% from March but only their actual Ytd numbers vs 21 are positive. Their -0.3% Apr YOY drop is 15 times better than their -4.5% avg decrease. Growth: -2.1%; Avg 19>25: -5.4%, Real: -7.0%.
  • Club/SuprCtr/$- They fueled a big part of the recovery because they focus on value which has broad consumer appeal. $ales are -2.1% from March, but they are positive in all measurements. However, only 43.9% of their 35.8% 19>25 lift is real. Their 5.4% YOY Apr lift is -34% below their 92>24 avg of +8.2%. Growth: 2.7%; Avg 19>25: +5.2%, Real: +2.5%.
  • Grocery- They depend on frequent purchases so their changes are usually less radical. Actual $ are -1.1% from March but positive in all actual comparisons. Cumulative inflation has hit them hard as real $ are down vs 21 and only 10% of 19>25 growth is real. However, their 5.5% YOY April lift is 82% above avg. Growth: 3.0%; Avg 19>25: +4.9%, Real: +0.5%.
  • Health/Drug Stores – Many stores are essential, but consumers visit less frequently than Grocery stores. $ are -0.9% from March but they are positive in all comparisons. Inflation has been relatively low so 66% of their 33.4% 19>25 growth is real. Their +8.8% YOY lift vs Apr 24 is 76% above avg. Growth: 6.5%; Avg 19>25: +4.9%, Real: +3.4%
  • Clothing and Accessories – Clothes mattered less when you stayed home. That changed in March 2021 with strong growth through 2022. Actual Sales are -1.8% from March, but they are only really down vs Apr 21. 66% of their 19>25 growth is real. $ are +5.9% vs Apr 24, double the avg lift (pre-tariff buying). Growth: 3.1%; Avg 19>25: +2.9%, Real: +1.9%
  • Home Furnishings – In mid-2020 consumers’ focus turned to their homes and furniture became a priority. Prices are still deflating but they were high in 22. $ are -3.3% from March but are only actually & really down monthly & Ytd vs 21. Only 27% of their 19>25 growth is real. YOY Apr lift: +7.7%, 150% above average (more prre-tariff buying). Growth: 6.2%; Avg 19>25: +3.1%, Real: +0.9%
  • Electronic & Appliances – This channel has had many issues. Sales fell in Apr>May of 2020 and didn’t reach 2019 levels until March 21. $ are -5.0% from March but they are only actually down vs Apr 21 & Ytd vs 24. Their strong deflation shows in high real numbers. Sales are +0.4% vs Apr 24, -81% below avg. Growth: -1.9%; Avg 19>25: +0.4%, Real: +3.6%.
  • Building Material, Farm & Garden & Hardware – They truly benefited from the consumers’ focus on home. In 2022 the lift slowed as inflation grew to double digits. Prices turned up in April but sales are +14.0% from March. Actual $ are only down vs Apr 21. Real sales are only down vs Apr 21 and Ytd vs 21. However, just 23.5% of their 19>25 sales growth is real. YOY sales vs Apr 24 were +1.9%, -56% below avg. Growth: 0.3%; Avg 19>25: +4.6%, Real: +1.2%.
  • Sporting Goods, Hobby and Book Stores – Consumers turned their attention to recreation and Sporting Goods stores sales took off. Book & Hobby Stores recovered more slowly. They have been on a sales rollercoaster since June 24 and $ are -5.7% from March. Actual & real sales are only up vs Apr 24 & 19. Real Ytd sales vs 24 are also up. 84% of their 19>25 growth is real. YOY Sales vs Apr 24 are +3.4%, 12% above avg. Growth: -1.0%; Avg 19>25: +3.9%, Real: +3.4%.
  • All Miscellaneous Stores – Pet Stores have been a key part of the strong and growing recovery of this group. They finished 2020 at +0.9% but sales took off in March 21 and have continued to grow. Sales are -0.2% vs March but positive in all comparisons. They are 2nd in the % increases vs 19 & vs 21 and 73.2% of their 53.3% 19>25 growth is real. Plus, their 5.1% YOY Apr lift is 17% more than their 92>24 avg of +4.4%. Growth: +6.2%; Avg 19>25: +7.4%, Real: 5.6%.
  • NonStore Retailers – 90% of their $ comes from Internet/Mail Order/TV. The pandemic accelerated online spending. They ended 2020 +21.4%. The growth continued in 2021 as sales exceeded $100B for the 1st time and they broke the $1 Trillion barrier. $ are -0.4% from March and their YOY lift of 5.5% vs Apr 24 is -46% below their 10.2% avg. However, they are positive in all comparisons and 82% of their 116.0% 19>25 growth is real. Growth: 6.1%; Avg 19>25: +13.7%, Real: +11.8%.

Note: Almost without exception, online sales by brick ‘n mortar retailers are recorded with their regular store sales.

Recap – The Retail recovery from the pandemic was largely driven by Relevant Retail and by the end of 2021 it had become very widespread. In 2022, there was a new challenge, the worst inflation in 40 years. Overall, inflation has slowed considerably from its June 22 peak and 7 channels, doing 44% of Relevant Retail’s 2025 $, are currently deflating (the same # as Mar). Any deflation can help the Retail situation. As expected, $ fell from March for 9 channels but the drops were usually smaller than average so the big lift for Bldg/Farm was enough to push Relevant Retail to +0.2% – a true rarity (avg chge: -1.1%). Their 5.3% lift vs April 24 was also above avg, +13.2%. 10 of 11 smaller channels had a $ increase vs 24 and 6 were above avg, up from 5 in March. Also, in both March & April, 3 big groups but only 4 Advance smaller channels were actually and really “all positive”. Relevant Retail has now been all positive in 9 of the last 11 months. The biggest concern is still YOY drops and smaller lifts. Monthly, the situation is improving. The YOY lifts vs Apr 24 for Relevant Retail and 6 of 11 smaller channels (41% of Relevant Retail’s 2025 $) were above their 92>24 average. However, ytd vs 24 the Relevant Retail lift is -18% below avg and only 3 smaller channels were above avg. The Retail recovery still has a way to go.

Finally, here are the details and updated inflation rates for the CPIs used to calculate the impact of inflation on retail groups and channels. This includes special aggregate CPIs created with the instruction and guidance of personnel from the US BLS. I also researched data from the last Economic Census to review the share of sales by product category for the various channels to help in selecting what expenditures to include in specific aggregates. Of course, none of these specially created aggregates are 100% accurate but they are much closer than the overall CPI or available aggregates. The data also includes the CPI changes vs 2021 to show cumulative inflation.

Monthly YOY CPI changes of 0.2% or more are highlighted. (Green = lower; Pink = higher)

Here are some answers to some obvious questions. Note: Overall Inflation slowed but Bldg/Farm had a significant lift.

  1. Why is the group for Non-store different from the Internet?
    • Non-store is not all internet. It also includes Fuel Oil Dealers, the non-motor fuel Energy Commodity.
  2. Why is there no Food at home included in Non-store or Internet?
    • Online Grocery purchasing is becoming popular but almost all is from companies whose major business is brick ‘n mortar. These online sales are recorded under their primary channel.
  3. 5 Channels have the same CPI aggregate but represent a variety of business types.
    • They also have a wide range of product types. Rather than try to build aggregates of a multitude of small expenditure categories, it seemed better to eliminate the biggest, influential groups that they don’t sell. This method is not perfect, but it is certainly closer than any existing aggregate.
  4. Why are Grocery and Supermarkets only tied to the Grocery CPI?
    • According to the Economic Census, 76% of their sales comes from Grocery products. Grocery Products are the driver. The balance of their sales comes from a collection of a multitude of categories.
  5. What about Drug/Health Stores only being tied to Medical Commodities.
    • An answer similar to the one for Grocery/Supermarkets. However, in this case Medical Commodities account for over 80% of these stores’ total sales.
  6. Why do SuperCtrs/Clubs and $ Stores have the same CPI?
    • While the Big Stores sell much more fresh groceries, Groceries account for ¼ of $ Store sales. Both Channels generally offer most of the same product categories, but the actual product mix is different.


INFLATION CAUSES SLOWED RETAIL GROWTH

Inflation affects spending. It is cumulative so even when the YOY rate slows, it can cause a range of issues – selling less product and even a drop in revenue. One impact that is often ignored is slowed $ growth. That is the focus of this report.

Before we get started on our main topic, let’s put the current situation into perspective. The post pandemic inflation surge affected the entire U.S. economy, but different channels took different paths. Here are some of note:

The National CPI – Inflation started in the Spring of 2021. The YOY rate peaked at 9.1% in June 22. Inflation has slowed since then but there has been no deflation, so prices are at their peak right now

Groceries – This expenditure has gotten the most publicity since it affects everyone. There have been 2 inflation waves. The first was minor. It began in the Spring of 2020 and slowed significantly in 12 months. The big surge began in the Fall of 2021. It peaked at 13.5% in August 22. Things returned to more normal rates by the Summer of 2023. There has also been no deflation, so prices are currently at their highest point.

Auto – Inflation in the Auto Big Group began slowly in the Fall of 2020 then took off in the Spring of 2021. It peaked at 23.9% in February 22, then began to slow but prices hit their high point in August. Deflation began in December 22 and was consistent until turning up Jan>Mar 25.

Gas Stations – Motor Fuel inflation began in Mar 21 and peaked at 60.2% in June 22 (along with prices). Prices began deflating in December 22 and have been on a rollercoaster since then. The biggest deflation was -26.7% in June 23.

Restaurants – Inflation began in the Fall of 2021 and peaked at 8.3% in March 23. Rates were back to normal by the Spring of 2024. There has been no deflation, so current prices are the highest in history.

Relevant Retail – Inflation began in the Fall of 2021 and peaked at 9.1% in August 22. Normal rates returned in the Summer of 2023. Prices peaked in October 23 until a recent lift pushed them to a new record high in March 25.

Total Retail (All Commodities) – The inflation surge began in the Spring of 2021 and peaked at 14.2% in March 22. Rates were back to normal by the Spring of 2023. Due to deflation, prices peaked in August 23.

All Services – Services are 60+% of all expenditures. Inflation began in the Spring of 2021 and peaked at 7.6% in January 23. Rates are still above normal and with no deflation, the current prices are the highest ever.

Now we will turn to slowed sales growth. All charts have the same format & channels as our monthly Retail report but different data. All have 6 data bars for each channel:

  1. 23>24 Y/E % Change
  2. Avg 92>23 Y/E Change
  3. 23>24 Y/E Chg vs Avg
  4. Ytd 24>25 % Change
  5. Avg 92>24 Ytd Change
  6. Ytd 24>25 Chg vs Avg

The 1st Chart Shows the Big Groups as of February 2025

February was not a good retail month but all big groups, but Gas Stations had Ytd lifts vs 2024. However, all 4 increases were -52+% less than their 1992>2024 average lift for Feb Ytd. The situation also was worse for all compared to Y/E 2024, but we must note that the drop for Gas was 79% less than in 23>24. You can see that all have high cumulative CPIs vs 21 & 19.

Now, Let’s look at some Pet Relevant Channels (82% of Ytd Relevant Retail $)

  • 23>24: 4 of 11 had $ drops; 5 of 7 had lifts below avg – ranging from -22% to -95%; 2 Above avg lifts.
  • Ytd 24>25: 3 of 11 had $ drops; 5 of 8 had lifts below avg – ranging from -20% to -97%; 3 Above avg lifts.
  • Bldg Matl/Farm – Prices continue to deflate vs last year, but cumulative inflation in this channel is the 2nd highest. Home Ctr/Hdwe had a miniscule lift in 2024, but sales dropped in 2025. Farm Stores had the exact opposite pattern. Both lifts are -50+% below avg.
  • Supermarkets – After slowing in 23>24, inflation turned up in 2025. They have the highest cumulative rate. $ales were up in 24 & Ytd 25. The 24 lift was below avg but the growth in 25 is 4.3% above avg (1 of 3 channels). This lift is only 0.1% more than avg and is above avg due to increased inflation.
  • Drug Stores – YOY inflation has been consistent but relatively low. Now, it’s the highest in this group of channels. They had $ lifts in 24 & 25 but both were -20+% below avg.
  • Sporting Goods – Deflation began in 23 and is accelerating. $ peaked in 2021 and then slowly and consistently dropped. $ are down in 23>24 & 24>25 – 1 of 2 channels. The drops are likely not inflation related.
  • Discount Dept Strs – Prices are deflating, and the cumulative rate is low. This channel has been fading so it is no surprise that they were down in both 24 and 25.
  • Clubs/SupCtrs/$/Value Stores – YOY inflation is low but cumulative inflation is high because groceries are a substantial part of their business. Sales were up for both in 24 & 25. However, only the $ store lift in 24 was above avg. The lifts in 25 were below avg, -57% (SupCtrs) & -97% ($ Strs).
  • Office/Gift/Souvenir Stores – Sales in this group of specialty stores have been slowing for years. A big part of the drop is due to the fact that consumers have increasingly moved to buying office supplies online. Sales fell in 2024 but the lift in 2025 was 4 times greater than their average. This is likely an anomaly and because this channel only accounts for 0.5% of Relevant Retail Sales, it will have little impact on the marketplace.
  • A/O Miscellaneous – This small channel has the best performance. Although their lift in 2025 is less than 2024, both are 43+% above avg. Pet Stores are in this group and undoubtedly contributed to the strong performance.
  • Internet/Mail Order – This is the biggest channel and the 12.3% avg lift is difficult to maintain. The 24 & 25 lifts are far below avg but the 25 lift is now -71%. Inflation since 2021 is one of the factors.

In the 23>24 sales change all big groups and 9 of 11 smaller channels had either a sales drop or a below avg lift. The situation slightly improved in 2025 as all big groups and 8 of 11 channels had a drop or below avg lift. Now, on to March…

The biggest change is that now Ytd Auto is above avg. This is probably due to consumers buying to avoid impending tariffs. Gas Stations are still down – now triple the February drop. Ytd 25 is still twice as bad as 24 for Relevant Retail and 3 times worse for Restaurants. Total Retail is still bad in 25, but a little better than February because of the Auto lift. We should note that the Ytd lifts for Restaurants, Total & Relevant Retail are still further below avg than in 2024.

Now let’s look at the growth slowing situation for Key Retail Channels in March (98% of Ytd Relevant Retail $)

  • 23>24 – 4 of 11 had drops; 6 of 7 had below avg lifts – range: -17% to -62%; 1 had an above avg lift.
  • Ytd 24>25 – 4 of 11 had drops; 5 of 7 had below avg lifts – range: -16% to -67%; 2 had above avg lifts.
  • Relevant Retail – 23>24: +3.6%, -21.7% vs avg; Ytd 24>25: +2.6%, -44.0% vs avg
  • Home Furnishings – $ fell 23>24 but they had a strong Ytd 25 lift, +40.4% vs avg. Like the Auto sales lift, it is likely due to consumers buying to avoid impending tariffs.
  • Electronics & Appliances – Deflation started in the Spring of 2022 and has been around -5>6% since then. They had a small lift in 24 that was -61.8% below avg but sales have fallen -1.9% Ytd in 2025.
  • Building Materials/Farm – YOY deflation continues but prices are still high vs 2021 & 2019. Sales are down in 24 and Ytd 25. Things are a little better thanks to the start of their annual Spring lift but Ytd $ are -6.2% below 2022.
  • Grocery – After slowing, inflation has turned up in 25. They have the highest rate vs 21 & 19. This is a very “needed” channel, so sales continue to grow in 24 and Ytd in 25. Both lifts are below avg but 24>25 (-31.3%) is a little better than 23>24 (-35.7%).
  • Health & Personal Care – They are 1 of only 4 channels still inflating but the rate is down from 2024. $ were up in 24 and now Ytd 25 but both lifts were below avg. However, 25 (-16.1%) is significantly better than 24 (-41.4%).
  • Clothing & Acc. – Prices are also inflating but their highest rate is vs 21, not 19. Sales are up in 2024 & Ytd 25. The lifts are small and both are below avg, especially 24>25 which is -62.3% lower than their avg March Ytd lift.
  • Sporting Gds/Hobby/Book Stores – Prices are still deflating, and cumulative inflation is low. $ are down -2.5+% in 24 and Ytd 25. Their average lift for both is 2.9%. This group has other problems. Sporting Goods $ took off due to Covid, peaked in 21 and then slowly dropped. Book stores have faded as consumers moved online.
  • Clubs/SupCtr/Value/$ Stores – Their current inflation is low but relatively high vs 21 & 19 because groceries are an important part of their product mix. Sales are up 23>24 and Ytd 24>25. The 24 lift is -55.6% below avg but the Ytd 25 lift is even worse, -65.5% below avg.
  • All Miscellaneous Stores (≈15% Pet) – Prices are deflating, and inflation vs 2021 & 2019 is low. Their sales were +5.7% in 2024 and +6.2% Ytd in 2025. The 2024 lift was 45.5% above avg but the Ytd lift was even better, +49.4%. Unfortunately, this channel only produces 3.6% of Relevant Retail $ so their great performance has little impact.
  • Nonstore – This is the biggest channel and its growth was largely fueled by the COVID induced Consumer movement to online shopping. They had an 8.1% increase in 2024, but it was still -16.8% below their annual average lift of 9.8%. Things have slowed significantly in 2025. Ytd sales are +4.2%, -52% below 2024 but -55.6% below avg. Their sales are +95% since 2019. If temporary factors cause your $ales to surge, keeping a high growth % is tough.

Before we summarize the results, let’s delve into the data. All numbers in the charts come or are derived from monthly retail sales reports from the Census Bureau – going back to January 1992. Businesses are required by law to submit timely and accurate data. Retail is defined as product providers so Service outlets are not included in their reports.

In my report, the Big Group charts represent 100% of Retail $ales. The February Channel chart is only Pet specific channels and represents 82% of Relevant Retail $ales. The March Channel chart covers the entire marketplace so it represents 98% of Relevant Retail $ales.

Now, let’s get to the subject – the impact of inflation on Retail Sales. High prices can cause less product being sold and even a drop in revenue. One of the less visible impacts is the slowing of growth. All of these can occur because of high prices. Since inflation is cumulative, they can still happen if inflation slows or even if prices deflate. We’ll focus on slowed growth. How do you measure it? The best way is to compare the current YOY lift to the long-term average. To get a broader view and evidence of change we compared the Y/E 23>24 and Ytd 24>25 lifts. In 2024, $ grew +3.6% for Relevant Retail, -21.7% below avg. In March 2025, their Ytd lift was +2.6%, -44.0% below avg. This is worse but the situation is complex. In the 11 channels:

  • 23>24: 4 (16.7% of $) had drops; 7 (81.3% of $) had lifts, 6 (77.7% of $) were below avg and 1 (3.6% of $) was above avg
  • 24>25: 4 (14.4% of $) had drops; 7 (83.7% of $) had lifts, 5 (77.3% of $) were below avg and 2 (6.3% $) were above avg.

They look very similar and the above/below avg lift situation in 25 looks better, not worse. However, the 5 below avg channels in 25 had essentiallly the same $ share as the 6 in 24 but their disparity vs avg was much worse. This produced the -44% below avg Ytd 25 lift for Relevant Retail. We should also note that the $ share of  the above avg lifts is insignificant and 2 of the 3 total lifts are by 1 channel – Miscellaneous Stores. The other is from Furniture. Like Auto, the above avg lift for Furniture was due to a surge in buying to avoid impending tariffs. The slowing lift problem is widespread and not getting better. In March 2025, channels generating 91.7% of Relevant Retail sales had either a below avg Ytd increase or a drop in sales vs 2024. We should be very concerned as the impending tariff tsunami will only make the situation worse.

Retail Channel $ Update – February Monthly & March Advance

In March, YOY Commodities’ inflation slowed to 0.05% from 0.6%. Even with a very low inflation rate, high cumulative inflation vs 21 can still impact consumer spending and slow $ales growth.  We saw more evidence of this in March. Total Retail $ were +4.2% vs 24, -16% below the average 92>24 change of +5.0%. Relevant Retail was worse, +3.4%, -29% below the March average of +4.8%. The situation is complex, but the recovery is slowly restarting. We’ll continue to track the retail market with data from 2 reports provided by the Census Bureau and factor in a targeted CPI.

The Census Bureau Reports are the Monthly and the Advance Retail Sales Reports. Both are derived from sales data gathered from retailers across the U.S. and are published monthly at the same time. The Advance Report has a smaller sample size so it can be published quickly – about 2 weeks after month end. The Monthly Report includes data from all respondents, so it takes longer to compile the data – about 6 weeks. Although the sample size for the Advance report is smaller, the results over the years have proven it to be statistically accurate with the Monthly reports. The biggest difference is that the full sample in the Monthly report allows us to “drill” a little deeper into the retail channels.

We will begin with the February Monthly Report and then go to the March Advance Report. Our focus is comparing to last year but also 21 & 19. We’ll show both actual and the “real” change in sales as we factor inflation into the data.

Both reports include the following:

  • Total Retail, Restaurants, Auto, Gas Stations and Relevant Retail (removing Restaurants, Auto and Gas)
  • Individual Channel Data – This is more detailed in the Monthly reports, and we’ll focus on Pet Relevant Channels.

The data will be presented in detailed charts to facilitate visual comparison between groups/channels. The charts will show 11 separate measurements. To save space they will be displayed in a stacked bar format for the channel charts.

  • Current Month change – % & $ vs previous month
  • Current Month change – % & $ vs same month last year and vs 2021.
    • Current Month Real change vs last year and vs 2021 – % factoring in inflation
  • Current Ytd change – % & $ for this year vs last year, 2021 & 2019.
    • Current Ytd Real change % for this year vs last year and vs 2021 and 2019
  • Monthly & Ytd $ & CPIs for this year vs last year and vs 2021 which are targeted by channel will also be shown. (CPI Details are at the end of the report)

First, the February Monthly. All were down from January and there were 5 actual YOY sales drops – all vs 24. We should note: Gas Stations are selling less product Ytd than in 2021 & 2019. No group is “all positive” – a significant change from 4 in January. Relevant Retail has been all positive in 11 of the last 15 months and in 7 of the last 9. ($ are Not Seasonally Adjusted)

The February Monthly is $2.7B more than the Advance report. Restaurants: +$1.0B; Auto: -$1.1B; Gas Stations: +$0.2B Relevant Retail: +$2.6B. Relevant Retail was the driver in the $ales decrease vs January, but all big groups were down. A Jan>Feb decrease in Total Retail  has happened in 64% of the years since 1992. However, the -3.5% drop was 7 times the -0.5% average. There were 5 YOY drops in actual sales vs none in January. There were 8 “real” sales drops (only 2 in Jan) and no group was “all positive”. Restaurants still have the biggest increases vs 21 & 19 but Relevant Retail stayed at the top of “real” performance vs 2019. However, only 54% of their growth is real.

Now, let’s see how some Key Pet Relevant channels did in February (81% of Feb Rel Retl $)

Overall– All 11 were down from January. Vs Feb 24, 5 were actually and 4 “really” up. Vs Feb 21, 11 were up but only 6 were real increases. Vs 2019, The only negative was Off/Gift/Souv. They were actually & really down.

  • Building Material Stores – The pandemic focus on home has produced sales growth of 32.1% since 2019. Prices for the Bldg/Matl group have inflated 19.9% from 21 and 22.0% from 2019 which is having an impact. Sales vs January were -4.4% for HomeCtr/Hdwe and -3.4% for Farm Stores. Vs other years, actual $ are only down monthly vs 24 for both & Ytd vs 24 for HomeCtrs. In Real $, both are up vs 2019 and Farm Stores are up Ytd vs 24. Plus, only 16% of the Building Materials group’s 19>25 lift was real. Avg 19>25 Growth: HomeCtr/Hdwe: 3.9%, Real: 0.5%; Farm: 5.4%, Real: 1.9%
  • Food & Drug – Both are truly essential. Except for the pandemic food binge buying, they tend to have smaller changes in $. In terms of inflation, the Grocery rate is now 17% lower than the rate for Drug/Med products. Drug Stores are positive in all measurements and 62% of their 2019>25 growth is real. Supermarkets’ actual $ are up in all comparisons. They are only “really” down monthly vs 2024 & 2021 and Ytd vs 2021. However, only 14.1% of their 19>25 increase is real growth. Avg 19>25 Growth: Supermarkets: +5.1%, Real: +0.7%; Drug Stores: +4.7%, Real: +3.1%.
  • Sporting Goods Stores – They also benefited from the pandemic in that consumers turned to self-entertainment, especially sports & outdoor activities. Sales are down -3.7% from January, and their only positives are actual and real vs Feb 21 & 2019. Prices are still deflating, -5.3% vs 24. Deflation started in April 23 and is a big change from +1.1% in 22>23 and +7.9% in 21>22. The result is that 72.4% of their 36.2% lift since 2019 is real. Avg 19>25 Growth Rate is: +5.3%; Real: +4.0%.
  • Gen Mdse Stores – All actual & real sales were up for Club/SupCtrs. $ Stores are only actually & really down vs Feb 24 and really down Ytd vs 24. Discount Dept Stores are only actually up vs 2021 & 2019. Real sales are only positive vs 2019 & only 3% of their growth since 2019 is real. The other channels have an average of 49.5% in real growth. Avg 19>25 Growth: SupCtr/Club: 5.9%, Real: 3.1%; $/Value Strs: +5.5%, Real: +2.8%; Disc. Dept. Strs: +1.7%, Real: 0.1%.
  • Office, Gift & Souvenir Stores – After a -33% drop last month, sales fell -6.5% from January. However, they are only actually & really down vs 2019 & vs Feb 24. They are also really down vs Feb 21. Their recovery started late, but their progress may be slowly restarting again. Avg Growth Rate: -0.4%, Real: -1.9%
  • Internet/Mail Order – Sales are -4.9% from January but still set a new February record of $103.2B. All measurements are positive, but their YOY growth, +3.5%, is only 24% of their average since 2019. However, 83.8% of their 128.4% growth since 2019 is real. Avg Growth: +14.8%, Real: +12.9%. As expected, they are by far the growth leader since 2019.
  • A/O Miscellaneous – Pet Stores are 22>24% of total $. In May 2020 they began their recovery which reached a record level of $100B for the first time in 2021. In 2022 their sales dipped in January, July, Sept>Nov, rose in December, fell in Jan>Feb 23, grew Mar>May, fell Jun>Aug, rose Sep>Nov, fell Dec>Jan 24, grew Feb>May, fell Jun>Sep, grew Oct, fell Nov, rose Dec, then fell Jan>Feb. All measurements are again positive and they are in 2nd place, behind the Internet, in the % increase vs 19 and vs 21. Also, 79% of their 74.9% growth since 2019 is real. Average 19>25 Growth: +9.8%, Real: +8.0%

Feb had its usual drop vs Jan, but the Relative Retail drop was 2.4 times bigger than the avg. All big & small channels were down. The YOY Feb lift of +0.5% was 90% below avg for Relevant Retl and 6 smaller channels and all big groups were down. Prices are deflating in 5 channels (7 in Jan) but cumulative inflation still impacts $ as only 6 channels were really up vs Feb 21. The Retail Recovery has paused. The Feb commodities CPI was 0.6% but slowed to 0.05% in Mar. Let’s see if it impacts Retail.

Feb>Mar sales were up for all. A Feb>Mar Total Retail lift has happened every year but 2020 since 1992 and the 14.9% lift is 11.7% above avg. There were 2 YOY $ drops. There were 5 in February. $ for all Big Groups but Gas Stations were up vs Mar 24, but the Total Retail lift of 4.2% vs Mar 24 was 15.7% below their +5.0% 92>24 avg. The Relevant Retail 3.4% increase vs 24 was also significantly below their +4.8% avg (-29%). Inflation is still a factor. The CPI for all commodities slowed to 0.05% but it is 16.7% vs 21. The inflation surge was just beginning back then. There is some other pretty good “real” news. 6 “real” measurements were down. In February, there were 8. Also in February, no group was all positive. In March, Total & Relevant Retail are both all positive. That’s 8 of the last 10 months for Relevant Retail.

Overall Inflation Reality– The Total Retail CPI fell to +0.05% but the $ lift vs 24 was -16% below avg. Restaurant inflation grew to +3.8% and their sales lift was 30% below avg. Gas prices fell to -9.8%, but they are still in turmoil. Auto inflation rose to 0.3% but it is still +18.9% vs 21. Their sales grew 9.8% vs 24 (79% above avg – pre-tariff buying). Inflation rose to 0.7% for Relevant Retail. Their YOY lift was 29% below avg but they are again all positive. Slow progress has restarted.

Total Retail – Since Jun 20, every month but Apr 23, Jun 24 & Feb 25 has set a monthly $ales record. In 2023>24, Sales were on a roller coaster. Up Jul>Aug, down Sept, up Oct>Dec, down Jan 24, up Feb>Mar, down April, up May, down Jun, up Jul>Aug, down in Sep, up Oct>Jan 25, down in Feb>Mar. Prices are +0.05% but YOY sales are +4.2%, 15.7% below the 92>24 avg change of +5.0%. However, 42.1% of the 19>25 growth is real. Inflation is low but cumulative inflation is still having an impact. Growth: 24>25: 2.8%; Avg 19>25: +6.4%, Real: +2.9%.

Restaurants – They were hit hard by the pandemic and didn’t begin recovery until March 2021. However, they have had strong growth since then, exceeding $1T for the 1st time in 2023. March $ are up vs 24 and they have the biggest lifts vs 21 & 19. Inflation rose to 3.8% in March and is now +25.3% vs 21 and +30.3% vs 19. Their 4.2% YOY lift is 30.1% below their +6.0% 92>24 avg. Only real Ytd vs 24 is negative, but just 35.7% of their 56.6% growth since 2019 is real. They are 3rd in performance behind Relevant & Total Retail. Recovery started late but inflation started early. Growth: 2.8%; Avg 19>25:+7.8%, Real: +3.1%.They just account for 13.7% of Total Retail $, but their strong growth has helped Total Retail.

Auto (Motor Vehicle & Parts Dealers) – They worked to overcome the stay-at-home attitude with great deals and advertising. They finished 2020 up 1% vs 2019 and hit a record $1.48T in 2021 but much of it was due to skyrocketing inflation. In 22, sales got on a rollercoaster. Inflation started to drop mid-year, but it caused 4 down months in actual $. Their YE real 2022 sales numbers were even worse, -8.2% vs 21 and -8.9% vs 19. 2023 started a true sales rollercoaster but the $ set a new record, $1.595T. $ fell in Jan 24, grew Feb>Mar, fell Apr, grew May, fell June, grew Jul>Aug, fell Sep, grew Oct, fell Nov, grew Dec, fell Jan>Feb, then grew in Mar. Mar $ were +9.8% vs 24. (79% above avg – pretariff buying). Only real $ monthly & Ytd vs 21 are negative, but only 31.3% of 19>25 growth is real. Growth: 4.9%; Avg 19>25: +5.8%, Real: +2.0%

Gas Stations – Gas Stations were hit hard by “stay at home”. They started recovery in Mar 21 and inflation began. Sales got on a rollercoaster in 22 but set a record, $583B. Inflation started to slow in Aug and prices slightly deflated in Dec & Feb 23, then strongly fell in Mar>Jul to -20.2%. In Aug they rose to -3.7%. In Sep they were +2.7% but began deflating to -4.2% in Feb 24. In Mar>May their $ grew, fell June, rose July, fell Aug>Dec, rose Jan, fell Feb>Mar. In Mar, $ are -4.5% vs 24 and only up vs Mar 21 & Ytd vs 21 & 19. Real sales are down vs Mar 21 & Ytd vs 21 & 19. Growth: -2.0%; Avg 19>25: +3.9%, Real: -0.6%. They show the cumulative impact of inflation and how deflation can be both positive and negative.

Relevant Retail – Less Auto, Gas and Restaurants – They account for ≈60% of Total Retail $ in a variety of channels, so they took many different paths through the pandemic. Their only down month until Feb 25 was April 2020, and they led the way in Total Retail’s recovery. Sales got on a roller coaster in 2022, but all months set new records with December reaching a new all-time high, $481B, and an annual record of $4.81T. In 2023, the roller coaster continued. A December lift set a new monthly record of $494.7B & an annual record of $4.997T. Sales fell Jan>Feb 24, rose in Mar, fell in Apr, rose in May, fell in June, rose Jul>Aug, fell Sep, rose Oct>Jan 25, fell in Feb, then rose in Mar. The Mar 3.4% YOY lift is 29% below their 92>24 avg of +4.8%. However, they are all positive again and 54% of their 47.0 % 19>25 growth is real – #1 in performance. Growth: 2.6%; Avg 19>25: +6.6%, Real: +3.8%. In 2024 their inflation rate dropped from 3.2% to 0.1%, stabilized at 0.5% Dec>Jan, then rose to 0.6% in Feb & 0.7% in Mar. Inflation is low but its cumulative impact slows growth and can even cause drops. We saw this in Feb>Mar. We’ll see what happens in the upcoming months.

Inflation has slowed, but its cumulative effect can be negative. In Feb, 6 actual YOY $ comparisons for all big groups were negative. In Mar, only 2 were down. In Feb, there were 8 real drops. In Mar, there were 6. In Feb, all were down in YOY lifts vs 24. In March, only Gas Stations were down, but the lifts for all but Auto were significantly below avg. Finally, in Feb, no big group was all positive in YOY comparisons. In Mar, Total & Relevant Retail were all positive. Relevant Retail has now been all positive in 8 of the last 10 months. February was very bad. March was markedly better, but the recovery is still slow.

Here’s a more detailed look at March by Key Channels (98% of Ytd Rel Retl $)

  • Relevant Retail: Growth: +2.6%; Avg: +6.6%, Real: +3.8%. All 11 were up from Feb. Vs Mar 24: 10 were up, Real: 9, Vs Mar 21: 6 were up, Real: 5. Vs 19: Only Dept Stores were down – both actually & really.
  • All Department Stores – This group was struggling before the pandemic hit them hard. They began recovery in March 2020. Sales are +12.6% from February but only their actual Ytd numbers vs 21 are positive. Their -5.5% Mar YOY drop is 20 times bigger than their -0.3% avg decrease. Growth: -4.0%; Avg 19>25: -0.4%, Real: -2.0%.
  • Club/SuprCtr/$- They fueled a big part of the recovery because they focus on value which has broad consumer appeal. $ales are +13.5% from Feb, and they are positive in all measurements. However, only 48.1% of their 39.5% 19>25 lift is real. Their 1.5% YOY Mar lift is -82% below their 92>24 avg of +8.4%. Growth: 2.8%; Avg 19>25: +5.7%, Real: +2.9%.
  • Grocery- They depend on frequent purchases so their changes are usually less radical. Actual $ are +8.6% from Feb and positive in all YOY comparisons. However cumulative inflation has hit them hard. Real $ are down vs Mar 24, Mar 21 & Ytd 21. Plus, only 10% of 19>25 growth is real. Their 1.0% YOY lift is -71% below avg. Growth: 2.2%; Avg 19>25: +4.9%, Real: +0.5%.
  • Health/Drug Stores – Many stores are essential, but consumers visit less frequently than Grocery stores. $ are +8.9% from Feb and they are positive in all comparisons. Inflation has been relatively low so 63% of their 31.4% 19>25 growth is real. Their +6.4% YOY lift vs Mar 24 is 25% above avg. Growth: 4.3%; Avg 19>25: +4.7%, Real: +3.1%
  • Clothing and Accessories – Clothes mattered less when you stayed home. That changed in March 2021 with strong growth through 2022. Actual Sales are +18.6% from Feb, and they are only really down vs Mar 21. 67% of their 19>25 growth is real. $ are +1.8% vs Mar 24, -67% below avg. Growth: 1.3%; Avg 19>25: +3.1%, Real:+2.1%
  • Home Furnishings – In mid-2020 consumers’ focus turned to their homes and furniture became a priority. Prices are still deflating but they were high in 22. $ are +9.8% from Feb and only actually down vs Mar 21. They are really down monthly & Ytd vs 21. Only 27% of their 19>25 growth is real. YOY Mar lift: +6.0%, 62% above avg. Growth: 4.9%; Avg 19>25: +3.1%, Real: +0.9%
  • Electronic & Appliances – This channel has had many issues. Sales fell in Apr>May of 2020 and didn’t reach 2019 levels until March 21. $ are +8.3% from Feb and they are only actually down vs Mar 21 & Ytd vs 24. Their strong deflation shows in high real numbers. Sales are +1.5% vs Mar 24, -41% below avg. Growth: -1.9%; Avg 19>25: 0.15%, Real: +3.4%.
  • Building Material, Farm & Garden & Hardware –They truly benefited from the consumers’ focus on home. In 2022 the lift slowed as inflation grew to double digits. Prices are deflating again, and sales are +26.8% from Feb. Actual $ are only up vs Mar 24 and Ytd 21 & 19. Real sales are only up vs Mar 24 and Ytd vs 24 & 19. Just 23% of their 19>25 sales growth is real. YOY sales vs Mar 24 were +4.2%, -7% below avg. Growth: -0.04%; Avg 19>25: +4.5%, Real: +1.1%.
  • Sporting Goods, Hobby and Book Stores – Consumers turned their attention to recreation and Sporting Goods stores sales took off. Book & Hobby Stores recovered more slowly. They have been on a sales rollercoaster since June and $ are+23.6% from Feb. Actual & real sales are only up vs Mar 24 & 19. Real Ytd sales vs 24 are also up. 84% of their 19>25 growth is real. YOY Sales vs Mar 24 are +0.1%, -98% below avg. Growth: -2.5%; Avg 19>25: +4.0%, Real: +3.4%.
  • All Miscellaneous Stores – Pet Stores have been a key part of the strong and growing recovery of this group. They finished 2020 at +0.9% but sales took off in March 21 and have continued to grow. Sales are +14.7% vs Feb and positive in all comparisons. They are 2nd in the % increases vs 19 & vs 21 and 73.9% of their 55.1% 19>25 growth is real. Plus, their 6.7% YOY Mar lift is 40% more than their 92>24 avg of +4.8%. Growth: +6.2%; Avg 19>25: +7.6%, Real: 5.9%.
  • NonStore Retailers – 90% of their $ales comes from Internet/Mail Order/TV. The pandemic accelerated online spending. They ended 2020 +21.4%. The growth continued in 2021 as sales exceeded $100B for the 1st time and they broke the $1 Trillion barrier. $ are +8.5% from Feb but their YOY lift of 6.1% is -38% below their 9.8% avg. However, they are positive in all comparisons and 82% of their 112.7% 19>25 growth is real. Growth: 4.2%; Avg 19>25: +13.4%, Real: +11.6%.

Note: Almost without exception, online sales by brick ‘n mortar retailers are recorded with their regular store sales.

Recap – The Retail recovery from the pandemic was largely driven by Relevant Retail and by the end of 2021 it had become very widespread. In 2022, there was a new challenge, the worst inflation in 40 years. Overall, inflation has slowed considerably from its June 22 peak and 7 channels are currently deflating (up from 5 in Feb). Any deflation can help the Retail Situation. As expected, $ rose from February for all 11 channels but the +12.1% lift for Relevant Retail was slightly below avg (-0.6%) and their +3.4% lift vs March 24 was -29% below avg. 10 of 11 smaller channels had a $ increase vs 24 but only 3 of those lifts were above avg. Also in February, no big groups and only 3 channels were both actually and really “all positive”. In March the situation was a little better. 2 big groups and 4 channels were all positive. Relevant Retail has now been all positive in 8 of the last 10 months. The biggest concern is still YOY drops and smaller lifts. This has become widespread. As expected,  $ales in March were up from February, but the monthly performance, especially YOY was still below par. The Retail Market recovery has restarted but progress is slow.

Finally, here are the details and updated inflation rates for the CPIs used to calculate the impact of inflation on retail groups5 and channels. This includes special aggregate CPIs created with the instruction and guidance of personnel from the US BLS. I also researched data from the last Economic Census to review the share of sales by product category for the various channels to help in selecting what expenditures to include in specific aggregates. Of course, none of these specially created aggregates are 100% accurate but they are much closer than the overall CPI or available aggregates. The data also includes the CPI changes vs 2021 to show cumulative inflation.

Monthly YOY CPI changes of 0.2% or more are highlighted. (Green = lower; Pink = higher)

Here are some answers to some obvious questions. Note: Overall Inflation slowed but grocery prices had a significant lift.

  1. Why is the group for Non-store different from the Internet?
    • Non-store is not all internet. It also includes Fuel Oil Dealers, the non-motor fuel Energy Commodity.
  2. Why is there no Food at home included in Non-store or Internet?
    • Online Grocery purchasing is becoming popular but almost all is from companies whose major business is brick ‘n mortar. These online sales are recorded under their primary channel.
  3. 6 Channels have the same CPI aggregate but represent a variety of business types.
    • They also have a wide range of product types. Rather than try to build aggregates of a multitude of small expenditure categories, it seemed better to eliminate the biggest, influential groups that they don’t sell. This method is not perfect, but it is certainly closer than any existing aggregate.
  4. Why are Grocery and Supermarkets only tied to the Grocery CPI?
    • According to the Economic Census, 76% of their sales comes from Grocery products. Grocery Products are the driver. The balance of their sales comes from a collection of a multitude of categories.
  5. What about Drug/Health Stores only being tied to Medical Commodities.
    • An answer similar to the one for Grocery/Supermarkets. However, in this case Medical Commodities account for over 80% of these stores’ total sales.
  6. Why do SuperCtrs/Clubs and $ Stores have the same CPI?
    • While the Big Stores sell much more fresh groceries, Groceries account for ¼ of $ Store sales. Both Channels generally offer most of the same product categories, but the actual product mix is different.

Retail Channel $ Update – January Monthly & February Advance

In February, YOY Commodities’ inflation slowed to 0.6% from 0.8%. Even with a low inflation rate, high cumulative inflation vs 21 can still impact consumer spending and slow $ales growth.  We saw more evidence of this in February. Total Retail $ were -0.9% vs 24, radically below the average 92>24 change of +4.9%. Relevant Retail was -0.2%, also far below the February average of +4.7%. The situation is complex, but the recovery has paused. We’ll continue to track the retail market with data from 2 reports provided by the Census Bureau and factor in a targeted CPI.

The Census Bureau Reports are the Monthly and the Advance Retail Sales Reports. Both are derived from sales data gathered from retailers across the U.S. and are published monthly at the same time. The Advance Report has a smaller sample size so it can be published quickly – about 2 weeks after month end. The Monthly Report includes data from all respondents, so it takes longer to compile the data – about 6 weeks. Although the sample size for the Advance report is smaller, the results over the years have proven it to be statistically accurate with the Monthly reports. The biggest difference is that the full sample in the Monthly report allows us to “drill” a little deeper into the retail channels.

We will begin with the January Monthly Report and then go to the February Advance Report. Our focus is comparing to last year but also 21 & 19. We’ll show both actual and the “real” change in sales as we factor inflation into the data.

Both reports include the following:     (Note: January Monthly data = Ytd)

  • Total Retail, Restaurants, Auto, Gas Stations and Relevant Retail (removing Restaurants, Auto and Gas)
  • Individual Channel Data – This is more detailed in the Monthly reports, and we’ll focus on Pet Relevant Channels.

The data will be presented in detailed charts to facilitate visual comparison between groups/channels. The charts will show 11 separate measurements. To save space they will be displayed in a stacked bar format for the channel charts.

  • Current Month change – % & $ vs previous month
  • Current Month change – % & $ vs same month last year and vs 2021.
    • Current Month Real change vs last year and vs 2021 – % factoring in inflation
  • Current Ytd change – % & $ for this year vs last year, 2021 & 2019.
    • Current Ytd Real change % for this year vs last year and vs 2021 and 2019
  • Monthly & Ytd $ & CPIs for this year vs last year and vs 2021 which are targeted by channel will also be shown. (CPI Details are at the end of the report)

First, the January Monthly. All were down from December but there were no actual YOY sales drops. We should note: Gas Stations are selling less product than in 2021 & 2019. They are the only group not “all positive”. Relevant Retail has been all positive in 11 of the last 14 months and now in 7 of the last 8. ($ are Not Seasonally Adjusted)

The January Monthly is $2.4B less than the Advance report. Restaurants: -$1.3B; Auto: -$0.9B; Gas Stations: +$0.3B Relevant Retail: -$0.5B. Relevant Retail was the driver in the $ales decrease vs December, but all big groups were down. A Dec>Jan decrease in Total Retail  has happened every year since 1992. However, the -16.8% drop was 21% less than average. There were no YOY drops in actual sales for the first time since January 2023. There were 2 “real” sales drops, the same as November, but all but Gas Stations were “all positive”. Restaurants still have the biggest increases vs 21 & 19 but Relevant Retail stayed at the top of “real” performance vs 2019. However, only 55% of their growth is real.

Now, let’s see how some Key Pet Relevant channels did in January (82% of Jan Rel Retl $)

Overall– All 11 were down from December. Vs Jan 24, 10 were actually and “really” up. Vs Jan 21, 10 were up but only 6 were real increases. Vs 2019, Only Off/Gift/Souv were actually & really down, but HomeCtr/Hdwe were also really down.

  • Building Material Stores – The pandemic focus on home has produced sales growth of 32.1% since 2019. Prices for the Bldg/Matl group have inflated 19.6% from 21 and 22.1% from 2019 which is having an impact. Sales vs December were -10.8% for HomeCtr/Hdwe and -14.1% for Farm Stores. Vs other years, all actual $ are up for both. HomeCtr/Hdwe are really down vs 21 & 19, but Farm stores are only really down vs 21. However, only 6% of the Building Materials group’s 19>25 lift was real. Avg 19>25 Growth: HomeCtr/Hdwe: 3.4%, Real: -0.01%; Farm: 5.0%, Real: 1.6%
  • Food & Drug – Both are truly essential. Except for the pandemic food binge buying, they tend to have smaller changes in $. In terms of inflation, the Grocery rate is now 17% lower than the rate for Drug/Med products. Drug Stores are positive in all measurements and 64% of their 2019>25 growth is real. Supermarkets’ actual $ are up in all measurements and they are only “really” down vs 2021. However, only 10.5% of their 19>25 increase is real growth. Avg 19>25 Growth: Supermarkets: +4.9%, Real: +0.6%; Drug Stores: +4.8%, Real: +3.2%.
  • Sporting Goods Stores – They also benefited from the pandemic in that consumers turned to self-entertainment, especially sports & outdoor activities. Sales are down -45% from December, and their only positives are vs 2019. Prices are still deflating, -3.8% vs 24. Deflation started in April 23 and is a big change from +1.1% in 22>23 and +7.9% in 21>22. The result is that 73.5% of their 41.2% lift since 2019 is real. Avg 19>25 Growth Rate is: +5.9%;Real: +4.5%.
  • Gen Mdse Stores – All actual & real sales were up for Club/SupCtrs & $ stores. Plus, even with an -34.7% decrease from December, Discount Dept Stores were only really down vs 2021. Now, 34% of their growth since 2019 is real. The other channels do better with an average of 53% in real growth. Avg 19>25 Growth: SupCtr/Club: 5.8%, Real: 3.2%; $/Value Strs: +5.6%, Real: +2.9%; Disc. Dept. Strs: +2.4%, Real: 0.8%.
  • Office, Gift & Souvenir Stores – After a +38.2% lift in December, Sales fell -32.4% in January. However, now they are only actually & really down vs 2019. All other comparisons are positive. Their recovery started late, but their progress may be slowly restarting again. Avg Growth Rate: -0.04%, Real: -1.5%
  • Internet/Mail Order – Sales are -26.8% from December but set a new January record of $108.4B. All measurements are positive, but their YOY growth, +2.8%, is only 19% of their average since 2019. However, 84.5% of their 126.8% growth since 2019 is real. Avg Growth: +14.6%, Real: +12.9%. As expected, they are by far the growth leader since 2019.
  • A/O Miscellaneous – Pet Stores are 22>24% of total $. In May 2020 they began their recovery which reached a record level of $100B for the first time in 2021. In 2022 their sales dipped in January, July, Sept>Nov, rose in December, fell in Jan>Feb 23, grew Mar>May, fell Jun>Aug, rose Sep>Nov, fell Dec>Jan 24, grew Feb>May, fell Jun>Sep, grew in Oct, fell in Nov, rose in Dec, fell in Jan. All measurements are again positive and they are in 2nd place, behind the Internet, in the % increase vs 19 and vs 21. Also, 80% of their 75.2% growth since 2019 is real. Average 19>25 Growth: +9.8%, Real: +8.1%

Jan had its usual drop vs Dec, but the Relevant Retail drop was 25% less than avg. All big & small channels were down. The YOY lift was 7% below avg for Total and 18% below for Relevant, but 10 smaller channels and all big groups were up. Prices are still deflating in 7 channels, but cumulative inflation is impacting $ as only 6 channels were really up vs Jan 21. The Retail Recovery is still slow. The Jan commodities CPI was 0.8% but slowed to 0.6% in Feb. Let’s see if it impacts Retail.

Jan>Feb sales were down for all but Auto. A Jan>Feb Total Retail decrease has happened in 64% of the years since 1992 but the -4.0% drop is 8 times the -0.5% avg. There were 6 YOY $ drops. There were none in January. $ for all Big Groups were down vs Feb 24. The Total Retail drop of -0.9% vs Feb 24 was very different from their +4.9% 92>24 avg change. The Relevant Retail drop of -0.2% vs 24, was also much worse than their +4.7% avg. Inflation is still a factor. The CPI for all commodities slowed to 0.6% but it is 18.1% vs 21. The inflation surge was just beginning back then. There is some other “real” bad news. 8 measurements were “really” down. In January, there were only 2 – both from Gas Stations. Also in January, all but Gas Stations were YOY all positive. In February, there were no “all positives”. However, Relevant Retail has still been all positive in 7 of the last 9 months.

Overall – Inflation Reality– For Total Retail, inflation fell to +0.6% from 0.8% but sales were -0.9% vs 24. For Restaurants, inflation grew to +3.7% and their sales fell -2.3% vs 24. Gas prices fell, but $ales were -4.4%. That group is still in turmoil. Auto inflation slowed to 0.1% but it is still +19.8% vs 21. Their sales fell -0.9% vs 24. Inflation rose slightly to 0.6% from 0.5% for Relevant Retail. Their sales fell -0.2% and they are no longer all positive. Their slow recovery has paused.

Total Retail – Since Jun 20, every month but Apr 23, Jun 24 & now Feb 25 has set a monthly $ales record. In 2023>24, Sales were on a roller coaster. Up Jul>Aug, down Sept, up Oct>Dec, down Jan 24, up Feb>Mar, down April, up May, down Jun, up Jul>Aug, down in Sep, up Oct>Jan 25, down in Feb. Prices are +0.6% but YOY sales are -0.9%, far below the 92>24 avg change of +4.9%. However, 41.6% of the 19>25 growth is real, up from 39%. Inflation is low but cumulative inflation is still having an impact. Growth: 24>25: 1.8%; Avg 19>25: +6.6%, Real: +3.6%.

Restaurants – They were hit hard by the pandemic and didn’t begin recovery until March 2021. However, they have had strong growth since then, exceeding $1T for the 1st time in 2023. February $ are down vs 24 but they have the biggest lifts vs 21 & 19. Inflation rose to 3.7% in February and is now +25.0% vs 21 and +30.0% vs 19. Their -2.3% YOY drop is far below their +5.9% 92>24 avg. Plus, just 35.9% of their 56.5% growth since 2019 is real and they remain 3rd in performance behind Relevant & Total Retail. Recovery started late but inflation started early. Growth: 1.5%; Avg 19>25:+7.7%, Real: +3.1%. They just account for 13.6% of Total Retail $, but their strong growth has helped Total Retail.

Auto (Motor Vehicle & Parts Dealers) – They worked to overcome the stay-at-home attitude with great deals and advertising. They finished 2020 up 1% vs 2019 and hit a record $1.48T in 2021 but much of it was due to skyrocketing inflation. In 22, sales got on a rollercoaster. Inflation started to drop mid-year, but it caused 4 down months in actual $. Their YE real 2022 sales numbers were even worse, -8.2% vs 21 and -8.9% vs 19. 2023 started a true sales rollercoaster but the $ set a new record, $1.595T. $ fell in Jan 24, grew Feb>Mar, fell Apr, grew May, fell June, grew Jul>Aug, fell Sep, grew Oct, fell Nov, grew Dec, fell Jan, then grew in Feb. Feb $ were up vs Jan but -0.7% vs 24. (Avg Feb Chge: +4.9%). All other comparisons are positive, but only 31.8% of 19>25 growth is real. Growth: 2.6%; Avg 19>25: +5.9%, Real: +2.1%

Gas Stations – Gas Stations were hit hard by “stay at home”. They started recovery in Mar 21 and inflation began. Sales got on a rollercoaster in 22 but set a record, $583B. Inflation started to slow in Aug and prices slightly deflated in Dec & Feb 23, then strongly fell in Mar>Jul to -20.2%. In Aug they rose to -3.7%. In Sep they were +2.7% but began deflating to -4.2% in Feb 24. In Mar>May they grew, fell June, rose July, fell Aug>Dec, rose Jan, fell Feb. In Feb, actual $ are -4.4% vs 24 but up vs 21 & 19. Real sales are down vs Feb 24 & Ytd vs 21 & 19. (avg Feb chge: +5.5%). Growth: -0.8%; Avg 19>25: +4.3%, Real: -0.8%. They show the cumulative impact of inflation and how deflation can be both positive and negative.

Relevant Retail – Less Auto, Gas and Restaurants – They account for ≈60% of Total Retail $ in a variety of channels, so they took many different paths through the pandemic. Their only down month until Feb 25 was April 2020, and they led the way in Total Retail’s recovery. Sales got on a roller coaster in 2022, but all months set new records with December reaching a new all-time high, $481B, and an annual record of $4.81T. In 2023, the roller coaster continued. A December lift set a new monthly record of $494.7B & an annual record of $4.997T. Sales fell Jan>Feb 24, rose in Mar, fell in Apr, rose in May, fell in June, rose Jul>Aug, fell Sep, rose Oct>Jan 25, then fell in Feb. The Feb -0.2% YOY drop is a big change from their 92>24 avg of +4.7%. However, 55% of their 46.9 % 19>25 growth is real – #1 in performance. Growth: 1.9%; Avg 19>25: +6.6%, Real: +3.8%. In 2024 their inflation rate dropped from 3.2% to 0.1%, stabilized at 0.5% Dec>Jan, then rose to 0.6% in February. Inflation is low but its cumulative impact continues to slow growth and even cause drops. We saw this in February. We’ll see what happens in the upcoming months.

In 24>25 inflation has slowed, but its cumulative effect still has a negative impact. In Jan, all actual YOY $ comparisons for all big groups were positive. In Feb, 6 were down. In Jan, there were only 2 real drops. In Feb, there were 8. In Jan YOY lifts vs 24, Total Retails was +4.4% and all groups were over +2.9%. In Feb, all were down vs 24, a big contrast to an avg lift over 4.7% for all. Finally, in January, 4 big groups were all positive in YOY comparisons. In Februar, none were all positive, even Relevant Retail (All positive in 7 of the last 9 months). February was very bad. The slow retail recovery has paused.

Here’s a more detailed look at February by Key Channels (98% of Ytd Rel Retl $)

  • Relevant Retail: Growth: +1.9%; Avg: +6.6%, Real: +3.8%. 10 were down from Jan. Vs Feb 24: 6 were up, Real: 5, Vs Feb 21: 10 were up, Real: 9. Vs 19: Dept Stores were actually & really down. Plus, Electronics/Appl were actually down.
  • All Department Stores – This group was struggling before the pandemic hit them hard. They began recovery in March 2020. Sales are -2.4% from January and only their actual & real numbers vs 21 are positive. Their -7.5% Feb YOY drop is 19 times bigger than their -0.4% avg decrease. Growth: -3.2%; Avg 19>25: -0.003%, Real: -1.6%.
  • Club/SuprCtr/$- They fueled a big part of the recovery because they focus on value which has broad consumer appeal. $ales are -3.9% from Jan, but they are positive in all measurements. However, only 49.5% of their 40.6% 19>25 lift is real. Their 1.2% YOY lift is -85% below their 92>24 avg of +8.3%. Growth: 3.7%; Avg 19>25: +5.8%, Real: +3.1%.
  • Grocery- They depend on frequent purchases, so their changes are usually less radical. Actual $ are -8.7% from Jan but positive in all YOY comparisons. However cumulative inflation has hit them hard. Real $ are down vs 21 & Feb 24. Plus, only 12% of 19>25 growth is real. Their 0.5% YOY lift is -84% below avg. Growth: 2.8%; Avg 19>25: +5.0%, Real: +0.7%.
  • Health/Drug Stores – Many stores are essential, but consumers visit less frequently than Grocery stores. $ are -6.5% from Jan but they are positive in all comparisons. Inflation has been relatively low so 61% of their 31.1% 19>25 growth is real. Their +2.5% YOY lift vs Feb 24 is -51% below avg. Growth: 3.4%; Avg 19>25: +4.6%, Real: +2.9%
  • Clothing and Accessories – Clothes mattered less when you stayed home. That changed in March 2021 with strong growth through 2022. Actual Sales are +5.9% from Jan and only down vs Feb 24, -3.2%. Their avg Feb YOY change is +3.5%. Real sales are down vs 24 but 72% of their 19>25 growth is real. Growth: 0.5%; Avg 19>25: +3.3%, Real:+2.5%
  • Home Furnishings – In mid-2020 consumers’ focus turned to their homes and furniture became a priority.5. Prices are still deflating but they were high in 22. Sales are -1.3% from Jan but only “really” negative vs 21. However, only 31% of their 19>25 growth is real. YOY Feb lift: +1.5%, -54% below avg. Growth: 3.8%; Avg 19>25: +3.2%, Real: +1.0%
  • Electronic & Appliances – This channel has had many issues. Sales fell in Apr>May of 2020 and didn’t reach 2019 levels until March 21. $ are -8.0% from Jan and they are only positive vs 21 & “really” vs 19. They have had strong deflation and it shows. Sales are -9.2% vs Feb 24. The avg Feb change is +2.6%. Growth: -4.7%; Avg 19>25: -0.05%, Real: +3.2%.
  • Building Material, Farm & Garden & Hardware –They truly benefited from the consumers’ focus on home. In 2022 the lift slowed as inflation grew to double digits. Prices stopped deflating and sales are -3.7% from Jan. Actual sales are only up vs 21 & 19 and Real sales are only up vs 19. Just 17% of their 19>25 sales growth is real. YOY sales vs Feb 24 were down -5.8%. The avg Feb change is +4.5%. Growth: -2.5%; Avg 19>25: +4.2%, Real: +0.8%.
  • Sporting Goods, Hobby and Book Stores – Consumers turned their attention to recreation and Sporting Goods stores sales took off. Book & Hobby Stores recovered more slowly. They have been on a sales rollercoaster since June and $ are -6.7% from Jan but actual and real sales vs 21 & 19 are now positive. Plus, 82% of their 19>25 growth is real. YOY Sales vs Feb 24 are -5.8%. Their 92>24 avg Feb change is +3.0%. Growth: -3.8%; Avg 19>25: +3.9%, Real: +3.2%.
  • All Miscellaneous Stores – Pet Stores have been a key part of the strong and growing recovery of this group. They finished 2020 at +0.9% but sales took off in March 21 and have continued to grow. Sales are -4.5% vs Jan but positive in all comparisons. They are 2nd in the % increases vs 19 & vs 21. 73.3% of their 51.7% 19>25 growth is real. However, their 0.6% YOY Feb lift is -84% below their 92>24 avg of +4.2%. Growth: +4.4%; Avg 19>25: +7.2&%, Real: 5.5%.
  • NonStore Retailers – 90% of their $ comes from Internet/Mail Order/TV. The pandemic accelerated online spending. They ended 2020 +21.4%. The growth continued in 2021 as sales exceeded $100B for the 1st time and they broke the $1 Trillion barrier. $ are -7.0% from Jan and their YOY lift of 1.7% is -83% below their 9.7% avg. However, they are positive in all comparisons and 82% of their 109.3% 19>25 growth is real. Growth: 2.2%; Avg 19>25: +13.1%, Real: +11.3%.

Note: Almost without exception, online sales by brick ‘n mortar retailers are recorded with their regular store sales.

Recap – The Retail recovery from the pandemic was largely driven by Relevant Retail and by the end of 2021 it had become very widespread. In 2022, there was a new challenge, the worst inflation in 40 years. Overall, inflation has slowed considerably from its June 22 peak and 6 channels are currently deflating (down from 7 in Jan). Any deflation can help the Retail Situation. As expected, $ fell from January for 10 of 11 channels but the -5.5% drop for Relevant Retail was 2.75 times more than avg. Their -0.2% drop vs Feb 24 was a big change from their +4.7% avg. 6 of 11 smaller channels had a $ increase vs 24 but none of those lifts was above avg. Also in January, 4 big groups and 6 channels were both actually and really “all positive”. In February, there were only 3 – NonStore, Miscellaneous & Club/SupCtr/$. Even with this change, Relevant Retail has been all positive in 7 of the last 9 months. The biggest concern are YOY drops and smaller lifts. This has become widespread. As expected, February $ were less than January, but its performance, especially YOY was markedly worse. It looks like the Retail Market has paused in its slow recovery.

Finally, here are the details and updated inflation rates for the CPIs used to calculate the impact of inflation on retail groups and channels. This includes special aggregate CPIs created with the instruction and guidance of personnel from the US BLS. I also researched data from the last Economic Census to review the share of sales by product category for the various channels to help in selecting what expenditures to include in specific aggregates. Of course, none of these specially created aggregates are 100% accurate but they are much closer than the overall CPI or available aggregates. The data also includes the CPI changes vs 2021 to show cumulative inflation.

Monthly YOY CPI changes of 0.2% or more are highlighted. (Green = lower; Pink = higher)

Here are some answers to some obvious questions. Note: Overall Inflation slowed and there is more pricing stability.

  1. Why is the group for Non-store different from the Internet?
    • Non-store is not all internet. It also includes Fuel Oil Dealers, the non-motor fuel Energy Commodity.
  2. Why is there no Food at home included in Non-store or Internet?
    • Online Grocery purchasing is becoming popular but almost all is from companies whose major business is brick ‘n mortar. These online sales are recorded under their primary channel.
  3. 6 Channels have the same CPI aggregate but represent a variety of business types.
    • They also have a wide range of product types. Rather than try to build aggregates of a multitude of small expenditure categories, it seemed better to eliminate the biggest, influential groups that they don’t sell. This method is not perfect, but it is certainly closer than any existing aggregate.
  4. Why are Grocery and Supermarkets only tied to the Grocery CPI?
    • According to the Economic Census, 76% of their sales comes from Grocery products. Grocery Products are the driver. The balance of their sales comes from a collection of a multitude of categories.
  5. What about Drug/Health Stores only being tied to Medical Commodities.
    • An answer similar to the one for Grocery/Supermarkets. However, in this case Medical Commodities account for over 80% of these stores’ total sales.
  6. Why do SuperCtrs/Clubs and $ Stores have the same CPI?
    • While the Big Stores sell much more fresh groceries, Groceries account for ¼ of $ Store sales. Both Channels generally offer most of the same product categories, but the actual product mix is different.

Retail Channel $ Update – December Monthly & January Advance

In January, YOY Commodities’ inflation rose to 0.8% from 0.3%. Even with a low inflation rate, high cumulative inflation vs 21 can still impact consumer spending and slow $ales growth.  We saw some evidence of this in January. Total Retail $ were +4.81% vs 24, 0.9% above the average 92>24 lift but Relevant Retail was +4.0%, -15.5% below the January average. The situation is mixed and complex and there is still a long road to full recovery. We’ll continue to track the retail market with data from 2 reports provided by the Census Bureau and factor in a targeted CPI.

The Census Bureau Reports are the Monthly and the Advance Retail Sales Reports. Both are derived from sales data gathered from retailers across the U.S. and are published monthly at the same time. The Advance Report has a smaller sample size so it can be published quickly – about 2 weeks after month end. The Monthly Report includes data from all respondents, so it takes longer to compile the data – about 6 weeks. Although the sample size for the Advance report is smaller, the results over the years have proven it to be statistically accurate with the Monthly reports. The biggest difference is that the full sample in the Monthly report allows us to “drill” a little deeper into the retail channels.

We will begin with the December Monthly Report and then go to the January Advance Report. Our focus is comparing to last year but also 21 & 19. We’ll show both actual and the “real” change in sales as we factor inflation into the data.

Both reports include the following:     (Note: December Ytd data = Year-End, Annual Numbers & January monthly data = 2025 Ytd)

  • Total Retail, Restaurants, Auto, Gas Stations and Relevant Retail (removing Restaurants, Auto and Gas)
  • Individual Channel Data – This is more detailed in the Monthly reports, and we’ll focus on Pet Relevant Channels.

The data will be presented in detailed charts to facilitate visual comparison between groups/channels. The charts will show 11 separate measurements. To save space they will be displayed in a stacked bar format for the channel charts.

  • Current Month change – % & $ vs previous month
  • Current Month change – % & $ vs same month last year and vs 2021.
    • Current Month Real change vs last year and vs 2021 – % factoring in inflation
  • Current Ytd change – % & $ for this year vs last year, 2021 & 2019.
    • Current Ytd Real change % for this year vs last year and vs 2021 and 2019
  • Monthly & Ytd $ & CPIs for this year vs last year and vs 2021 which are targeted by channel will also be shown. (CPI Details are at the end of the report)

First, the December Monthly. Only Relevant & Total were up from November and there were 3 actual sales drops –  all in Gas Stations. We should note: Gas Stations are still selling less product than in 2019. Also, Relevant Retail is all positive again. They have been all positive in 10 of the last 13 months and now in 6 of the last 7. ($ are Not Seasonally Adjusted)

The December Monthly is $4.9B more than the Advance report. Restaurants: +$0.9B; Auto: -$0.1B; Gas Stations: +$0.3B Relevant Retail: +$3.7B. Relevant Retail was the driver in the $ales lift vs November, but only Gas Stations were down. A Nov>Dec increase in Total Retail  has happened every year since 1992. However, the 8.6% lift was 41% below average. There were 3 drops in actual sales – Monthly vs 23 & 21 and Ytd vs 23 for Gas Stations. There were 3 “real” sales drops, 1 more than November. All but Gas Stations & Restaurants were all positive. Restaurants still have the biggest increases vs 21 & 19 but Relevant Retail stayed at the top of “real” performance vs 2019. However, only 51% of their growth is real.

Now, let’s see how some Key Pet Relevant channels did in December in the Stacked Bar Graph Format

Overall– 10 of 11 were up from November. Vs Dec 23, 10 were actually and “really” up. Vs Dec 21, 6 were up but only 5 were real increases. Vs 2019, All were actually up and only Off/Gift/Souv and Disc Dept Stores were really down.

  • Building Material Stores – The pandemic focus on home has produced sales growth of 32.1% since 2019. Prices for the Bldg/Matl group have inflated 9.3% from 2021 and 21.5% from 2019 which is having an impact. Sales vs November were -9.4% for HomeCtr/Hdwe but +5.5% for Farm Stores. Vs other years, HomeCtr/Hdwe are only actually & really down vs Dec 23, but Farm stores are actually and really down in all comparisons but vs Dec 23 & 2019. Only 27% of the Building Materials group’s 19>24 lift was real. Avg 19>24 Growth: HomeCtr/Hdwe: 5.6%, Real: 1.5%; Farm: 6.5%, Real: 2.4%
  • Food & Drug – Both are truly essential. Except for the pandemic food binge buying, they tend to have smaller changes in $. In terms of inflation, the Grocery rate is now 3.6 times higher than the rate for Drug/Med products. Drug Stores are positive in all measurements and 67% of their 2019>24 growth is real. Supermarkets’ actual $ are up in all measurements and they are only “really” down vs 2021. However, only 6.5% of their 19>24 increase is real growth. Avg 19>24 Growth: Supermarkets: +5.3%, Real: +0.4%; Drug Stores: +5.4%, Real: +3.8%.
  • Sporting Goods Stores – They also benefited from the pandemic in that consumers turned to self-entertainment, especially sports & outdoor activities. Sales are up 41% from November but their only other positives are vs Dec 23 & Ytd vs 19. Prices are still deflating, -2.0% vs 23. Deflation started in April 23 and is a big change from +1.1% in 22>23 and +7.9% in 21>22. The result is that 61% of their 34.5% lift since 19 is real. Avg 19>24 Growth Rate is: +6.1%; Real: +3.9%.
  • Gen Mdse Stores – All actual & real sales were up for Club/SupCtrs & $ stores. However, even with an 28.0% increase from November, Discount Dept Stores were only actually up vs 19. All of their real measurements are negative so none of their growth since 2019 is real. The other channels average 44% in real growth. Avg 19>24 Growth: SupCtr/Club: 6.0%, Real: 2.8%; $/Value Strs: +6.4%, Real: +3.2%; Disc. Dept. Strs: +1.2%, Real: -0.8%.
  • Office, Gift & Souvenir Stores – After a big drop in November, Sales rose 38.8% in December. They are only actually up vs Dec 23 & Ytd vs 19 and all of their real sales numbers, but vs Dec 23 are negative. Their recovery started late, and their progress slowed but may be restarting again. Avg Growth Rate: +0.003%, Real: -1.9%
  • Internet/Mail Order – Sales are +13.9% from November and set a new monthly record of $147.7B. All measurements are positive, but their Ytd growth, +10.3%, is still only 66% of their average since 2019. However, 82.0% of their 106.7% growth since 2019 is real. Avg Growth: +15.6%, Real: +13.4%. As expected, they are by far the growth leader since 2019.
  • A/O Miscellaneous – Pet Stores are 22>24% of total $. In May 2020 they began their recovery which reached a record level of $100B for the first time in 2021. In 2022 their sales dipped in January, July, Sept>Nov, rose in December, fell in Jan>Feb 23, grew Mar>May, fell Jun>Aug, rose Sep>Nov, fell Dec>Jan 24, grew Feb>May, fell Jun>Sep, grew in Oct, fell in Nov, then rose in Dec. All measurements are again positive and they are in 2nd place, behind the Internet, in the % increase vs 19 and vs 21. Also, 73% of their 53.2% growth since 2019 is real. Average 19>24 Growth: +8.9%, Real: +6.8%

December had its usual lift vs November, but the Relative Retail lift was -43% below avg. However, 10 small channels were up. The YOY lift was avg for Total, but 20% above avg for Relevant. Also, 10 smaller channels and 4 of 5 big groups were up. Prices are still deflating in 7 channels, but cumulative inflation is impacting $ as only 5 channels were really up vs Dec 21. The Retail Recovery is still slow. The December commodities CPI was 0.3% but rose to 0.8% in January. Let’s see if it impacts Retail.

Dec>Jan sales were down for all. A Dec>Jan Total Retail decrease has happened every year since 1992 but the  -16.5% drop is -23% less than average. All YOY $ comparisons are positive for the first time since Jan 23. The Total Retail lift of 4.8% vs January 24 was 0.9% above their 92>24 average but the Relevant Retail lift vs Jan 24 was -15.5% below average. The Gas Station lift was also below average (-54%). However, the YOY lifts for Restaurants (+24% vs avg ) & Auto (+47% vs avg) were both significantly above average. Inflation is still a factor. The CPI for all commodities rose to 0.8% but it is 18.5% vs 21. The inflation surge was just beginning back then. There is some other “real” news. Only 2 measurements were “really” down. In December, there were 3 but back in September there were 5. All but Gas Stations were YOY all positive. After 2 months with a negative, Relevant Retail has now been all positive in 8 of the last 9 months.

Overall – Inflation Reality – For Total Retail, inflation rose to +0.8% but YOY sales grew 4.8% vs 24. For Restaurants, inflation remains high, +3.3% but their sales rose 6.9% vs 24. Gas prices rose and that group is still in turmoil. Auto prices stopped deflating but their sales grew +6.8% vs Jan 24 and they are again all positive. Inflation remained stable at 0.5% for Relevant Retail and YOY sales are still all positive. Their slow progress continues.

Total Retail – Since June 20, every month but April 23 & June 24 has set a monthly sales record. In 2023>24, Sales were on a roller coaster. Up Jul>Aug, down Sept, up Oct>Dec, down Jan 24, up Feb>Mar, down April, up May, down June, up Jul>Aug, down in Sep, up in Oct>Jan 25. Prices are now +0.8% but YOY sales are up 0.9% above the 92>24 average. The lift is still -27% below the 19>25 avg. but now 50.9% of the 19>25 growth is real, up from 39.1%. Low inflation is helping but cumulative inflation is still having an impact. Growth: 24>25: 4.8%; Avg 19>25: +6.6%, Real: +3.6%.

Restaurants – They were hit hard by the pandemic and didn’t begin recovery until March 2021. However, they have had strong growth since then, exceeding $1T for the 1st time in 2023. January $ are up vs 24 and they have the biggest lifts vs 23, 21 & 19. Inflation slowed to 3.3% in January but is still +24.6% vs 21 and +29.8% vs 19. Their 6.9% YOY lift is 24% above their 92>24 avg but -16% below 19>25. Plus, just 39.2% of their 60.9% growth since 2019 is real and they remain 3rd in performance behind Relevant & Total Retail. Recovery started late but inflation started early. Growth: 6.9%; Avg 19>25:+8.2%, Real: +3.6%. They just account for 13.6% of Total Retail $, but their strong growth has helped Total Retail.

Auto (Motor Vehicle & Parts Dealers) – They worked to overcome the stay-at-home attitude with great deals and advertising. They finished 2020 up 1% vs 2019 and hit a record $1.48T in 2021 but much of it was due to skyrocketing inflation. In 22, sales got on a rollercoaster. Inflation started to drop mid-year, but it caused 4 down months in actual $. Their YE real 2022 sales numbers were even worse, -8.2% vs 21 and -8.9% vs 19. 2023 started a true sales rollercoaster but the $ set a new record, $1.595T. $ fell in Jan 24, grew Feb>Mar, fell Apr, grew May, fell June, grew Jul>Aug, fell Sep, grew Oct, fell Nov, then grew in Dec>Jan 25. Jan $ were +6.8% vs 24, 47% above avg & 10% above 19>25. All comparisons are positive, but only 34.1% of 19>25 growth is real. Growth: 6.8%; Avg 19>25: +6.2%, Real: +2.3%

Gas Stations – Gas Stations were hit hard by “stay at home”. They started to recover in Mar 21 and inflation began. Sales got on a rollercoaster in 22 but set a record, $583B. Inflation started to slow in Aug and prices slightly deflated in Dec & Feb 23, then strongly fell in Mar>Jul to -20.2%. In Aug they rose to -3.7%. In Sep they were +2.7% but began deflating to -4.2% in Feb 24. In Mar>May they grew, fell June, rose July, fell Aug>Dec, then rose in Jan. In Jan, actual $ are up in all comparisons vs 24, 21 & 19. Real sales are down vs 21 & 19. Their Jan lift is -54% below avg and -47% below 19>25.  Growth: 2.4%; Avg 19>25: +4.5%, Real: -0.8%. They show the cumulative impact of inflation and how deflation can be both a positive and a negative.

Relevant Retail – Less Auto, Gas and Restaurants – They account for ≈60% of Total Retail $ in a variety of channels, so they took many different paths through the pandemic. However, their only down month was April 2020, and they led the way in Total Retail’s recovery. Sales got on a roller coaster in 2022, but all months set new records with December reaching a new all-time high, $481B, and an annual record of $4.81T. In 2023, the roller coaster continued. A December lift set a new monthly record of $494.7B & an annual record of $4.997T. Sales fell in Jan>Feb 24, rose in Mar, fell in Apr, rose in May, fell in June, rose Jul>Aug, fell Sep, then rose Oct>Jan 25. The Jan 4.0% YOY lift is -15.5% below their 92>24 avg and -39% below 19>25. However, 55% of their 47.0% 19>24 growth is real – #1 in performance. Growth: 4.0%; Avg 19>25: +6.6%, Real: +3.9%. In 2024 their inflation rate dropped from 3.2% to 0.1% and stabilized at 0.5% Dec>Jan but its cumulative impact continues to slow growth. We see this in January. We’ll see what happens in the upcoming months.

In 24>25 inflation has slowed, but its cumulative effect has produced a mixed bag. Actual sales comparisons for all big groups are all positive for the 1st time since Jan 23. In January, there were only 2 real drops – both from Gas Stations. In YOY lifts Total Retail’s Jan 4.8% lift was +0.9% above avg. Restaurants were +24% & Auto +47% vs avg. Gas Stations were -54% vs avg and Relevant Retail’s was -15.5% below avg. All $ comparisons – actual & real are positive for all but Gas Stations. (now 8 of 9 months for Rel. Rtl) Overall, January was pretty good. The slow recovery continues.

Here’s a more detailed look at January by Key Channels in the Stacked Bar Graph Format

  • Relevant Retail: Growth: +4.0%; Avg: +6.6%, Real: +3.9%. 11 were down from Dec. Vs Jan 24: 10 were up, Real: 10, Vs Jan 21: 10 were up, Real: 6. Vs 19: Only Dept Stores were really down.
  • All Department Stores – This group was struggling before the pandemic hit them hard. They began recovery in March 2020. Sales are -44.4% from December but only their real numbers vs 21 & 19 are negative. Their Jan 1.4% is much more than the -0.4% avg. and it is 2.3 times bigger than the 19>25 avg.  Growth: 1.4%; Avg 19>25: 0.6%, Real: -0.9%.
  • Club/SuprCtr/$- They fueled a big part of the recovery because they focus on value which has broad consumer appeal. $ales are -21.2% from Dec, but they are positive in all measurements. However, only 50% of their 39.9% 19>25 lift is real. Their 5.8% lift is -30% below their 92>24 avg. but equal to 19>25. Growth: 5.8%; Avg 19>25: +5.8%, Real: +3.1%.
  • Grocery- These stores depend on frequent purchases, so their changes are usually less radical. Actual $ are -3.1% from Dec but positive in all comparisons. However cumulative inflation has hit them hard. Real $ are down vs 21 and only 10% of 19>25 growth is real. Their 5.2% lift is 66% above avg & +6% vs 19>25. Growth: 5.2%; Avg 19>25: +4.9%, Real: +0.5%.
  • Health/Drug Stores – Many stores are essential, but consumers visit less frequently than Grocery stores. $ are -11.3% from Dec but they are positive in all comparisons. Inflation has been relatively low so 63% of their 31.9% 19>25 growth is real. Their YOY lift is -11% below avg and -2% below 19>25. Growth: 4.6%; Avg 19>25: +4.7%, Real: +3.1%
  • Clothing and Accessories – Clothes mattered less when you stayed home. That changed in March 2021 with strong growth through 2022. Sales are -51.8% from Dec but all sales comparisons are positive. 54% of their 19>24 growth is real. Their 3.6% YOY lift is 7% above avg but only equal to 19>25.  Growth: 3.6%; Avg 19>25: +3.6%, Real:+2.7%
  • Home Furnishings – In mid-2020 consumers’ focus turned to their homes and furniture became a priority. Prices are still deflating but they were high in 22. Sales are -16.8% from Dec but only really negative vs 21. However, only 28% of their 19>25 growth is real. YOY lift: 58% above avg & 73% above 19>25. Growth: 5.2%; Avg 19>25: +3.0%, Real: +0.9%
  • Electronic & Appliances – This channel has had many issues. Sales fell in Apr>May of 2020 and didn’t reach 2019 levels until March 21. $ are -31.6% from Dec but they are now positive in all comparisons. They have had strong deflation and their 25 growth is only 0.2%, -90% below avg, but more than 19>25 (0%). Growth: 0.2%; Avg 19>25: +0.0%, Real: +3.3%.
  • Building Material, Farm & Garden & Hardware –They truly benefited from the consumers’ focus on home. In 2022 the lift slowed as inflation grew to double digits. Prices are still deflating, but sales are -10.2% from Dec. Actual sales are all positive and Real sales are only down vs 21, but just 5% of their 19>25 sales growth is real. Their 24>25 sales lift is -84% below avg and -81% below 19>25. Growth: 0.7%; Avg 19>25: +3.6%, Real: +0.2%.
  • Sporting Goods, Hobby and Book Stores – Consumers turned their attention to recreation and Sporting Goods stores sales took off. Book & Hobby Stores recovered more slowly. They have been on a sales rollercoaster since June but $ are -43.6% from Dec and only actual and real sales vs 19 are positive. However, 77% of their 19>25 growth is real. Sales are  -4.3% vs 24. Their 92>24 avg Jan lift is 2.9%. 19>25 is 3.4%. Growth: -4.3%; Avg 19>25: +3.4%, Real: +2.6%.
  • All Miscellaneous Stores – Pet Stores have been a key part of the strong and growing recovery of this group. They finished 2020 at +0.9% but sales took off in March 21 and have continued to grow. Sales are -14.8% vs Dec but positive in all comparisons. They are 2nd in the % increases vs 19 & vs 21. 74.3% of their 51.3% 19>25 growth is real. Their 6.6% YOY lift is 52% above their 92>24 avg, but -7% below 19>25. Growth: +6.6%; Avg 19>25: +7.1%, Real: 5.5%.
  • NonStore Retailers – 90% of their $ comes from Internet/Mail Order/TV. The pandemic accelerated online spending. They ended 2020 +21.4%. The growth continued in 2021 as sales exceeded $100B for the 1st time and they broke the $1 Trillion barrier. $ are -23.3% from Dec. Their YOY lift is -60% below their avg and -71% below 19>25. They are positive in all comparisons and 83% of their 111.6% 19>25 growth is real. Growth: 3.8%; Avg 19>25: +13.3%, Real: +11.6%.

Note: Almost without exception, online sales by brick ‘n mortar retailers are recorded with their regular store sales.

Recap – The Retail recovery from the pandemic was largely driven by Relevant Retail and by the end of 2021 it had become very widespread. In 2022, there was a new challenge, the worst inflation in 40 years. Overall, inflation has slowed considerably from its June 22 peak and 7 channels are currently deflating. Any deflation should help the Retail Situation. As expected, $ fell from December for all 11 channels but the -21.5% drop for Relevant Retail was 25% less than avg. Their 4.0% lift vs Jan 24 was 15.5% below avg, but 10 of 11 smaller channels had a $ increase and sold more product. 5 of those lifts were above avg. Perhaps the best news is that all big groups & 10 smaller channels were positive in all actual sales comparisons. Factoring inflation into the numbers, 4 big groups and 6 channels were “all positive”. Relevant Retail has now been all positive in 8 of the last 9 months. The biggest negative is the smaller lift by Relevant Retail. However, it is primarily being driven by a few larger channels – NonStore, SuprCtr/Clubs/$ & Bldg Matl/Farm. Overall, January sales were much lower than December, but the performance shows that the recovery continues.

Finally, here are the details and updated inflation rates for the CPIs used to calculate the impact of inflation on retail groups and channels. This includes special aggregate CPIs created with the instruction and guidance of personnel from the US BLS. I also researched data from the last Economic Census to review the share of sales by product category for the various channels to help in selecting what expenditures to include in specific aggregates. Of course, none of these specially created aggregates are 100% accurate but they are much closer than the overall CPI or available aggregates. The data also includes the CPI changes since 2021 to show cumulative inflation.

Monthly YOY CPI changes of 0.2% or more are highlighted. (Green = lower; Pink = higher)

Here are some answers to some obvious questions. ALSO NOTE: 4 of the 8 January “pinks” are just slowed deflation

  1. Why is the group for Non-store different from the Internet?
    • Non-store is not all internet. It also includes Fuel Oil Dealers, the non-motor fuel Energy Commodity.
  2. Why is there no Food at home included in Non-store or Internet?
    • Online Grocery purchasing is becoming popular but almost all is from companies whose major business is brick ‘n mortar. These online sales are recorded under their primary channel.
  3. 6 Channels have the same CPI aggregate but represent a variety of business types.
    • They also have a wide range of product types. Rather than try to build aggregates of a multitude of small expenditure categories, it seemed better to eliminate the biggest, influential groups that they don’t sell. This method is not perfect, but it is certainly closer than any existing aggregate.
  4. Why are Grocery and Supermarkets only tied to the Grocery CPI?
    • According to the Economic Census, 76% of their sales comes from Grocery products. Grocery Products are the driver. The balance of their sales comes from a collection of a multitude of categories.
  5. What about Drug/Health Stores only being tied to Medical Commodities.
    • An answer similar to the one for Grocery/Supermarkets. However, in this case Medical Commodities account for over 80% of these stores’ total sales.
  6. Why do SuperCtrs/Clubs and $ Stores have the same CPI?
    • While the Big Stores sell much more fresh groceries, Groceries account for ¼ of $ Store sales. Both Channels generally offer most of the same product categories, but the actual product mix is different.

Retail Channel $ Update – November Monthly & December Advance

In December, YOY Commodities’ deflation rose to 0.3% from -0.2%. Even with -0.2% deflation for 2024, high cumulative inflation vs 21 can still impact consumer spending and slow $ales growth.  We saw more evidence of this in December. Total Retail $ were +3.8% vs 23, -11% below the average 92>23 lift. Relevant Retail was +4.1%, 3% above the December average, but the lift for 24 was 3.6%, -22% below average. This shows that there is still a long road to full recovery. We’ll continue to track the retail market with data from 2 reports provided by the Census Bureau and factor in a targeted CPI.

The Census Bureau Reports are the Monthly and the Advance Retail Sales Reports. Both are derived from sales data gathered from retailers across the U.S. and are published monthly at the same time. The Advance Report has a smaller sample size so it can be published quickly – about 2 weeks after month end. The Monthly Report includes data from all respondents, so it takes longer to compile the data – about 6 weeks. Although the sample size for the Advance report is smaller, the results over the years have proven it to be statistically accurate with the Monthly reports. The biggest difference is that the full sample in the Monthly report allows us to “drill” a little deeper into the retail channels.

We will begin with the November Monthly Report and then go to the December Advance Report. Our focus is comparing to last year but also 21 & 19. We’ll show both actual and the “real” change in sales as we factor inflation into the data.

Both reports include the following:     (Note: December Ytd data = Year-End, Annual Numbers)

  • Total Retail, Restaurants, Auto, Gas Stations and Relevant Retail (removing Restaurants, Auto and Gas)
  • Individual Channel Data – This is more detailed in the Monthly reports, and we’ll focus on Pet Relevant Channels.

The data will be presented in detailed charts to facilitate visual comparison between groups/channels. The charts will show 11 separate measurements. To save space they will be displayed in a stacked bar format for the channel charts.

  • Current Month change – % & $ vs previous month
  • Current Month change – % & $ vs same month last year and vs 2021.
    • Current Month Real change vs last year and vs 2021 – % factoring in inflation
  • Current Ytd change – % & $ for this year vs last year, 2021 & 2019.
    • Current Ytd Real change % for this year vs last year and vs 2021 and 2019
  • Monthly & Ytd $ & CPIs for this year vs last year and vs 2021 which are targeted by channel will also be shown. (CPI Details are at the end of the report)

First, the November Monthly. Only Relevant & Total were up from October and there were 3 actual sales drops –  all in Gas Stations. We should note: Gas Stations are still selling less product than in 2019. Also, Relevant Retail is all positive again. They have been all positive in 10 of the last 13 months and now in 6 of the last 7. ($ are Not Seasonally Adjusted)

The November Monthly is $2.9B more than the Advance report. Restaurants: +$1.3B; Auto: +$1.1B; Gas Stations: +$0.1B; Relevant Retail: +$0.5B. Relevant Retail was the driver in the $ales lift vs October. All others were down. An Oct>Nov increase in Total Retail  has happened in 75% of the years since 1992. However, the  1.18% lift was 3% below average. There were 3 drops in actual sales – Monthly vs 23 & 21 and Ytd vs 23 for Gas Stations. There were only 2 “real” sales drops, down from 3 last month. All but Gas Stations were all positive. Restaurants still have the biggest increases vs 21 & 19 but Relevant Retail stayed at the top of “real” performance vs 2019. However, only 51% of their growth is real.

Now, let’s see how some Key Pet Relevant channels did in November in the Stacked Bar Graph Format

Overall– 6 of 11 were up from October. vs Nov 23, 7 were actually and “really” up. Vs Nov 21, 7 were up but only 5 were real increases. Vs 2019, All were actually up but Off/Gift/Souv and Disc Dept Stores were both really down.

  • Building Material Stores – The pandemic focus on home has produced sales growth of 32.2% since 2019. Prices for the Bldg/Matl group have inflated 10.2% from 2021 and 22.0% from 2019 which is having an impact. Sales vs October were -9.9% for HomeCtr/Hdwe and -16.2% for Farm Stores. Vs other years, HomeCtr/Hdwe are only really down monthly & Ytd vs 23, but Farm stores are actually and really down in all comparisons but vs 2019. Plus, only 27% of the Building Materials group’s 19>24 lift was real. Avg 19>24 Growth: HomeCtr/Hdwe: 5.6%, Real: 1.5%; Farm: 6.5%, Real: 2.4%
  • Food & Drug – Both are truly essential. Except for the pandemic food binge buying, they tend to have smaller changes in $. In terms of inflation, the Grocery rate is now 4 times higher than the rate for Drug/Med products. Drug Stores are positive in all measurements and 66% of their 2019>24 growth is real. Supermarkets’ actual $ are up in all measurements and they are only “really” down vs 2021. However, only 6% of their 19>24 increase is real growth. Avg 19>24 Growth: Supermarkets: +5.2%, Real: +0.4%; Drug Stores: +5.3%, Real: +3.7%.
  • Sporting Goods Stores – They also benefited from the pandemic in that consumers turned to self-entertainment, especially sports & outdoor activities. Sales are up 8.9% from October but their only other positives are actual & real Ytd vs 19. Prices are still deflating, -2.8% vs 23. Deflation started in April 23 and is a big change from +1.1% in 22>23 and +7.9% in 21>22. The result is that 60% of their 34.4% lift since 19 is real. Avg 19>24 Growth Rate is: +6.1%; Real: +3.8%.
  • Gen Mdse Stores – All actual & real sales were up for Club/SupCtrs & $ stores. However, even with an 11.9% increase from October, Discount Dept Stores were only actually up vs 19. All of their real measurements are negative so none of their growth since 2019 is real. The other channels average 47% in real growth. Avg 19>24 Growth: SupCtr/Club: 6.0%, Real: 2.8%; $/Value Strs: +6.4%, Real: +3.2%; Disc. Dept. Strs: +1.5%, Real: -0.5%.
  • Office, Gift & Souvenir Stores – After a big lift in October, Sales fell -29.2% in November. They are only actually up vs Nov 23 & Ytd vs 19 and all of their real sales numbers, but vs Nov 23 are negative. Their recovery started late, and their progress has stalled again. Avg Growth Rate: +0.02%, Real: -1.9%
  • Internet/Mail Order – Sales are +13.0% from October and set a new monthly record of $132.9B. All measurements are positive, but their Ytd growth, +10.3%, is still only 64% of their average since 2019. However, 82.0% of their 110.5% growth since 2019 is real. Avg Growth: +16.0%, Real: +13.8%. As expected, they are by far the growth leader since 2019.
  • A/O Miscellaneous – Pet Stores are 22>24% of total $. In May 2020 they began their recovery which reached a record level of $100B for the first time in 2021. In 2022 their sales dipped in January, July, Sept>Nov, rose in December, fell in Jan>Feb 23, grew Mar>May, fell in Jun>Aug, rose in Sep>Nov, fell in Dec>Jan 24, grew in Feb>May, fell in Jun>Sep, grew in October, then fell in Nov. All measurements are again positive and they are in 2nd place, behind the Internet, in the % increase vs 19 and vs 21. Also, 73% of their 53.7% growth since 2019 is real. Average 19>24 Growth: +9.0%, Real: +6.8%.

Nov had its usual lift vs Oct, but the Rel Retl lift was -30% below avg as only 6 small channels were up. The YOY lift was also below avg – Total (-6%), Relevant (-14%), but 7 smaller channels and 4 of 5 big groups were up vs Nov 23. Prices are still deflating in 7 channels but cumulative inflation is impacting $ as only 5 channels were really up vs Nov 21. The Retail Recovery has slowed. The Nov commodities CPI was -0.2% but rose to 0.3% in December. Let’s see if it impacts Retail.

Nov>Dec sales were up for all but Gas Stations. A Nov>Dec Total Retail lift has happened in 100% of the years since 1992 but the 7.5% lift is -50% below average. All but 4 actual YOY $ measurements are positive. 3 of the drops are from Gas Stations and 1 from Restaurants. The Total Retail lift of 3.8% vs Dec 23 was only the 6th  biggest increase in 24 and -11% below avg. The Relevant Retail lift vs Dec 23 (+4.1%) was 3% above their 92>23 average and the Auto lift was 65% above average. Restaurants (avg: 6.0%) & Gas Stations (avg: 4.2%) had $ drops. Inflation is still a factor. The CPI for all commodities rose to 0.3% but it is down to 5.9% from 6.6% vs 21. There is some other “real” news. 3 measurements were “really” down. In November, there were 2 but back in September there were 5. Auto, Total & Relevant Retail were YOY all positive. After 2 months with a negative, Relevant Retail has now been all positive in 7 of the last 8 months.

Overall – Inflation Reality – For Total Retail, inflation rose to +0.3% but YOY sales grew 3.8% vs 23. For Restaurants, inflation remains high, +3.5% and their $ vs Dec 23 are now down. Gas prices fell but that group is still in turmoil. Auto prices rose but are still deflating. Their sales grew +7.5% vs Dec 23 and they are again all positive. Inflation grew to 0.5% from 0.4% for Relevant Retail but YOY sales are still all positive. Their progress continues but may be slowing.

Total Retail – Since June 20, every month but April 23 & June 24 has set a monthly sales record. In 2023>24, Sales were on a roller coaster. Up Jul>Aug, down Sept, up Oct>Dec, down Jan 24, up Feb>Mar, down April, up May, down June, up Jul>Aug, down in Sep, up in Oct>Dec. Prices are now +0.3% and YOY sales are up less than expected. Year-End $ are up 3.0% vs 23, -35% below their 92>23 avg growth. Plus, only 39.1% of the 19>24 growth is real. YOY pricing in Total Retail deflated -0.2% in 24 but we see its cumulative impact in YE sales. Growth: 23>24: 3.0%; Avg 19>24: +6.7%, Real: +2.8%.

Restaurants – They were hit hard by the pandemic and didn’t begin recovery until March 2021. However, they have had strong growth since then, exceeding $1T for the 1st time in 2023. December $ are down vs 23 but they have the biggest YE increases vs 23, 21 & 19. Inflation slowed to 3.5% in December but is still +17.8% vs 21 and +27.5% vs 19. YE sales are up 4.6%, -18% below their 19>23 avg. Plus, just 33.6% of their 48.2% growth since 19 is real and they remain 3rd in performance behind Relevant & Total Retail. Recovery started late but inflation started early. Growth: 4.6%; Avg 19>24:+8.2%, Real: +3.1%. They just account for 13.4% of Total Retail $, but their strong growth has helped Total Retail.

Auto (Motor Vehicle & Parts Dealers) – They worked to overcome the stay-at-home attitude with great deals and advertising. They finished 2020 up 1% vs 2019 and hit a record $1.48T in 2021 but much of it was due to skyrocketing inflation. In 22, sales got on a rollercoaster. Inflation started to drop mid-year, but it caused 4 down months in actual $, the only sales negatives by a big group in 21>22. Their YE real 2022 sales numbers were even worse, -8.2% vs 21 and -8.9% vs 19. 2023 started a true sales rollercoaster but the $ set a new record, $1.595T. $ fell in Jan 24, grew Feb>Mar, fell Apr, grew May, fell June, grew Jul>Aug, fell Sep, grew Oct, fell Nov, then grew in Dec. YE $ were +2.5%,-42% below avg. All comparisons are positive, but only 18.8% of 19>24 growth is real. Growth: 2.5%; Avg 19>24: +5.6%, Real: +1.2%

Gas Stations – Gas Stations were hit hard by “stay at home”. They started recovery in Mar 21 and inflation began. Sales got on a rollercoaster in 22 but set a record, $583B. Inflation started to slow in Aug and prices slightly deflated in Dec & Feb 23, then strongly fell in Mar>Jul to -20.2%. In Aug they rose to -3.7%. In Sep they were +2.7% but began deflating to -4.2% in Feb 24. In Mar>May they grew, fell June, rose July, then fell Aug>Dec. Actual $ are down monthly vs 23 & 21 & YE vs 23. Real sales are down YE vs 21 & 19. 92>23 avg growth: +5.4%. Growth: -2.8%; Avg 19>24: +4.2%, Real: -0.7%. They show the cumulative impact of inflation and demonstrate how deflation can be both a positive and a negative.

Relevant Retail – Less Auto, Gas and Restaurants – They account for ≈60% of Total Retail $ in a variety of channels, so they took many different paths through the pandemic. However, their only down month was April 2020, and they led the way in Total Retail’s recovery. Sales got on a roller coaster in 2022, but all months set new records with December reaching a new all-time high, $481B, and an annual record of $4.81T. In 2023, the roller coaster continued. A December lift set a new monthly record of $494.7B & an annual record of $4.997T. Sales fell in Jan>Feb 24, rose in Mar, fell in Apr, rose in May, fell in June, rose Jul>Aug, fell Sep, then rose in Oct>Dec. The Dec 4.1% YOY lift is 3% above their 92>23 avg but their 3.6 YE lift is -22% below avg. However, 51% of their 40.9% 19>24 growth is real – #1 in performance. Growth: 3.6%; Avg 19>24: +7.1%, Real: +3.9%. In 2024 their inflation rate dropped from 3.2% to 0.1% but its cumulative impact slowed growth. Their YE 3.6% lift was -22% below avg, but it was equal to 2018>19, so we are approaching “normal”.

In 2024 inflation slowed, but its cumulative effect is very visible as YOY Sales changes vs 23 are lower. Overall, progress has slowed. The differences from November are a mixed bag. The Actual drops increased from 3 to 4 and real drops grew from 2 to 3. Restaurant $ fell vs Dec 23 but Auto is again all positive. Gas Stations remain in turmoil. Relevant Retail’s YE Sales increase was -22% below avg but all measurements are positive for the 7th time in the last 8 months. Total Retail’s YE 3.0% lift was -35% below avg but they are all positive too. The recovery is slow but continues.

Here’s a more detailed look at December by Key Channels in the Stacked Bar Graph Format

  • Relevant Retail: Growth: +3.6%; Avg: +7.1%, Real: +3.9%. 10 were up from Nov. Vs Dec 23: 9 were up, Real: 9, Vs Dec 21: 8 were up, Real: 8. Vs 19: Only Dept Stores were actually & really down. Furnishing stores were also really down.
  • All Department Stores – This group was struggling before the pandemic hit them hard. They began recovery in March 2020. Sales are up 32.6% from November but their actual and real numbers are all negative. They are even actually & really down vs 2019. Their avg 92>23 YE change is actually a -0.9% drop. Growth: -1.3%; Avg 19>24: -0.6%, Real: -2.5%.
  • Club/SuprCtr/$- They fueled a big part of the recovery because they focus on value which has broad consumer appeal. $ales are +11.1% from Nov, and they are positive in all measurements. However, only 44% of their 33.9% 19>24 lift is real. Their YE 3.5% growth is -56% below their 92>23 average. Growth: 3.5%; Avg 19>24: +6.0%, Real: +2.8%.
  • Grocery- These stores depend on frequent purchases, so their changes are usually less radical. Actual $ are +2.8% from Nov and positive in all comparisons. However, cumulative inflation has hit them hard. Real $ are only up YE vs 23 & 19 and only 6% of 19>24 growth is real. Their YE growth is -36% below avg. Growth: 2.0%; Avg 19>24: +5.2%, Real: +0.3 %.
  • Health/Drug Stores – Many stores are essential, but consumers visit less frequently than Grocery stores. $ are up 12.8% from Nov and they are positive in all comparisons. Because inflation has been relatively low, 66% of their 29.2% growth from 2019 is real. Their YE growth is -44% below average. Growth: 2.9%; Avg 19>24: +5.3%, Real: +3.6%
  • Clothing and Accessories – Clothes mattered less when you stayed home. That changed in March 2021 with strong growth through 2022. Sales are up 38.9% from Nov and actual sales are up in all comparisons. Real sales are only down YE vs 21 and 62% of their 19>24 growth is real. YE growth is -15% below average. Growth: 2.6%; Avg 19>24: +3.3%, Real:+2.1%
  • Home Furnishings – In mid-2020 consumers’ focus turned to their homes and furniture became a priority. Prices are still deflating but they were high in 2022. Sales are up 1.5% from Nov and only negative in actual YE vs 23 & 21 and real YE vs 21 & 19. YE they are -2.2%. Their 92>23 avg growth is 3.2%. Growth: -2.2%; Avg 19>24: +2.4%, Real: -0.1%
  • Electronic & Appliances – This channel has had many issues. Sales fell in Apr>May of 2020 and didn’t reach 2019 levels until March 21. $ are +17.9% from Nov and they are positive in all comparisons but actual YE vs 21. They have had strong deflation and their 2023>24 growth is only 0.9%, -54% below their 2.1% avg. Growth: +0.9%; Avg 19>24: +0.4%, Real: +3.5%.
  • Building Material, Farm & Garden & Hardware –They truly benefited from the consumers’ focus on home. In 2022 the lift slowed as inflation grew to double digits. Prices are still deflating, but sales are -9.3% from Nov. Actual sales are only positive. YE vs 21 & 19. However, Real sales are positive in all comparisons but monthly & Ytd vs 21, but just 26% of their 19>24 sales growth is real. Their 92>23 avg growth is 4.4%. Growth: -0.8%; Avg 19>24: +5.7%, Real: +1.6%.
  • Sporting Goods, Hobby and Book Stores – Consumers turned their attention to recreation and Sporting Goods stores sales took off. Book & Hobby Stores recovered more slowly. They have been on a sales rollercoaster since June but $ are+28.4% vs Nov & +52.4% from Oct. However, only actual sales vs Dec 23 & YE 19 and real sales vs Dec 23 & 21 and YE vs 19 are positive. 74% of their 19>24 growth is real. Avg 92>23 lift: +2.8%. Growth: -2.7%; Avg 19>24: +4.6%, Real: +3.5%.
  • All Miscellaneous Stores – Pet Stores have been a key part of the strong and growing recovery of this group. They finished 2020 at +0.9% but sales took off in March 21 and have continued to grow. Sales are +10.3% vs Nov and positive in all comparisons. They are still 2nd in the % increase vs 19 but only 4th vs 21. 66.7% of their 38.7% 19>24 growth is real. Plus, their 5.5% YE lift is actually 45% above their 3.8% 92>23 avg. Growth: +5.5%; Avg 19>24: +6.8%, Real: 4.7%.
  • NonStore Retailers – 90% of their $ comes from Internet/Mail Order/TV. The pandemic accelerated online spending. They ended 2020 +21.4%. The growth continued in 2021 as sales exceeded $100B for the 1st time and they broke the $1 Trillion barrier. $ are +10.2% from Nov, but YE growth was +8.2%, -15% below their 9.6% 92>23 avg. They are positive in all comparisons and 81% of their 95.4% 19>24 growth is real. Growth: 8.2%; Avg 19>24: +14.3%, Real: +12.1%.

Note: Almost without exception, online sales by brick ‘n mortar retailers are recorded with their regular store sales.

Recap – The Retail recovery from the pandemic was largely driven by Relevant Retail and by the end of 2021 it had become very widespread. In 2022, there was a new challenge, the worst inflation in 40 years. Overall, inflation has slowed considerably from its June 22 peak and 7 channels are currently deflating. Any deflation should help the Retail Situation. As expected, $ grew for 10 of 11 from Nov, but the 10.6% lift for Relevant Retail was -52% below their 92>23 avg. However, their 4.1% lift vs Dec 23 was 3% above average. 9 of 11 channels had a YOY $ lift and 9 sold more product. There were only 4 months with above average lifts in 2024, so it is not surprising that the Year-End 3.6% lift was -22% below average. In the 11 smaller channels only Miscellaneous had a YE lift above their 92>23 average. However, 7 had a sales increase and 9 sold more product. Perhaps the best news is that Relevant Retail has been positive in all comparisons in 7 of the last 8 months. The recovery strongly restarted in October. In November & December it slowed but continued. We still have a ways to go. We need many more “Octobers” to fully recover.

Finally, here are the details and updated inflation rates for the CPIs used to calculate the impact of inflation on retail groups and channels. This includes special aggregate CPIs created with the instruction and guidance of personnel from the US BLS. I also researched data from the last Economic Census to review the share of sales by product category for the various channels to help in selecting what expenditures to include in specific aggregates. Of course, none of these specially created aggregates are 100% accurate but they are much closer than the overall CPI or available aggregates. The data also includes the CPI changes since 2021 to show cumulative inflation.

Monthly YOY CPI changes of 0.2% or more are highlighted. (Green = lower; Pink = higher)

Here are some answers to some obvious questions. ALSO NOTE: 7 of the 11 December “pinks” are just slowed deflation

  1. Why is the group for Non-store different from the Internet?
    • Non-store is not all internet. It also includes Fuel Oil Dealers, the non-motor fuel Energy Commodity.
  2. Why is there no Food at home included in Non-store or Internet?
    • Online Grocery purchasing is becoming popular but almost all is from companies whose major business is brick ‘n mortar. These online sales are recorded under their primary channel.
  3. 6 Channels have the same CPI aggregate but represent a variety of business types.
    • They also have a wide range of product types. Rather than try to build aggregates of a multitude of small expenditure categories, it seemed better to eliminate the biggest, influential groups that they don’t sell. This method is not perfect, but it is certainly closer than any existing aggregate.
  4. Why are Grocery and Supermarkets only tied to the Grocery CPI?
    • According to the Economic Census, 76% of their sales comes from Grocery products. Grocery Products are the driver. The balance of their sales comes from a collection of a multitude of categories.
  5. What about Drug/Health Stores only being tied to Medical Commodities.
    • An answer similar to the one for Grocery/Supermarkets. However, in this case Medical Commodities account for over 80% of these stores’ total sales.
  6. Why do SuperCtrs/Clubs and $ Stores have the same CPI?
    • While the Big Stores sell much more fresh groceries, Groceries account for ¼ of $ Store sales. Both Channels generally offer most of the same product categories, but the actual product mix is different.

Retail Channel $ Update – October Monthly & November Advance

In November, YOY Commodities’ deflation slowed to -0.2% from -1.0%. Although deflating, high cumulative inflation vs 21 can still impact consumer spending and slow actual $ growth.  We saw evidence of this in November. Total Retail sales were +4.0% vs 23, -16% below the average lift since 1992. Relevant Retail was +3.9%, -17% below average. That is concerning and clearly shows that there is still a long road to full recovery. We’ll continue to track the retail market with data from 2 reports provided by the Census Bureau and factor in a targeted CPI.

The Census Bureau Reports are the Monthly and the Advance Retail Sales Reports. Both are derived from sales data gathered from retailers across the U.S. and are published monthly at the same time. The Advance Report has a smaller sample size so it can be published quickly – about 2 weeks after month end. The Monthly Report includes data from all respondents, so it takes longer to compile the data – about 6 weeks. Although the sample size for the Advance report is smaller, the results over the years have proven it to be statistically accurate with the Monthly reports. The biggest difference is that the full sample in the Monthly report allows us to “drill” a little deeper into the retail channels.

We will begin with the October Monthly Report and then go to the November Advance Report. Our focus is comparing to last year but also 21 & 19. We’ll show both actual and the “real” change in sales as we factor inflation into the data.

Both reports include the following:

  • Total Retail, Restaurants, Auto, Gas Stations and Relevant Retail (removing Restaurants, Auto and Gas)
  • Individual Channel Data – This is more detailed in the Monthly reports, and we’ll focus on Pet Relevant Channels.

The data will be presented in detailed charts to facilitate visual comparison between groups/channels. The charts will show 11 separate measurements. To save space they will be displayed in a stacked bar format for the channel charts.

  • Current Month change – % & $ vs previous month
  • Current Month change – % & $ vs same month last year and vs 2021.
    • Current Month Real change vs last year and vs 2021 – % factoring in inflation
  • Current Ytd change – % & $ for this year vs last year, 2021 & 2019.
    • Current Ytd Real change % for this year vs last year and vs 2021 and 2019
  • Monthly & Ytd $ & CPIs for this year vs last year and vs 2021 which are targeted by channel will also be shown. (CPI Details are at the end of the report)

First, the October Monthly. All were up from September & there were only 2 actual sales drops – both Gas Stations vs 23. We should note that Gas Stations are still selling less product than in 2019. Also, Relevant Retail is all positive again. They have been all positive in 9 of the last 12 months and now in 5 of the last 6. ($ are Not Seasonally Adjusted)

The October Monthly is less than $0.1B more than the Advance report. Restaurants: No/Chge; Auto: +$0.2B; Gas Stations: -$0.2B; Relevant Retail: -0.1B. As expected, $ales were up vs September for all. A Sep>Oct increase in Total Retail  has happened every year but 2008 since 1992. Plus, the  6.8% lift was double the 3.4% avg. There were only 2 drops in actual sales – Monthly & Ytd vs 23 for Gas Stations. There were 3 “real” sales drops, down from 6 last month. Total & Relevant Retail and Restaurants were all positive. Restaurants still have the biggest increases vs 21 & 19 but Relevant Retail stayed at the top of “real” performance vs 2019. However, only 51% of their growth is real.

Now, let’s see how some Key Pet Relevant channels did in October in the Stacked Bar Graph Format

Overall– All 11 were up from September. vs Oct 23, 9 were actually and 10 “really” up. Vs Oct 21, 8 were up and 7 were real increases. Vs 2019, All were actually up but Off/Gift/Souv and Disc Dept Stores were really down.

  • Building Material Stores – The pandemic focus on home has produced sales growth of 32.0% since 2019. Prices for the Bldg/Matl group have inflated 11.0% since 2021 which is having an impact. HomeCtr/Hdwe are only actually down Ytd vs 23, but Farm stores are actually and really down Ytd vs 23 & vs 21. Only the “real” measurement Ytd vs 21 is negative for Home/Hdwe. However, only 26% of the Building Materials group’s 19>24 lift was real. Avg 19>24 Growth: HomeCtr/Hdwe: 5.5%, Real: 1.5%; Farm: 6.5%, Real: 2.4%
  • Food & Drug – Both are truly essential. Except for the pandemic food binge buying, they tend to have smaller changes in $. In terms of inflation, the Grocery rate is now 110% of the rate for Drug/Med products. Drug Stores are positive in all measurements and 65% of their 2019>24 growth is real. Supermarkets’ actual $ are up in all measurements and they are only “really” down vs 2021. However, only 6% of their 19>24 increase is real growth. Avg 19>24 Growth: Supermarkets: +5.2%, Real: +0.3%; Drug Stores: +5.3%, Real: +3.5%.
  • Sporting Goods Stores – They also benefited from the pandemic in that consumers turned to self-entertainment, especially sports & outdoor activities. Sales are up 1.1% from September but their only positives are actual & real Ytd vs 19. Prices are still deflating, -3.1% vs 23. Deflation started in April 23 and is a big change from +1.1% in 22>23 and +7.9% in 21>22. The result is that 59% of their 34.5% lift since 19 is real. Avg 19>24 Growth Rate is: +6.1%; Real: +3.8%.
  • Gen Mdse Stores – All actual & real sales were up for Club/SupCtrs & $ stores. On the other hand, Discount Dept Stores were only actually up vs Oct 23 & Ytd vs 19. All of their real measurements but vs Oct 23 are negative so none of their growth since 2019 is real. The other channels average 45% in real growth. Avg 19>24 Growth: SupCtr/Club: 6.1%, Real: 2.9%; $/Value Strs: +6.4%, Real: +3.1%; Disc. Dept. Strs: +1.6%, Real: -0.4%.
  • Office, Gift & Souvenir Stores – Sales were up 21.6% from September. This helped but was not enough. They are only actually up Ytd vs 21 & 19 and all of their real sales numbers, but vs Oct 23 are negative. Their recovery started late, and their progress had stalled. Perhaps, it is beginning to restart. Avg Growth Rate: +0.2%, Real: -1.8%
  • Internet/Mail Order – Sales are +10.0% from September and set a new monthly record of $117.5B. All measurements are positive, but their Ytd growth, +9.6%, is still only 60% of their average since 2019. However, 81.9% of their 110..6% growth since 2019 is real. Avg Growth: +16.1%, Real: +13.8%. As expected, they are by far the growth leader since 2019.
  • A/O Miscellaneous – Pet Stores are 22>24% of total $. In May 2020 they began their recovery which reached a record level of $100B for the first time in 2021. In 2022 their sales dipped in January, July, Sept>Nov, rose in December, fell in Jan>Feb 23, grew Mar>May, fell in Jun>Aug, rose in Sep>Nov, fell in Dec>Jan 24, grew in Feb>May, fell in Jun>Sep, then grew in October. However, all measurements are positive. They are still in 2nd place, behind the Internet, in the % increase vs 19 and vs 21. Also, 73% of their 55.4% growth since 2019 is real. Average 19>24 Growth: +9.2%, Real: +7.1%.

October had its usual lift as all small channels were up vs September. The Total Retail YOY lift was 21% above  Avg and 9 of 11 smaller channels and 4 of 5 big groups were up vs Oct 23. Prices are now deflating in 9 channels. Also, cumulative inflation may matter a little less as 7 of 11 channels were really up vs Oct 21. The Retail Recovery has restarted again. The commodities CPI is still deflating but rose to -0.2% in November, the highest since May. Let’s see if it impacts Retail.

Oct>Nov sales were only up for Total & Relevant Retail. An Oct>Nov Total Retail lift has happened in 75% of the years since 1992 but the 0.9% lift is -25% below average. All but 3 actual YOY $ measurements are positive. The drops are from Gas Stations – Monthly vs 23 & 21 and Ytd vs 23. The Total Retail lift of 4.0% vs 23 was the 4th  biggest increase in 24 but 16% below avg. The Relevant Retail lift vs Nov 23 (+3.9%) was 17% below their 92>23 average. The Auto lift was 54% above average, but Restaurants were -18% below their average. Inflation is still a factor. The CPI for all commodities rose to -0.2% but it is down to 6.6% from 7.9% vs 21. There is some “real” good news. Only 1 measurement was “really” down vs 23 & 21. In October, there were 2 and September had 5. Restaurants, Auto, Total & Relevant Retail were YOY all positive. After 2 months with a negative, Relevant Retail has now been all positive in 6 of the last 7 months.

Overall – Inflation Reality – For Total Retail, deflation slowed to -0.2% but YOY sales grew 4.0% vs 23. For Restaurants, inflation remains high, +3.6% but they are again up in all comparisons. Gas prices fell but that group is still in turmoil. Auto prices rose but are still deflating. Their sales grew vs Nov 23 and they are now all positive. Inflation grew to 0.4% from -0.2% for Relevant Retail but YOY sales are still all positive. Their progress continues but may be slowing.

Total Retail – Since June 20, every month but April 23 & June 24 has set a monthly sales record. In 2023>24, Sales were on a roller coaster. Up Jul>Aug, down Sept, up Oct>Dec, down Jan 24, up Feb>Mar, down April, up May, down June, up Jul>Aug, down in Sep, up in Oct>Nov. Prices are now -0.2%, but YOY sales are up less than expected. Ytd Sales are up 2.9% vs 23, only 43% of their avg 19>24 growth. Plus, only 39% of the 19>24 growth is real. YOY pricing in Total Retail is still deflating but we see its cumulative impact in Ytd sales. Growth: 23>24: 2.9%;Avg 19>24: +6.8%, Real: +2.9%.

Restaurants – They were hit hard by the pandemic and didn’t begin recovery until March 2021. However, they have had strong growth since then, exceeding $1T for the 1st time in 2023 and set another monthly sales record in November. They have the biggest Ytd increases vs 23, 21 & 19 and are again all “positive”. Inflation slowed to 3.6% in October but is still +18.2% vs 21 and +27.3% vs 19. Only 34.4% of their 48.5% growth since 19 is real and they remain 3rd in performance behind Relevant & Total Retail. Recovery started late but inflation started early. Growth: 4.9%; Avg 19>24:+8.2%, Real: +3.1%. They just account for 13.5% of Total Retail $, but their performance has helped Total Retail.

Auto (Motor Vehicle & Parts Dealers) – They actively worked to overcome the stay-at-home attitude with great deals and a lot of advertising. They finished 2020 up 1% vs 2019 and hit a record $1.48T in 2021 but much of it was due to skyrocketing inflation. In 22, sales got on a rollercoaster. Inflation started to drop mid-year, but it caused 4 down months in actual sales which are the only reported sales negatives by any big group in 21>22. This is bad but their Y/E real 2022 sales numbers were worse, down -8.2% vs 21 and -8.9% vs 19. 2023 started a true sales rollercoaster but the $ set a new record, $1.595T. $ fell in Jan 24, grew Feb>Mar, fell Apr, grew May, fell June, grew Jul>Aug, fell Sep, grew Oct, fell in Nov. All comparisons are positive, but only 17.9% of 19>24 growth is real. Growth: 2.0%; Avg 19>24: +5.5%, Real: +1.1%

Gas Stations – Gas Stations were hit hard by “stay at home”. They started recovery in March 2021 and inflation began. Sales got on a rollercoaster in 2022 but reached a record $583B. Inflation started to slow in August and prices slightly deflated in Dec & Feb 23, then strongly fell in Mar>Jul to -20.2%. In August they rose to -3.7%. In Sep they were +2.7% but began deflating to -4.2% in Feb 24. In Mar>May they grew, fell June, rose July, then fell Aug>Nov. Actual $ are down monthly vs 23 & 21 & Ytd vs 23. Real sales are down Ytd vs 21 & 19. Growth: -2.9%; Avg 19>24: +4.3%, Real: -0.7%. They show the cumulative impact of inflation and demonstrate how deflation can be both a positive and a negative.

Relevant Retail – Less Auto, Gas and Restaurants – They account for ≈60% of Total Retail $ in a variety of channels, so they took many different paths through the pandemic. However, their only down month was April 2020, and they led the way in Total Retail’s recovery. Sales got on a roller coaster in 2022, but all months set new records with December reaching a new all-time high, $481B, and an annual record of $4.81T. In 2023, the roller coaster continued. A December lift set a new monthly record of $494.7B & an annual record of $4.997T. Sales fell in Jan>Feb 24, rose in Mar, fell in Apr, rose in May, fell in June, rose Jul>Aug, fell Sep, then rose in Oct>Nov. The Nov. YOY lift of 3.9% is 17% below their 92>23 avg but all measurements are still positive. Also, 51% of their 41.4% 19>24 growth is real – #1 in performance. Growth: 3.5%; Avg 19>24: +7.2%, Real: +3.9%. America shops here. They began 2024 strong. In Mar>Apr recovery slowed. It got better in May, worsened in June, rebounded in July, stabilized in Aug, slowed in Sep, grew in Oct then slowed in Nov.

Inflation is still low, but the cumulative impact is still there. YOY Sales changes vs 23 are lower and overall, progress has slowed. The changes from October are mixed. The Actual drops increased from 2 to 3 but real drops fell from 3 to 2. Restaurants are back on track and Auto is now all positive, but the Gas Stations’ turmoil is growing. Relevant Retail’s YOY Sales increase was 17% below avg but all measurements are positive for the 6th time in the last 7 months. Total Retail’s lift was also below avg but they are all positive too. The recovery strongly restarted in October and slowly continues.

Here’s a more detailed look at November by Key Channels in the Stacked Bar Graph Format

  • Relevant Retail: Growth: +3.5%; Avg: +7.2%, Real: +3.9%. 8 were up from Oct. Vs Nov 23: 9 were up, Real: 10, Vs Nov 21: 8 were up, Real: 5. Vs 19: Only Dept Stores were actually & really down. Furnishing stores were also really down.
  • All Department Stores – This group was struggling before the pandemic hit them hard. They began recovery in March 2020. Sales are up 16.9% from October but their actual and real numbers are all negative. They are even actually & really down vs 2019. Growth: -1.1%; Avg 19>24: -0.3%, Real: -1.8%.
  • Club/SuprCtr/$- They fueled a big part of the recovery because they focus on value which has broad consumer appeal. $ales are +4.9% from Oct, and they are positive in all measurements. However, only 44.3% of their 34.3% 19>24 lift is real – inflation’s impact. Ytd growth is below Avg for the 8th straight month. Growth: 3.7%; Avg: +6.1%, Real: +2.9%.
  • Grocery- These stores depend on frequent purchases, so except for the binge buying in 2020, their changes are usually less radical. Actual $ are +1.1% from Oct and positive in all comparisons. However, cumulative inflation has hit them hard. Real $ are only up vs 23 & 19 and only 6% of 19>24 growth is real. Growth: 2.0%; Avg 19>24: +5.2%, Real: +0.3 %.
  • Health/Drug Stores – Many stores are essential, but consumers visit less frequently than Grocery stores. $ are down -5.6% from Oct but they are positive in all actual and real comparisons. Because inflation has been relatively low, 65% of their 28.8% growth from 2019 is real. Growth: 2.7%; Avg 19>24: +5.2%, Real: +3.5%
  • Clothing and Accessories – Clothes initially mattered less when you stayed home. That changed in March 2021 with strong growth through 2022. Sales are up 17.7% from Oct and actual sales are up in all comparisons. Real sales are down monthly & Ytd vs 21, but 63% of their 19>24 growth is real. Growth: 2.6%; Avg 19>24: +3.3%, Real:+2.1%
  • Home Furnishings – In mid-2020 consumers’ focus turned to their homes and furniture became a priority. Prices are still deflating but they were high in 2022. Sales are +7.7% from Oct, but negative in all measurements but vs Nov 23 & actual vs 2019. They have sold less product in 2024 than in 2019. Growth: -3.3%;Avg 19>24: +2.3%, Real: -0.2%
  • Electronic & Appliances – This channel has had many issues. Sales fell in Apr>May of 2020 and didn’t reach 2019 levels until March 21. $ are +20.6% from Oct, but they are only actually positive monthly & ytd vs 23 & ytd vs 19. Due to strong deflation, real sales are positive and exceed actual in all comparisons. Growth: +0.3%; Avg 19>24: +0.5%, Real: +3.6%.
  • Building Material, Farm & Garden & Hardware –They truly benefited from the consumers’ focus on home. In 2022 the lift slowed as inflation grew to double digits. Prices are still deflating, but sales are -9.7% from Oct. Actual sales are all positive. Prices are deflating vs 23 but are still +16.1% ytd vs 21. Real sales are positive in all comparisons but monthly & Ytd vs 21. However, just 27% of their 19>24 sales growth is real. Growth: -0.7%; Avg 19>24: +5.8%, Real: +1.7%.
  • Sporting Goods, Hobby and Book Stores – Consumers turned their attention to recreation and Sporting Goods stores sales took off. Book & Hobby Stores recovered more slowly. They have been on a monthly sales rollercoaster since June. $ skyrocketed +21.8% from Oct and all comparisons but ytd vs 23 & 21 are now positive. Their inflation rate has been lower than most groups so 74% of their 25.3% growth since 2019 is real. Growth: -2.9%; Avg 19>24: +4.6%, Real: +3.5%.
  • All Miscellaneous Stores – Pet Stores have been a key part of the strong and growing recovery of this group. They finished 2020 at +0.9% but sales took off in March 21 and have continued to grow. Sales are -11.8% vs Oct but positive in all measurements but actual vs Nov 23 & real vs Nov 21. They are still 2nd in the % increase vs 19 but fell from 3rd to 4th vs 21. 66.6% of their 39.5% 19>24 growth is real. Growth: +5.6%; Avg 19>24: +6.9%, Real: 4.8%.
  • NonStore Retailers – 90% of their $ comes from Internet/Mail Order/TV. The pandemic accelerated online spending. They ended 2020 +21.4%. The growth continued in 2021 as sales exceeded $100B for the 1st time and they broke the $1 Trillion barrier. $ are +11.0% from Oct, but ytd growth fell to 7.9% from 8.1% and they are now 46% below Avg. They are positive in all comparisons and 81% of their 98.4% 19>24 growth is real. Growth: 7.9%; Avg: +14.7%, Real: +12.4%.

Note: Almost without exception, online sales by brick ‘n mortar retailers are recorded with their regular store sales.

Recap – The Retail recovery from the pandemic was largely driven by Relevant Retail and by the end of 2021 it had become very widespread. In 2022, there was a new challenge, the worst inflation in 40 years. Overall, inflation has slowed considerably from its June 22 peak and 7 channels are deflating (down from 8 in Oct). Any deflation should help the Retail Situation. As expected, $ grew for most from Oct, but the 4.6% lift for Relevant Retail was -29% less than their 92>23 avg – a big turnaround from +62% in October. Also in October, their 5.5% lift vs 23 was 21% above average, 9 of 11 channels had a YOY $ lift and all 11 sold more product. In November, their 3.9% YOY lift was 17% below avg, but 9 of 11 had a YOY $ lift and 10 sold more product. Also, in October, there were 4 channels with 6.5+% lifts. In November, it fell to 1. Growth slowed in November, but it still continues. Here’s some truly good news. Restaurants, Total & Relevant Retail and now Auto are positive in all comparisons. Relevant Retail has now been all positive in 6 of 7 months. The recovery strongly restarted in October. In November it slowed but continued. We need many more “Octobers” to fully recover.

Finally, here are the details and updated inflation rates for the CPIs used to calculate the impact of inflation on retail groups and channels. This includes special aggregate CPIs created with the instruction and guidance of personnel from the US BLS. I also researched data from the last Economic Census to review the share of sales by product category for the various channels to help in selecting what expenditures to include in specific aggregates. Of course, none of these specially created aggregates are 100% accurate but they are much closer than the overall CPI or available aggregates. The data also includes the CPI changes since 2021 to show cumulative inflation.

Here are some answers to some obvious questions. ALSO NOTE: 16 of the 23 November “pinks” are slowed deflation

  1. Why is the group for Non-store different from the Internet?
    • Non-store is not all internet. It also includes Fuel Oil Dealers, the non-motor fuel Energy Commodity.
  2. Why is there no Food at home included in Non-store or Internet?
    • Online Grocery purchasing is becoming popular but almost all is from companies whose major business is brick ‘n mortar. These online sales are recorded under their primary channel.
  3. 6 Channels have the same CPI aggregate but represent a variety of business types.
    • They also have a wide range of product types. Rather than try to build aggregates of a multitude of small expenditure categories, it seemed better to eliminate the biggest, influential groups that they don’t sell. This method is not perfect, but it is certainly closer than any existing aggregate.
  4. Why are Grocery and Supermarkets only tied to the Grocery CPI?
    • According to the Economic Census, 76% of their sales comes from Grocery products. Grocery Products are the driver. The balance of their sales comes from a collection of a multitude of categories.
  5. What about Drug/Health Stores only being tied to Medical Commodities.
    • An answer similar to the one for Grocery/Supermarkets. However, in this case Medical Commodities account for over 80% of these stores’ total sales.
  6. Why do SuperCtrs/Clubs and $ Stores have the same CPI?
    • While the Big Stores sell much more fresh groceries, Groceries account for ¼ of $ Store sales. Both Channels generally offer most of the same product categories, but the actual product mix is different.


Retail Channel $ Update – September Monthly & October Advance

In October, YOY Commodities’ deflation decreased to -1.0% from -1.3%. Although deflating, high cumulative inflation vs 21 can still impact consumer spending and slow actual $ growth.  However, in October, Total Retail sales, as expected (90% of years since 92) were +4.6% vs 23, equal to the average lift. Relevant Retail was +5.5%, 21% above average. That looks good but there is still a long road to full recovery, so we’ll continue to track the retail market with data from 2 reports provided by the Census Bureau and factor in a targeted CPI.

The Census Bureau Reports are the Monthly and the Advance Retail Sales Reports. Both are derived from sales data gathered from retailers across the U.S. and are published monthly at the same time. The Advance Report has a smaller sample size so it can be published quickly – about 2 weeks after month end. The Monthly Report includes data from all respondents, so it takes longer to compile the data – about 6 weeks. Although the sample size for the Advance report is smaller, the results over the years have proven it to be statistically accurate with the Monthly reports. The biggest difference is that the full sample in the Monthly report allows us to “drill” a little deeper into the retail channels.

We will begin with the September Monthly Report and then go to the October Advance Report. Our focus is comparing to last year but also 21 & 19. We’ll show both actual and the “real” change in sales as we factor inflation into the data.

Both reports include the following:

  • Total Retail, Restaurants, Auto, Gas Stations and Relevant Retail (removing Restaurants, Auto and Gas)
  • Individual Channel Data – This is more detailed in the Monthly reports, and we’ll focus on Pet Relevant Channels.

The data will be presented in detailed charts to facilitate visual comparison between groups/channels. The charts will show 11 separate measurements. To save space they will be displayed in a stacked bar format for the channel charts.

  • Current Month change – % & $ vs previous month
  • Current Month change – % & $ vs same month last year and vs 2021.
    • Current Month Real change vs last year and vs 2021 – % factoring in inflation
  • Current Ytd change – % & $ for this year vs last year, 2021 & 2019.
    • Current Ytd Real change % for this year vs last year and vs 2021 and 2019
  • Monthly & Ytd $ & CPIs for this year vs last year and vs 2021 which are targeted by channel will also be shown. (CPI Details are at the end of the report)

First, the September Monthly. All were down from August but there were only 3 actual sales drops vs 23 & 21. We should note that Gas Stations are still selling less product than in 2019. Also, Relevant Retail is all positive again. They have been all positive in 8 of the last 11 months and now in 4 of the last 5. ($ are Not Seasonally Adjusted)

The September Monthly is $1.7B more than the Advance report. Restaurants: +$0.2B; Auto: +$0.2B; Gas Stations: +$0.3B; Relevant Retail: +$1.1B. As expected, $ales were down vs August for all. An Aug>Sep decrease in Total Retail  has happened every year since 1992. However, the -6.9% drop was 11% more than the -6.2% avg. There were only 3 drops in actual sales – Monthly & Ytd vs 23 for Gas Stations and Auto Monthly vs 23. There were 6 “real” sales drops, up from 3 last month. Total & Relevant Retail were all positive. Restaurants still have the biggest increases vs 21 & 19 but Relevant Retail stayed at the top of “real” performance vs 2019. However, only 51% of their growth is real.

Now, let’s see how some Key Pet Relevant channels did in September in the Stacked Bar Graph Format

Overall– 10 of 11 were down from August. vs Sep 23, 7 were actually and “really” up. Vs Sep 21, 8 were up but only 5 were real increases. Vs 2019, Off/Gift/Souv were actually & really down and Disc Dept Strs were also really down.

  • Building Material Stores – The pandemic focus on home has produced sales growth of 31.2% since 2019. Prices for the Bldg/Matl group have inflated 14.2% since 2021 which is having an impact. HomeCtr/Hdwe are only actually down Ytd vs 23, but Farm stores are only actually up vs Sep 21 & Ytd vs 19. Only the “real” measurements vs 21 are negative for Home/Hdwe. For Farm Stores all “real” numbers but vs 19 are negative. Plus, only 25% of the Building Materials group’s 19>24 lift was real. Avg 19>24 Growth: HomeCtr/Hdwe: 5.4%, Real: 1.3%; Farm: 6.4%, Real: 2.3%
  • Food & Drug – Both are truly essential. Except for the pandemic food binge buying, they tend to have smaller changes in $. In terms of inflation, the Grocery rate is 81% of the rate for Drug/Med products. Drug Stores are positive in all measurements and 64% of their 2019>24 growth is real. Supermarkets’ actual $ are up in all measurements and they are only “really” down vs 2021. However, only 5% of their 19>24 increase is real growth. Avg 19>24 Growth: Supermarkets: +5.2%, Real: +0.3%; Drug Stores: +5.1%, Real: +3.4%.
  • Sporting Goods Stores – They also benefited from the pandemic in that consumers turned to self-entertainment, especially sports & outdoor activities. Sales are down -17.7% from August and their only positives are actual & real Ytd vs 19. Prices are still deflating, -2.3% vs 23. Deflation started in April 23 and is a big change from +1.1% in 22>23 and +7.9% in 21>22. The result is that 58% of their 34.6% lift since 19 is real. Avg 19>24 Growth Rate is: +6.1%; Real: +3.7%.
  • Gen Mdse Stores – All actual & real sales were up for Club/SupCtrs & $ stores. On the other hand, Discount Dept Stores were only actually up Ytd vs 21 & 19. All real measurements are negative so none of their growth since 2019 is real. The other channels average 45% in real growth. Avg 19>24 Growth: SupCtr/Club: 6.1%, Real: 2.9%; $/Value Strs: +6.4%, Real: +3.1%; Disc. Dept. Strs: +1.6%, Real: -0.4%.
  • Office, Gift & Souvenir Stores – Sales were down -10.8% from August. This set the stage for a bad month. They are now only actually up Ytd vs 21 and all of their real sales numbers are negative. Their recovery started late, and their progress has stalled again after a minor restart in August. Avg Growth Rate: -0.01%, Real: -2.0%
  • Internet/Mail Order – Sales are -2.5% from August but set a new monthly record of $106.5B. All measurements are positive, but their Ytd growth, +9.6%, is still only 60% of their average since 2019. However, 81.9% of their 111.0% growth since 2019 is real. Avg Growth: +16.1%, Real: +13.8%. As expected, they are by far the growth leader since 2019.
  • A/O Miscellaneous – Pet Stores are 22>24% of total $. In May 2020 they began their recovery which reached a record level of $100B for the first time in 2021. In 2022 their sales dipped in January, July, Sept>Nov, rose in December, fell in Jan>Feb 23, grew Mar>May, fell in Jun>Aug, rose in Sep>Nov, fell in Dec>Jan 24, grew in Feb>May, then fell in Jun>Sep. However, all measurements are positive. They are still in 2nd place, behind the Internet, in the % increase vs 19 and vs 21. Also, 73% of their 55.1% growth since 2019 is real. Average 19>24 Growth: +9.2%, Real: +7.0%.

September had its usual drop as 10 small channels were down vs August. The Total Retail YOY lift was -95% below Avg but 7 of 11 smaller channels and 2 of 4 big groups were up vs Sep 23. Prices are deflating in 7 channels, but cumulative inflation still matters. Many sales lifts are lower as 6 of 11 channels were really down vs Sep 21. The Retail Recovery has slowed again. The commodities CPI is still deflating but rose to -1.0% in October. Let’s see if it impacts Retail $ales.

Sep>Oct sales were up for all. An Sep>Oct Total Retail lift has happened in 90% of the years since 1992 and the 4.6% lift is equal to the average. All but 2 actual YOY $ measurements are positive. The drops are from Gas Stations – Monthly & Ytd vs 23. The Total Retail lift of 4.6% vs 23 was the 2nd biggest increase in 24 (+6.3% in Feb). The Relevant Retail lift vs Oct 23 (+5.5%) was 21% above their 92>23 average. The Auto lift was 45% above average, but Restaurants were -19% below their average. Inflation may be becoming less of a factor. The CPI for all commodities rose to -1.0% but it is down to 7.9% from 9.7% vs 21. There is more “real” good news. In September, 5 measurements were “really” down vs 23 & 21. In October, only 2 were really down. Restaurants, Total & Relevant Retail were all positive. After 2 months with a negative, Relevant Retail has been all positive in 5 of the last 6 months.

Overall – Inflation Reality – For Total Retail, deflation slowed to -1.0% but YOY sales grew 4.6% vs 23. For Restaurants, inflation remains high, +3.7% but they are again up in all comparisons. Gas prices fell but that group is still in turmoil. Auto prices rose but are still deflating. Their sales grew vs Oct 23 and are really down in only 1 measurement. Inflation fell from 0.1% to -0.2% for Relevant Retail and sales are all positive. Their progress continues and may be growing.

Total Retail – Since June 20, every month but April 23 & June 24 has set a monthly sales record. In 2023>24, Sales were on a roller coaster. Up Jul>Aug, down Sept, up Oct>Dec, down Jan 24, up Feb>Mar, down April, up May, down June, up Jul>Aug, down in Sep, up in Oct. Prices are now -1.0%, and YOY sales are up as expected. Ytd Sales are up 2.8% vs 23, only 41% of their avg 19>24 growth. Plus, only 39% of the 19>24 growth is real. YOY pricing in Total Retail is still deflating but we see its cumulative impact in Ytd sales. Growth: 23>24: 2.8%; Avg 19>24: +6.8%, Real: +2.8%.

Restaurants – They were hit hard by the pandemic and didn’t begin recovery until March 2021. However, they have had strong growth since then, exceeding $1T for the 1st time in 2023 and set another monthly sales record in October. They have the biggest Ytd increases vs 23, 21 & 19 and are again all “positive”. Inflation slowed to 3.7% in October but is still +18.6% vs 21 and +27.1% vs 19. Only 35.2% of their 48.9% growth since 19 is real and they remain 3rd in performance behind Relevant & Total Retail. Recovery started late but inflation started early. Growth: 5.0%; Avg 19>24:+8.3%, Real: +3.3%. They just account for 13.6% of Total Retail $, but their performance has helped Total Retail.

Auto (Motor Vehicle & Parts Dealers) – They actively worked to overcome the stay-at-home attitude with great deals and a lot of advertising. They finished 2020 up 1% vs 2019 and hit a record $1.48T in 2021 but much of it was due to skyrocketing inflation. In 22, sales got on a rollercoaster. Inflation started to drop mid-year, but it caused 4 down months in actual sales which are the only reported sales negatives by any big group in 21>22. This is bad but their Y/E real 2022 sales numbers were worse, down -8.2% vs 21 and -8.9% vs 19. 2023 started a true sales rollercoaster but the $ set a new record, $1.595T. $ fell in Jan 24, grew Feb>Mar, fell Apr, grew May, fell June, grew Jul>Aug, fell Sep, grew in Oct. All but Real Ytd $ vs 21 are positive, but only 17.7% of 19>24 growth is real. Growth: 1.5%; Avg 19>24: +5.5%, Real: +1.1%

Gas Stations – Gas Stations were hit hard by “stay at home”. They started recovery in March 2021 and inflation began. Sales got on a rollercoaster in 2022 but reached a record $583B3. Inflation started to slow in August and prices slightly deflated in Dec & Feb 23, then strongly fell in Mar>Jul to -20.2%. In August they rose to -3.7%. In Sep they were +2.7% but began deflating to -4.2% in Feb 24. In Mar>May they grew, fell in June, rose in July, then fell in Aug>Oct. Actual $ are down monthly & Ytd vs 23. Real sales are down Ytd vs 21 and 19. Growth: -2.8%; Avg 19>24: +4.4%, Real: -0.8%.They show the cumulative impact of inflation and demonstrate how deflation can be both a positive and a negative.

Relevant Retail – Less Auto, Gas and Restaurants – They account for ≈60% of Total Retail $ in a variety of channels, so they took many different paths through the pandemic. However, their only down month was April 2020, and they led the way in Total Retail’s recovery. Sales got on a roller coaster in 2022, but all months set new records with December reaching a new all-time high, $481B, and an annual record of $4.81T. In 2023, the roller coaster continued. A December lift set a new monthly record of $494.7B & an annual record of $4.997T. Sales fell in Jan>Feb 24, rose in Mar, fell in Apr, rose in May, fell in June, rose in Jul>Aug, fell in Sep, then rose in Oct. The Oct. YOY lift of 5.5% is 21% above their 92>23 avg and all measurements are still positive. Also, 51% of their 41.4% 19>24 growth is real – #1 in performance. Growth: 3.5%; Avg 19>24: +7.2%, Real: +3.9%. This is where America shops. They ended 23 and began 24 strong. In Mar>Apr recovery slowed. It got better in May, worsened in June, rebounded in July, stabilized in Aug, slowed in Sep, grew in Oct.

Inflation is still low, but the cumulative impact is still there. YOY Sales changes vs 23 are improving but overall, progress is still slow. Some changes from September are significant. The Actual drops decreased from 4 to 2 and real drops fell from 5 to 2. Restaurants are back on track and Auto is improving but Gas Stations remain in turmoil. Relevant Retail’s YOY Sales increase was 21% above avg and all measurements are positive for the 5th  time in the last 6 months. Total Retail’s lift was also strong and they are all positive too. After a bad September, the recovery is strongly restarting.

Here’s a more detailed look at October by Key Channels in the Stacked Bar Graph Format

  • Relevant Retail: Growth: +3.5%; Avg: +7.2%, Real: +3.9%. All were up from Sep. Vs Oct 23: 9 were up, Real: 11, Vs Oct 21: 7 were up, Real: 6. Vs 19: Only Dept Stores were actually & really down. Furnishing stores were also really down.
  • All Department Stores – This group was struggling before the pandemic hit them hard. They began recovery in March 2020. Sales are up 5.8% from September but except for vs Oct 23, their actual and real numbers are all negative. They are even actually & really down vs 2019. Growth: -1.2%; Avg 19>24: -0.1%, Real: -2.1%.
  • Club/SuprCtr/$- They fueled a big part of the recovery because they focus on value which has broad consumer appeal. $ales are +7.1% from Sep, and they are positive in all measurements. However, only 44.8% of their 34.6% 19>24 lift is real – inflation’s impact. Ytd growth is below Avg for the 7th straight month. Growth: 3.6%; Avg: +6.1%, Real: +2.9%.
  • Grocery- These stores depend on frequent purchases, so except for the binge buying in 2020, their changes are usually less radical. Actual $ are +4.0% from Sep and positive in all comparisons. However, cumulative inflation has hit them hard. Real $ are only up vs 23 & 19 and only 6% of 19>24 growth is real. Growth: 2.0%; Avg 19>24: +5.2%, Real: +0.3 %.
  • Health/Drug Stores – Many stores are essential, but consumers visit less frequently than Grocery stores. $ are +5.6% from Sep and they are positive in all actual and real comparisons. Because inflation has been relatively low, 64% of their 28.4% growth from 2019 is real. Growth: 2.9%; Avg 19>24: +5.1%, Real: +3.4%
  • Clothing and Accessories – Clothes initially mattered less when you stayed home. That changed in March 2021 with strong growth through 2022. Sales are up 7.9% from Sep and actual sales are up in all comparisons. Real sales are down monthly & Ytd vs 21, but 62% of their 19>24 growth is real. Growth: 2.4%; Avg 19>24: +3.2%, Real:+2.1%
  • Home Furnishings – In mid-2020 consumers’ focus turned to their homes and furniture became a priority. Prices are still deflating but they were high in 2022. Sales are +0.5% from Sep, but negative in all measurements but vs Oct 23 & actual vs 2019. They have sold less product in 2024 than in 2019. Growth: -3.9%;Avg 19>24: +2.3%, Real: -0.2%
  • Electronic & Appliances – This channel has had many issues. Sales fell in Apr>May of 2020 and didn’t reach 2019 levels until March 21. $ are +5.0% from Sep, but they are only actually positive Ytd vs 23 & 19. Due to strong deflation, real sales are positive and exceed actual for all comparisons. Growth: +0.2%; Avg 19>24: +0.7%, Real: +3.7%.
  • Building Material, Farm & Garden & Hardware –They truly benefited from the consumers’ focus on home. In 2022 the lift slowed as inflation grew to double digits. Prices are still deflating, and sales are +11.3% from Sep. Actual sales are only down Ytd vs 23. Prices are deflating vs 23 but are still +16.7% Ytd vs 21. Real sales are positive in all comparisons but Ytd vs 21. However, just 26% of their 19>24 sales growth is real. Growth: -1.0%; Avg 19>24: +5.7%, Real: +1.6%.
  • Sporting Goods, Hobby and Book Stores – Consumers turned their attention to recreation and Sporting Goods stores sales took off. Book & Hobby Stores recovered more slowly. They have been on a monthly sales rollercoaster since June. $ are only +0.5% from Sep. All comparisons but real vs Oct 23 & Ytd vs 2019 are negative. Their inflation rate has been lower than most groups so 72% of their 24.4% growth since 2019 is real. Growth: -3.5%; Avg 19>24: +4.5%, Real: +3.3%.
  • All Miscellaneous Stores – Pet Stores have been a key part of the strong and growing recovery of this group. They finished 2020 at +0.9% but sales took off in March 21 and have continued to grow. Sales are +6.8% vs Sep and positive in all measurements vs 23, 21 & 19. They are 2nd in the % increase vs 19 and now tied for 3rd vs 21. 67.2% of their 40.5% 19>24 growth is real, but their current Ytd lift is still 11% below Avg. Growth: +6.1%; Avg 19>24: +7.0%, Real: 4.9%.
  • NonStore Retailers – 90% of their $ comes from Internet/Mail Order/TV. The pandemic accelerated online spending. They ended 2020 +21.4%. The growth continued in 2021 as sales exceeded $100B for the 1st time and they broke the $1 Trillion barrier. $ are +11.3% from Sep. Their YOY lift grew to +10.6%, but Ytd they are still 45% below Avg. They are positive in all measurements and 81% of their 98.7% 19>24 growth is real. Growth: 8.1%; Avg: +14.7%, Real: +12.4%.

Note: Almost without exception, online sales by brick ‘n mortar retailers are recorded with their regular store sales.

Recap – The Retail recovery from the pandemic was largely driven by Relevant Retail and by the end of 2021 it had become very widespread. In 2022, there was a new challenge, the worst inflation in 40 years. Overall, inflation has slowed considerably from its June 22 peak and now 8 channels are deflating. This should help the Retail Situation. As expected, $ grew for all from Sep, but the 7.6% lift for Relevant Retail was 65% more than their 92>23 avg. This was a big turnaround. Also in September, their 2.7% lift vs 23 was -41% below average, 4 of 11 channels had a YOY $ drop and only 5 of 11 sold more product. In October, their 5.5% YOY lift was 21% above avg, 9 of 11 had a YOY $ lift and all 11 sold more product. Also, in September, there were 2 channels with 6.5+% lifts. In October, it grew to 4. Things are definitely better and there is more good news. Restaurants, Total & Relevant Retail are again positive in all comparisons. Relevant Retail has now been all positive in 5 of 6 months. The recovery has strongly restarted. However, when you look at the Ytd numbers, you realize that we need many more “Octobers” to fully recover.

Finally, here are the details and updated inflation rates for the CPIs used to calculate the impact of inflation on retail groups and channels. This includes special aggregate CPIs created with the instruction and guidance of personnel from the US BLS. I also researched data from the last Economic Census to review the share of sales by product category for the various channels to help in selecting what expenditures to include in specific aggregates. Of course, none of these specially created aggregates are 100% accurate but they are much closer than the overall CPI or available aggregates. The data also includes the CPI changes since 2021 to show cumulative inflation.

Monthly YOY CPI changes of 0.2% or more are highlighted. (Green = lower; Pink = higher)

I’m sure that this list raises some questions. Here are some answers to some of the more obvious ones.

  1. Why is the group for Non-store different from the Internet?
    • Non-store is not all internet. It also includes Fuel Oil Dealers, the non-motor fuel Energy Commodity.
  2. Why is there no Food at home included in Non-store or Internet?
    • Online Grocery purchasing is becoming popular but almost all is from companies whose major business is brick ‘n mortar. These online sales are recorded under their primary channel.
  3. 6 Channels have the same CPI aggregate but represent a variety of business types.
    • They also have a wide range of product types. Rather than try to build aggregates of a multitude of small expenditure categories, it seemed better to eliminate the biggest, influential groups that they don’t sell. This method is not perfect, but it is certainly closer than any existing aggregate.
  4. Why are Grocery and Supermarkets only tied to the Grocery CPI?
    • According to the Economic Census, 76% of their sales comes from Grocery products. Grocery Products are the driver. The balance of their sales comes from a collection of a multitude of categories.
  5. What about Drug/Health Stores only being tied to Medical Commodities.
    • An answer similar to the one for Grocery/Supermarkets. However, in this case Medical Commodities account for over 80% of these stores’ total sales.
  6. Why do SuperCtrs/Clubs and $ Stores have the same CPI?
    • While the Big Stores sell much more fresh groceries, Groceries account for ¼ of $ Store sales. Both Channels generally offer most of the same product categories, but the actual product mix is different.

Retail Channel $ Update – August Monthly & September Advance

In September, YOY Commodities’ deflation increased to -1.3% from -1.2%. Although still deflating, the high prices from cumulative inflation still impact consumer spending. In September, Total Retail sales were -0.03% vs 23, the 1st September drop since 2009. Relevant Retail was +2.5%, but that was 47% below the average increase. Prices are now deflating in many channels but still high vs 21, which can slow actual $ growth and the amount of product sold. There is still a long road to recovery, so we’ll continue to track the retail market with data from 2 reports provided by the Census Bureau and factor in a targeted CPI.

The Census Bureau Reports are the Monthly and the Advance Retail Sales Reports. Both are derived from sales data gathered from retailers across the U.S. and are published monthly at the same time. The Advance Report has a smaller sample size so it can be published quickly – about 2 weeks after month end. The Monthly Report includes data from all respondents, so it takes longer to compile the data – about 6 weeks. Although the sample size for the Advance report is smaller, the results over the years have proven it to be statistically accurate with the Monthly reports. The biggest difference is that the full sample in the Monthly report allows us to “drill” a little deeper into the retail channels.

We will begin with the August Monthly Report and then go to the September Advance Report. Our focus is comparing to last year but also 2021 & 2019. We’ll show both actual and the “real” change in sales as we factor inflation into the data.

Both reports include the following:

  • Total Retail, Restaurants, Auto, Gas Stations and Relevant Retail (removing Restaurants, Auto and Gas)
  • Individual Channel Data – This is more detailed in the Monthly reports, and we’ll focus on Pet Relevant Channels.

The data will be presented in detailed charts to facilitate visual comparison between groups/channels. The charts will show 11 separate measurements. To save space they will be displayed in a stacked bar format for the channel charts.

  • Current Month change – % & $ vs previous month
  • Current Month change – % & $ vs same month last year and vs 2021.
    • Current Month Real change vs last year and vs 2021 – % factoring in inflation
  • Current Ytd change – % & $ for this year vs last year, 2021 & 2019.
    • Current Ytd Real change % for this year vs last year and vs 2021 and 2019
  • Monthly & Ytd $ & CPIs for this year vs last year and vs 2021 which are targeted by channel will also be shown. (CPI Details are at the end of the report)

First, the August Monthly. Only Gas Stations were down from July and there were only 2 actual sales drops vs 23 & 21. We should note that Gas Stations are still selling less product than in 2019. Also, Relevant Retail is all positive again. They have been all positive in 7 of the last 10 months and now in 3 of the last 6. ($ are Not Seasonally Adjusted)

The August Monthly is $0.1B more than the Advance report. Restaurants: +$1.0B; Auto: -$0.8B; Gas Stations: +$0.2B; Relevant Retail: -$0.3B. As expected, $ales were up vs July for all but Gas Stations. A Jul>Aug increase in Total Retail  happens about 80% of the time. However, the 1.5% lift was 33% below the 2.1% avg. There were only 2 drops in actual sales – Monthly & Ytd vs 23 for Gas Stations. There were 3 “real” sales drops, down from 5 last month. Total & Relevant Retail and Restaurants were all positive. Restaurants still have the biggest increases vs 21 & 19 but Relevant Retail stayed at the top of “real” performance vs 2019. However, only 51% of their growth is real.

Now, let’s see how some Key Pet Relevant channels did in August in the Stacked Bar Graph Format

Overall– 7 of 11 were up from July. vs Aug 23, 7 were actually and 8 “really” up. Vs Aug 21, 9 were up but only 5 were real increases. Vs 2019, Off/Gift/Souv were actually & really down and Disc Dept Strs were also really down.

  • Building Material Stores – The pandemic focus on home has produced sales growth of 30.8% since 2019. Prices for the Bldg/Matl group have inflated 15.8% since 2021 which is having an impact. HomeCtr/Hdwe are only actually up vs Aug 21 and Ytd vs 21 & 19, but Farm stores are only actually up vs Aug 21 & Ytd vs 19. Only the “real” measurements vs 21 are negative for Home/Hdwe. For Farm Stores all “real” numbers but vs 19 are negative. Plus, only 23% of the Building Materials group’s 19>24 lift was real. Avg 19>24 Growth: HomeCtr/Hdwe: 5.3%, Real: 1.2%; Farm: 6.4%, Real: 2.2%
  • Food & Drug – Both are truly essential. Except for the pandemic food binge buying, they tend to have smaller changes in $. In terms of inflation, the Grocery rate is only 45% of the rate for Drug/Med products. Drug Stores are positive in all measurements and 63% of their 2019>24 growth is real. Supermarkets’ actual $ are up in all measurements and they are only “really” down vs 2021. However, only 5% of their 19>24 increase is real growth. Avg 19>24 Growth: Supermarkets: +5.1%, Real: +0.3%; Drug Stores: +4.9%, Real: +3.2%.
  • Sporting Goods Stores – They also benefited from the pandemic in that consumers turned to self-entertainment, especially sports & outdoor activities. Sales are up from July but their only positives are actual & real Ytd vs 19. Prices are still deflating, -1.9% vs 23. Deflation started in April 23 and is a big change from +1.1% in 22>23 and +7.9% in 21>22. The result is that 57% of their 34.3% lift since 19 is real. Avg 19>24 Growth Rate is: +6.1%; Real: +3.6%.
  • Gen Mdse Stores – All actual & real sales were up for Club/SupCtrs & $ stores. On the other hand, Discount Dept Stores were only actually up Ytd vs 21 & 19. All real measurements are negative so none of their growth since 2019 is real. The other channels average 44% in real growth. Avg 19>24 Growth: SupCtr/Club: 6.0%, Real: 2.8%; $/Value Strs: +6.3%, Real: +3.1%; Disc. Dept. Strs: +1.6%, Real: -0.5%.
  • Office, Gift & Souvenir Stores – Sales were up 11.1% from July. This set the stage for a better month. They are now only actually down Ytd vs 23 & 19. However, all of their real sales numbers but vs Aug 23 are still negative. Their recovery started late, and their stalled progress may be trying to restart. Avg Growth Rate: -0.2%, Real: -2.2%
  • Internet/Mail Order – Sales are -1.4% from July but set a new monthly record of $112.28B. All measurements are positive, but their Ytd growth, +10.0%, is still only 62% of their average since 2019. However, 82.0% of their 112.3% growth since 2019 is real. Avg Growth: +16.2%, Real: +14.0%. As expected, they are by far the growth leader since 2019.
  • A/O Miscellaneous – Pet Stores are 22>24% of total $. In May 2020 they began their recovery which reached a record level of $100B for the first time in 2021. In 2022 their sales dipped in January, July, Sept>Nov, rose in December, fell in Jan>Feb 23, grew Mar>May, fell in Jun>Aug, rose in Sep>Nov, fell in Dec>Jan, grew in Feb>May, then fell in Jun>Aug. However, all measurements are positive. They are still in 2nd place, behind the Internet, in the % increase vs 19 and vs 21. Also, 73% of their 54.8% growth since 2019 is real. Average 19>24 Growth: +9.1%, Real: +7.0%.

August had its usual lift as 7 small channels were up vs July. The Total Retail YOY lift was -48% below Avg but 7 of 11 smaller channels and 3 of 4 big groups were up vs Aug 23. Prices are deflating in 9 of 11 channels but cumulative inflation still matters. Many sales lifts are lower as 6 of 11 channels were really down vs Aug 21. The Retail Recovery appears to have restarted. The commodities CPI fell to -1.3% in September. Let’s see if continuing deflation impacts Retail $ales.

Aug>Sep sales were down for all. An Aug>Sep Total Retail drop has happened every year since 1992. However, the -7.5% drop is 21% more than the -6.2% average. All but 4 actual YOY $ measurements are positive for all. 3 of the drops are vs Sep 23 – Gas Stations, Auto & Total Retail. Total Retail was down -0.03% vs 23, the 2nd drop in 24 but 1st September drop since 2009. The Relevant Retail lift vs Sep 23 was -47% below their average. The Restaurants lift was -76% below average. Inflation is a big factor. The CPI for all commodities dropped to -1.3% but is still 10.3% vs 21. There is some “real” retail “not so good” news. In August, 2 measurements were “really” down vs 23 & 21. In September, 5 were really down. Only Relevant Retl was all positive. Of note: from Nov 23>Feb 24 Relevant Retail had 4 straight months of all positive measurements. After 2 months with a negative, they have been all positive in 4 of the last 5 months.

Overall – Inflation Reality – For Total Retail, deflation increased to -1.3% but YOY sales dropped vs Sep 23. For Restaurants, inflation remains high, +3.8% and they are now really down vs Sep 23. Gas prices fell but that group is still in turmoil. Auto prices rose but are still deflating. Sales fell vs Sep 23 and are really down in 2 measurements. Inflation rose from -0.1% to 0.1% for Relevant Retail but sales are again all positive. Their progress continues but is slowing.

Total Retail – Since June 20, every month but April 23 & June & September 24 has set a monthly sales record. In 2023, Sales were on a roller coaster. Up Jul>Aug, down Sept, up Oct>Dec, down Jan 24, up Feb>Mar, down April, up May, down June, up in Jul>Aug, down in September. Prices are now -1.3%, but September YOY sales are down for the 1st time since 2009. Ytd Sales are up 2.6% vs 23, only 39% of their avg 19>24 growth. Plus, only 39% of the 19>24 growth is real. YOY pricing in Total Retail is still deflating but we see its cumulative impact. Growth: 23>24: 2.6%; Avg 19>24: +6.7%, Real: +2.8%.

Restaurants – They were hit hard by the pandemic and didn’t begin recovery until March 2021. However, they have had strong growth since then, exceeding $1T for the 1st time in 2023 and set another monthly sales record in September. They have the biggest Ytd increases vs 23, 21 & 19 but are now really down vs Sep 23. Inflation slowed to 3.8% in September but is still +19.1% vs 21 and +26.9% vs 19. 35.6% of their 49.1% growth since 19 is real and they remain 3rd in performance behind Relevant & Total. Recovery started late but inflation started early. Growth: 5.0%; Avg 19>24:+8.3%, Real: +3.3%. They just account for 13.6% of Total Retail $, but their performance has helped Total Retail.

Auto (Motor Vehicle & Parts Dealers) – They actively worked to overcome the stay-at-home attitude with great deals and a lot of advertising. They finished 2020 up 1% vs 2019 and hit a record $1.48T in 2021 but much of it was due to skyrocketing inflation. In 22, sales got on a rollercoaster. Inflation started to drop mid-year, but it caused 4 down months in actual sales which are the only reported sales negatives by any big group in 21>22. This is bad but their Y/E real 2022 sales numbers were worse, down -8.2% vs 21 and -8.9% vs 19. 2023 was a true rollercoaster but the $ set a new record, $1.595T. $ fell in Jan 24, grew Feb>Mar, fell in Apr, grew in May, fell in June, grew in Jul>Aug, fell in September. Actual & Real $ vs 23 and Real Ytd vs 21 are negative. Only 17.8% of 19>24 growth is real. Growth: 0.9%; Avg 19>24: +5.4%, Real: +1.0%.

Gas Stations – Gas Stations were hit hard by “stay at home”. They started recovery in March 2021 and inflation began. Sales got on a rollercoaster in 2022 but reached a record $583B3. Inflation started to slow in August and prices slightly deflated in Dec 22 & Feb 23, then strongly fell in Mar>Jul to -20.2%. In August they rose to -3.7%. In Sep they were +2.7% but began deflating to -4.2% in Feb 24. In Mar>May they grew, fell in June, rose in July, then fell in Aug>Sep. $ are down monthly & Ytd vs 23. Real sales are down Monthly & Ytd vs 21 and 19. Growth: -2.4%; Avg 19>24: +4.4%, Real: -0.9%. They show the cumulative impact of inflation and demonstrate how deflation can be both a positive and a negative.

Relevant Retail – Less Auto, Gas and Restaurants – They account for ≈60% of Total Retail $ in a variety of channels, so they took many different paths through the pandemic. However, their only down month was April 2020, and they led the way in Total Retail’s recovery. Sales got on a roller coaster in 2022, but all months set new records with December reaching a new all-time high, $481B, and an annual record of $4.81T. In 2023, the roller coaster continued. A December lift set a new monthly record of $494.7B & an annual record of $4.997T. Sales fell in Jan>Feb 24, rose in Mar, fell in Apr, rose in May, fell in June, rose in Jul>Aug, then fell in September, a normal pattern. The September YOY lift of 2.5% is -47% below their 92>23 avg but all measurements are again positive. Also, 51% of their 41.3% 19>24 growth is real – #1 in performance. Growth: 3.3%; Avg 19>24: +7.3%, Real: +3.9%. This is where America shops. They ended 23 and started up 24 strong. In Mar>Apr recovery slowed. In May, things improved, worsened in June, rebounded in July, stabilized in August, then slowed in September.

Inflation is still low, but the cumulative impact is still there. YOY Sales changes are below average and even dropping. The overall progress is slowing. Some changes from August are significant. The Actual drops increased from 2 to 4 and real drops grew from 2 to 5. Gas Stations remain in turmoil and the progress in Auto & Restaurants is slowing. Relevant Retail’s YOY Sales increase slowed but all measurements are positive for the 4th  time in the last 5 months. Total Retail broke this pattern in September with a YOY sales drop. After a bad June and the Jul>Aug rebound, the recovery is slowing again in September.

Here’s a more detailed look at September by Key Channels in the Stacked Bar Graph Format

  • Relevant Retail: Growth: +3.3%; Avg: +7.3%, Real: +3.9%. All channels were down from August. Vs Sep 23: 7 were up, Real: 5, Vs Sep 21: 7 were up, Real: 5. Vs 19: Only Dept Stores were actually & really down. Furnishing stores were also really down.
  • All Department Stores – This group was struggling before the pandemic hit them hard. They began recovery in March 2020. Sales are down -13.4% from August and their actual and real numbers are all negative. They are even actually & really down vs 2019. Growth: -1.4%; Avg 19>24: -0.2%, Real: -2.1%.
  • Club/SuprCtr/$- They fueled a big part of the recovery because they focus on value which has broad consumer appeal. $ales are -8.8% from August, but they are positive in all measurements. However, only 44.3% of their 34.5% 19>24 lift is real – inflation’s impact. Ytd growth is below average for the 6th straight month. Growth: 3.5%; Avg: +6.1%, Real: +2.9%.
  • Grocery- These stores depend on frequent purchases, so except for the binge buying in 2020, their changes are usually less radical. Actual $ are -4.4% from August, but positive in other comparisons. However, cumulative inflation has hit them hard. Real $ are only up Ytd vs 23 & 19. Only 5% of 19>24 growth is real. Growth: 1.8%; Avg 19>24: +5.2%, Real: +0.3 %.
  • Health/Drug Stores – Many stores are essential, but consumers visit less frequently than Grocery stores. $ are -2.3% from August, but they are up in all actual and real comparisons. Because inflation has been relatively low, 64% of their 27.8% growth from 2019 is real. Growth: 2.8%; Avg 19>24: +5.0%, Real: +3.3%
  • Clothing and Accessories – Clothes initially mattered less when you stayed home. That changed in March 2021 with strong growth through 2022. Sales are down -14.2% from August, but actual sales are up in all comparisons. However, real sales are only up Ytd vs 23 & 19, but 62% of their 19>24 growth is real. Growth: 2.4%; Avg 19>24: +3.3%, Real:+2.1%
  • Home Furnishings – In mid-2020 consumers’ focus turned to their homes and furniture became a priority. Prices are still deflating but they were high in 2022. Sales are -9.3% from August and negative in all measurements but actual vs 2019. They have sold less product in 2024 than in 2019. Growth: -5.1%;Avg 19>24: +2.3%, Real: -0.3%
  • Electronic & Appliances – This channel has had many issues. Sales fell in Apr>May of 2020 and didn’t reach 2019 levels until March 21. $ are -9.7% from August and they are only actually positive Ytd vs 23 & 19. Due to strong deflation , real sales are positive for all but vs Sep 23. Note: Their growth is now below their 19>24 average. Growth: +0.6%; Avg 19>24: +0.7%, Real: +3.7%.
  • Building Material, Farm & Garden & Hardware –They truly benefited from the consumers’ focus on home. In 2022 the lift slowed as inflation grew to double digits. Prices are still deflating but sales are -7.0% from August. Actual sales are only down Ytd vs 23. Prices are deflating but they are still 14.2% above 21 so real sales vs September & Ytd 21 are negative. Also, just 24% of their 19>24 sales growth is real. Growth: -2.0%; Avg 19>24: +5.6%, Real: +1.5%.
  • Sporting Goods, Hobby and Book Stores – Consumers turned their attention to recreation and Sporting Goods stores sales took off. Book & Hobby Stores recovered more slowly. After a big June lift, $ fell -1.5% in July, rebounded +11.5% in August, then fell -14.0% in September. All comparisons, actual & real, but Ytd vs 2019 are negative. Their inflation rate has been lower than most groups so 71% of their 24.6% growth since 2019 is real. Growth: -3.9%; Avg 19>24: +4.4%, Real: +3.2%.
  • All Miscellaneous Stores – Pet Stores have been a key part of the strong and growing recovery of this group. They finished 2020 at +0.9% but sales took off in March 21 and have continued to grow. Sales are -0.9% vs August, but positive in all measurements vs 23, 21 & 19. They are still 2nd in the % increase vs 19 and 3rd vs 21. 67.3% of their 41.0% 19>24 growth is real, but their current Ytd lift is still 13% below average. Growth: +6.2%; Avg 19>24: +7.1%, Real: 5.0%.
  • NonStore Retailers – 90% of their $ comes from Internet/Mail Order/TV. The pandemic accelerated online spending. They ended 2020 +21.4%. The growth continued in 2021 as sales exceeded $100B for the 1st time and they broke the $1 Trillion barrier. Their $ are -4.7% from August but their YOY lift grew to +8.4% in September. However, their Ytd lift is still 45% below average. They are positive in all measurements and 81% of their 99.5% 19>24 growth is real. Growth: 8.2%; Avg: +14.8%, Real: +12.5%.

Note: Almost without exception, online sales by brick ‘n mortar retailers are recorded with their regular store sales.

Recap – The Retail recovery from the pandemic was largely driven by Relevant Retail and by the end of 2021 it had become very widespread. In 2022, there was a new challenge, the worst inflation in 40 years. Overall, inflation has slowed considerably from its June 22 peak and now 7 channels are deflating. This should help the Retail Situation. As expected, $ fell from August but the -6.5% drop for Relevant Retail was 20% more than their 92>23 avg. This was a big drop, but the big problem has been slowing YOY monthly increases. In August, their 3.4% lift vs 23 was -27% below average, only 3 of 11 channels had a YOY $ decrease and 10 of 11 sold more product. In September, their 2.5% YOY lift was -47% below average, 4 of 11 had a $ decrease and only 5 of 11 sold more product. Also, in August, there were 3 channels with lifts of 6.5+%. In September, only 2. Plus, in August, 1 channel, Electronics/Appliances again had a Ytd lift above their 19>24 Avg. That ended in September. Things are definitely worse, but here is some good news. Relevant Retail is again positive in all comparisons. That has happened in 4 of the last 5 months. The recovery slowed in June, strongly restarted in July, continued in August, but is definitely slowing again!

Finally, here are the details and updated inflation rates for the CPIs used to calculate the impact of inflation on retail groups and channels. This includes special aggregate CPIs created with the instruction and guidance of personnel from the US BLS. I also researched data from the last Economic Census to review the share of sales by product category for the various channels to help in selecting what expenditures to include in specific aggregates. Of course, none of these specially created aggregates are 100% accurate but they are much closer than the overall CPI or available aggregates. The data also includes the CPI changes since 2021 to show cumulative inflation.

Monthly YOY CPI changes of 0.2% or more are highlighted. (Green = lower; Pink = higher)

I’m sure that this list raises some questions. Here are some answers to some of the more obvious ones.

  1. Why is the group for Non-store different from the Internet?
    • Non-store is not all internet. It also includes Fuel Oil Dealers, the non-motor fuel Energy Commodity.
  2. Why is there no Food at home included in Non-store or Internet?
    • Online Grocery purchasing is becoming popular but almost all is from companies whose major business is brick ‘n mortar. These online sales are recorded under their primary channel.
  3. 6 Channels have the same CPI aggregate but represent a variety of business types.
    • They also have a wide range of product types. Rather than try to build aggregates of a multitude of small expenditure categories, it seemed better to eliminate the biggest, influential groups that they don’t sell. This method is not perfect, but it is certainly closer than any existing aggregate.
  4. Why are Grocery and Supermarkets only tied to the Grocery CPI?
    • According to the Economic Census, 76% of their sales comes from Grocery products. Grocery Products are the driver. The balance of their sales comes from a collection of a multitude of categories.
  5. What about Drug/Health Stores only being tied to Medical Commodities.
    • An answer similar to the one for Grocery/Supermarkets. However, in this case Medical Commodities account for over 80% of these stores’ total sales.
  6. Why do SuperCtrs/Clubs and $ Stores have the same CPI?
    • While the Big Stores sell much more fresh groceries, Groceries account for ¼ of $ Store sales. Both Channels generally offer most of the same product categories, but the actual product mix is different.