Spending, CPI, demographics of overall market

Pet Market Growth – How much is “real”? – Part 2 – What segments are driving price increases?

In the period from 1997 to 2014 prices in the Total Pet Market increased 66.8%. Was this an “across the board increase” or are there specific areas “driving” Petflation? In 1997 the USBLS officially divided the Pet Market into segments and established it as the base year for future calculations. The segments are:

  • Veterinary Services
  • Pet Services – Non–Vet: grooming, boarding, etc.
  • Pet Food
  • Pets, Pet Supplies & Accessories

Let’s take a look at the price increase history by segment

PetSegmentsCPI

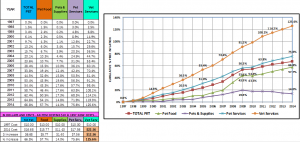
Perhaps the most obvious trend in the chart is the huge increase in Veterinary prices – 125.6%. This is 48% greater than the increase in Human Medical services (86%). A service that cost $100 in 1997 now costs $225.

Pet Service Prices have increased 75.6% – 60% faster than the overall National CPI (47.2%). A $22 service in 1997 now costs $50.

The Prices in the huge Pet Food segment have increased 57.7%. This is only slightly greater than the 53% increase in the comparable Human Food & Beverage market. There have also been variations. After big increases in 2008 & 2009, prices actually dropped in 2010 and the increases since then have been more moderate.

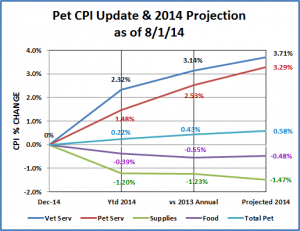
The Pets and Pet Supplies segment tells a totally different story. Driven by Supplies, this segment had regular small increases for years. In 2005 these increases began to accelerate with huge increases in 2008 and 2009. Then in 2010 prices suddenly dropped and have stayed down in all the succeeding years. In fact we have actually even seen further declines. The total Petflation for Pet Supplies from 1997 to 2014 is only 14%.

Now it is easier to see how the segments are interacting to produce the overall Petflation rate of 66.8%.

Pet Food is the largest segment so changes here have the greatest impact on the Total. The inflation rate of 57% in Pet Food is less than 9% greater than Food & Beverages so this has a stabilizing influence.

The big drivers of Petflation are Services – both Veterinary (125%) and NonVet (75%). The NonVet Services is a small segment but Veterinary has become large and is “fueling” much of the increase.

The CPI increase in the Pet Supplies segment has invariably been low and has even become negative. These consistently low prices have helped mitigate overall Petflation.

Now what does this all mean? What is the Industry bottom line?

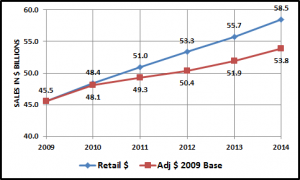
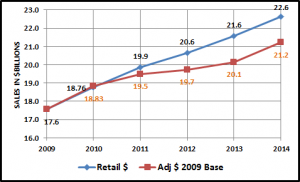
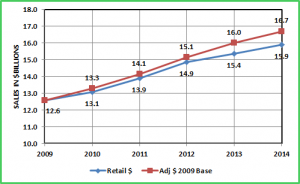
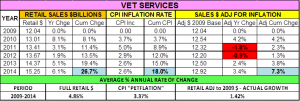
In the next post we will blend the CPI increase with the Retail sales, factor out price increases and show the performance of the market in terms of the amount of Pet Supplies and Services sold.


Pet Market Growth – How much is “real”? – Part 1- CPI “Petflation”

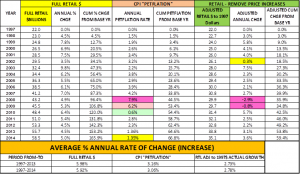
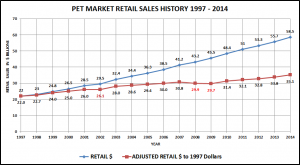
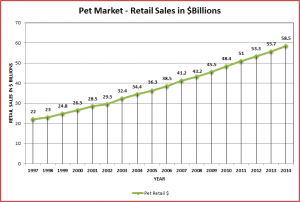
The Pet Industry has shown outstanding and continuous retail growth in the last 17 years. From 1997 to 2014 (projected) it has grown 165.9%. This is an average annual growth rate of 5.92%.

Here’s what it looks like:

PetMkt-FullRetl

Why pick 1997 as a “starting” year? Why not 1996 or 1994? As it turns out 1997 was a very significant year for the industry. In 1997 the United States Bureau of Labor and Statistics (USBLS) recognized the growing significance of the market by dividing the Pet market into distinct segments and establishing 1997 as the base year for future measurements.

The USBLS produces a variety of important economic statistics but perhaps the most famous and arguably most impactful is the CPI – Consumer Price Index – the inflation rate. Changes in the CPI directly affect the income of over 80 million Americans. It is also used by the President, Congress and the Federal Reserve Board in formulating fiscal and monetary policies.

We all know that price increases in Pet Products are a part of the business. When the costs of energy, labor and raw materials rise, price increases become a business necessity. However, since price increases can directly affect consumer purchasing decisions, they can’t be taken lightly.

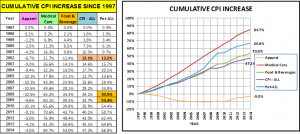
Let’s take a look at “Petflation” since 1997 and see how it compares to the overall CPI and to some other industries:

CPI-1

The first thing that you notice is the strong and unchecked increase in prices for human medical services. Regardless of overall economic conditions, medical prices have consistently gone up. This has to be a factor in our current health care situation.

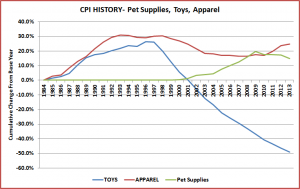
By the way, prices don’t always go up. Prices in the Apparel market are actually 3% less than they were 17 years ago. A big factor is probably the “offshore” movement of manufacturing in this segment.

But back to Pet. The CPI increase in overall Pet Products and Services is 66.8%. It is not as great as Medical but it is 26% higher than Food & Beverage (53.0%) and 41% higher than the overall CPI (47.2%).

Was it always this way? The answer is no. The first year that Petflation exceeded the national CPI was 2002. It also began to accelerate in 2006 with major increases in 2008 and 2009 – in the midst of the national economic recession.

In 2010 this abrupt upward spiral stopped. In the years since, Petflation has “mirrored” the overall CPI and the Food & Beverage Market.

What does all this mean? How has it affected the consumer? We will get to that “bottom line” but first we’ll look at what is “driving” the Pet price increases. Remember the USBLS divided the market into segments.

In our next post we’ll look at the CPI since 1997 for each of the segments in the Pet Market. Have prices gone up equally across the board or….

[box] Note on Data in this and related Posts: The Pet Retail Sales data is taken from numbers published by the APPA which they obtained from various sources. The APPA published sales of $21B for 1996 and $23B for 1998. The $22B sales for 1997 were estimated by assuming an equal growth rate of 4.65% for 1996>97 and 1997>98. The CPI data is the annual rate from reports downloaded from the USBLS website. For 2014 estimates, the change in CPI was assumed to be the same as for 2013.[/box]

Welcome to PetBusinessProfessor.com

Welcome to PetBusinessProfessor.com. My name is John Gibbons. I have been in consumer products sales and marketing for 35 years – the last 25 years have been spent in the Pet Industry.

My responsibility during that time has been National Sales and/or Marketing for such companies as TFH/Nylabone, Aspen Pet (acquired by PetMate), Coastal Pet and Paragon Pet Products.

Strategies, tactics and execution have been my focus in driving the profitable growth of these businesses.
I have learned a few things along the way – often the “hard way” ….and even developed some tools, templates and techniques to make the journey for others a little easier.

I established this website to encourage the exchange of these ideas among Pet Businesses and continue learning new ones. The industry only remains strong if the business elements remain strong.

My experience is primarily from the viewpoint of the manufacturer. However, the topics that we will discuss should be relevant to any Pet Business.

The Pet Market starts with the Manufacturer and ends with the consumer. Take a look at the chart below:

PatternsOfDistribution

Unless the Manufacturer is selling directly to the consumer out of their own warehouse, there will be other businesses involved. As you can see there are a number of different options. “Partnerships” between businesses are generally required to reach the ultimate customer – the consumer.

I have found one universal rule in business –
“For a partnership to work, everyone must make money!”

Some of the topics we cover will be of immediate interest to everyone. Others will be more directed to a specific group. However, all are directly relevant to maintaining a strong Pet Industry so they are relevant to us all.

I look forward to “talking” with all of you!