The U.S. Pet Industry had basically a “flat” year in 2016. Spending fell slightly to $67.29B, down $0.46B (-0.7%). However, as we have learned, the industry truly is a “sum” of its integral segments. Each segment has very specific and often very different buying behavior from the many consumer demographic segments. For this reason, we’re going to analyze each of the segments first. This will put the final analysis of Total Pet Spending into better perspective. Note: The numbers in this report come from or are calculated by using data from the current and past US BLS Consumer Expenditure Surveys. In 2016, this was gathered by the U.S. Census Bureau from over 40,000 interviews and spending diaries. The final data was then compiled and published by the US BLS.
We will start with the largest Segment, Pet Food (and Treats). In 2016 Pet Food Spending totaled $26.5B in the U.S. This is a $2.99B (-10.1%) decrease from 2015. For most of us, this is quite a shock coming after the spectacular $5B increase in 2015 which was attributed to consumers upgrading to Super Premium Foods. Doesn’t Pet Food Spending just increase every year? Isn’t that a sure bet? Well, as it turns out, the story is a little more complex than that. The following chart documents annual Pet Food Spending since 1997 in full Retail Dollars and adjusted for inflation.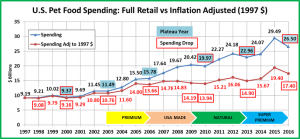
An interesting pattern is immediately apparent. Retail Pet Food Spending increases for 2 consecutive years then reaches a plateau year or even drops. The pattern is repeated with one notable exception – the time from 2006 to 2010. As you recall, this was a tumultuous period for the entire retail marketplace. In 2009 the Great Recession caused the first drop in U.S. Retail Spending since 1956. The situation in Pet Food was even more complex with the Melamine recall in 2007. Pet Food Prices skyrocketed in 2008 and 2009 as consumers insisted on made in USA products …with USA ingredients. The CPI adjusted sales show that the first Recession related impact on Pet Food purchases occurred in 2009 but the full retail impact wasn’t felt until 2010.
Pet Food seems to be driven by short term trends. A new food trend “catches the consumers’ attention” and grows…for 2 years. Then sales plateau or even drop…and we’re on to the next “must have”. It is obviously more complicated than this simplistic explanation. However, it does appear that the big drop in Pet Food Spending in 2016 shouldn’t have been totally unexpected considering the spending history of this huge Industry segment
I’m not an expert on the Pet Food segment but I included my view of the more recognizable trends. Sales seem to have really taken off after 2003. That was the year that Iams went into the Mass Market and may have signaled the first phase of the premiumization of Pet Food. Then came “Made in USA” because of the melamine recall which was followed by “Natural”. Then in 2014, we got “Super Premium”. What is next? The indication is ever-increasing “humanization”.
Now, let’s look at some specifics. In 2016, the average U.S. Household (pet & non-pet) spent a total of $204.71 on Pet Food. This was an 11.0% decrease from the $230.06 spent in 2015. This doesn’t “add up” to a 10.1% decrease in total Food Spending. With additional data provided from the US BLS, here is what happened.
- 1.0% More U.S. households
- Spent 12.6% less $
- 1.8% more often
By the way, if 65% of U.S. H/H’s are pet parents then their annual Pet Food Spending is $314.94. Let’s look at a rolling history of Pet Food Spending over the course of the “Super Premium Cycle”.

Pet Food Spending dipped in the first half of 2014. This corresponds to the beginning of a 2 year deflationary period in this segment. During deflation, in a “need” category like Food, you don’t buy more, you just spend less. The spectacular lift in Pet Food Spending beginning in the second half of 2014 came from a fundamental change in spending behavior. Consumers began to buy more Super Premium Food and Med/Supplements in Treat form, all of which cost more.
Then spending began to fall in the first half of 2016 and the decline intensified in the second half. Does that mean that Pet Parents were giving up on Super Premium and going back to their “old ways”? In some cases…maybe. However, consider this fact about current U.S. Consumers…price is the biggest driver (75%) of their behavior.
Once a consumer has decided on a specific type of product or brand, there is only 1 priority. Where and how can I buy it cheaper? Consumers spent 12.6% less on their Pet Food purchases in 2016. Were discounts available?
- Competition between manufacturers invariably generates lower prices. Let’s look at the number of exhibitors offering either Dog and/or Cat Food or treats at recent SuperZoos:
- In 2014 there were 105 Companies offering Dog/Cat Food and 230 selling Dog/Cat Treats
- In 2015 there were 107 with Food and 239 with treats – Not much change
- In 2015 we had the huge lift in Food/Treat spending. By the time we reached SZ 2016 there were 134 companies offering Food – (up 27.6% from 2014) and 304 with Treats – (up 32.2%)
- By 2017 there were 147 Food companies offering Pet Food (+40.0%) and 313 with Treats (+36.1%)
These new companies created and felt intense competitive pressure for the “upgrading” consumers. However, there was also intense pressure from “regular” food companies as they were actually losing consumers to the “upgrade”.
- Competition between retailers and retail channels also is a price battleground.
- There has always been a price war between Independent Pet Shops, Pet Chains and Mass Market Retailers. With the consumer price falling as a brand moves to Chain Pet, then Mass, the only way to protect the indies and pet chains is through strict channel product segregation. This lasts for a while but as brands grow they want to “reach” even more consumers, so….
- The Internet is a new player in this Pet Food Game. With no brick ‘n mortar overhead, they can offer discounts of 10>15% or more and deliver it to the consumers doorstep.
- In fact Non-refrigerated, Premium Pet Food may be an ideal internet product
- While consumers have a lot of choices for their own dinner – cook, sit down at a restaurant, grab fast food or have it delivered, their pet needs the same thing every day at the same time – without fail.
- Pet Products (primarily food) ranks #3 on the consumers’ list of reasons they “need” to go shopping. Only milk and bread drive more trips to the store.
- If you need the same amount of pet food every day, without fail, you can make a very strong case for auto delivery to your door. You save 15% or more. You save a lot of trips to the store and…your pet is always “covered” with the pet food quality/brand of your choice. This begins to look a lot like a “no brainer”, especially as people opt for higher quality food.
- The big question for the future is, “Can you effectively introduce a new pet food product/trend solely through the internet?” Consumers can certainly read about the benefits on the internet but they can’t see it, touch it, try it out or have a personal conversation about it unless they are in a store. This personal “contact” has always been a key factor for consumers in their decisions about Pet Products.
I think that it is pretty safe to say that there were discounts available. In fact 2016 may have been one of the most price competitive Pet Food markets in history – across all of its segments. U.S. consumers were seeking and finding “deals”.
Now let’s look at some specific Pet Food Spending Demographics. First, we’ll look at income. We will do it a little differently as we will show the annual spending from 2013 through 2016 so you can see the trend for the whole cycle.
The 2016 numbers in this chart and the one on Age Groups are highlighted to give you a better visual “read”.
- If outlined in green, sales were up in 2016
- If outlined in red, sales were down in 2016
- If highlighted in green, sales were up since 2013
- If highlighted in pink, sales were down since 2013
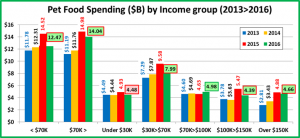
The National Numbers were: 2015>16 – Down – $2.99B (-10.1%); 2013>2016 – Up $3.54B (+15.6%)
- Under $30K: In 2016 (31.1% of H/H’s) – $116.18 per H/H – $4.48B – down $0.45B (-9.2%). Obviously this group is very price sensitive. The group also continues to shrink in size, down -2.0% in 2016. Since 2013, it is the only income group spending less on Pet Food but it is only down $0.01B. (-0.2%). However, there were 6.5% fewer H/H’s (3M) in 2016 than in 2013 so H/H spending actually increased. This group still has an ongoing commitment to their pets.
- $30K>$70K: In 2016 (31.9% of H/H’s) – $182.68 per H/H – $7.99B – Down $1.59B (-20.0%). Income triples. Home ownership doubles. It is a more diverse group but the average H/H still spends more than their after tax income. The break-even point doesn’t happen until Gross Income reaches $57K. This group value shops but their decrease is so large that some members may have backed down from the upgrade. Since 2013, spending is up $0.38B (+9.2%)
- $70K>$99K: In 2016 (14.1% of H/H’s) – $258.40 per H/H – $4.98B – Up $0.35B (+7.7%). This group is near the top of the “middle income” but still value conscious. Perhaps the price “war” finally reached a retail where the higher quality food became appealing. Since 2013 spending is up $0.38B (+8.3%)
- $100K>$149K: In 2016 (12.5% of H/H’s) – $283.64 per H/H – $4.39B – Down $1.08B (-19.7%) This group has a high income but also has large families with the resulting responsibilities. They look for deals too. Also, since 81% have college degrees, it makes sense that they would excel at buying smart. Since 2013 spending is up $0.61B (+16.1%)
- $150K> (10.5% of H/H’s) – $375.45 per H/H – $4.66B – Down $0.22B (-4.5%). 92% of this group have college degrees so they certainly know how to save. However, they have reached an income level where price is not as important. Since 2013 spending is up $1.85B (+65.8%) – half of the national increase. Money certainly makes choices easier.
In 2015, every income group except $70K>$99K increased its spending. With the spending drop in 2016, the positions were exactly reversed. This strongly suggests that there was a universal factor at work. It appears to be a competitive price war between manufacturers and retailers over the consumer’s Pet Food $. Since 2013, all segments but the <$30K group have increased total Pet Food Spending, although 52% of the national increase came from the over $150K group.
Now let’s take a look at another Key Demographic Category – Age
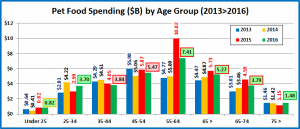
Again, the National Numbers were: 2015>16 – Down – $2.99B (-10.1%); 2013>2016 – Up $3.54B (+15.6%)
In 2016 Pet Food Spending, it was both ends against the middle. Under 34 and over 75 were up while 35>74 was down.
- 55>64 (19.0% of H/H’s) – $310.48 per H/H – $7.41B – Down $2.61B (-26.0%). This group was the key to the huge 2015 increase in Food Spending and also to last year’s drop. They have the 3rd highest income and they are all Baby Boomers so naturally, 1.1% of their total spending is on their pets. Although some probably “rolled back” the upgrade, many more found deals on the product they wanted and spent less. They doubled their pet food spending in 2015 and 75% of that increase “stayed put.” Since 2013 spending is up $2.64B (+55.3%)
- 65>74 (14.0% of H/H’s) – $217.86 per H/H – $3.79B – Down $0.8B (-17.5%). Much of this group is retired, with lower income, so searching for “discounts” is the norm. Some “upgraders” probably fell by the wayside but there are a growing number of Baby Boomers in the group and 1.0% of their total expenditures was on their Pets, just slightly behind the 55>64, all Boomer Group. Since 2013 spending is up +0.78B (+25.9%)
- 75> (10.0% of H/H’s) – $114.62 per H/H – $1.48B – Up $0.33B (+29.3%). Both the effort and the expense of Pet Parenting become issues as we reach 75+. However, it appears that the discounted prices got this group “back on track”. Since 2013 spending is up +0.02B (+1.4%) – essentially flat.
- 45>54 (18.6% of H/H’s) – $228.78 per H/H – $5.47B – Down $0.4B (-6.9%) This group has the highest income and the most in Total H/H expenditures. Up until 2015 they were #1 in Pet Food spending. They buy premium food but didn’t fully participate in the 2015 upgrade. They did take advantage of the 2016 discounts and spend less. The number of Boomers in this group is declining, replaced by Gen X. Since 2013 spending is down -$0.51B (-8.5%)
- 35<44 (16.6% of H/H’s) – $181.15 per H/H – $3.84B – Down -$0.21B (-5.3%) They are 2nd in income and expenditures but have the biggest families. Searching for Value is a way of life. Since 2013 spending is down -$0.45B (-10.5%). These Gen Xers just haven’t kept pace with the trends in Pet Food
- 25>34 (16.1% of H/H’s) – $171.16 per H/H – $3.70B –Up $0.71B (+23.8%) Their income is growing but so is spending. With 90% of their after tax income committed, they have strong financial pressures. In late 2014 they opted to upgrade their food. However, they backed down in 2015. The competitive pricing in 2016 must have “struck the right chord” as these older Millennials came racing back. Since 2013 spending is up +$0.89B (+31.7%).
- <25 (5.6% of H/H’s) – $95.34 per H/H – $0.82B – Flat $0.0B (+0.0%) These youngest Millennials continue getting started as Pet Parents, maintaining 2015 spending levels. Since 2013 spending is up +$0.18B (+28.1%).
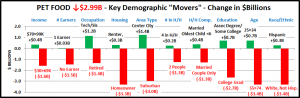
The chart below has some other key demographic “movers” behind the 2016 Pet Food Spending decrease. Take a look.
Summary
In the current “deflated”, highly price competitive market, it is difficult to get to the bottom of the decrease in spending. There certainly was no drop in pet ownership. So, did the decrease in $ come because consumers backed down from their 2015 upgrade to Super Premium foods or are they just taking advantage of the price competition to buy the products that they want for a cheaper price? The answer is some of both. A certain percentage of lower income and price sensitive groups, like Retirees may very well have switched back to regular food. However, it appears that the bulk of the decrease comes from value shopping across a wide range of households.
Make no mistake. Price matters to U.S. consumers, especially on products that they buy on a regular basis. Consider that 50% of U.S. households spend more than their after tax income – a total deficit of -$550B. In fact, if you start from the lowest income group and work your way up, the total after tax income of the “bottom” 90% of U.S. households is only $2.2B more than their total expenditures (0.04%). Virtually every U.S. household compares products and prices before they buy. This process and for that matter, the actual buying, has gotten significantly easier in our internet world.
The biggest spending drops came from College Educated, Suburban, Homeowners. These are the smart pet parents that first saw the benefit of the upgraded food. It’s a good bet that they figured out how to buy what they want… cheaper.
On the flip side, the demographic groups showing spending increases in today’s market are definitely upgrading their food and/or adding pets to their families. The 25>34 year old Millennials are a prime example. Their $0.7B increase is reflected in and supported by increases for 4 person households, married couples with their oldest child under 6 and Technical workers. There also were increases by renters and Center City residents, which is more good news.
Probably the most concerning data is from the 35>54 age group, which is largely Gen Xers. Overall, they make and spend the most money of any age group. Their Pet Food spending in 2016 was down but they were also the only age group to show decreased spending in this segment from 2013. We’ll take a better look at this situation when we see the generation reports.
One of the key things that we learned in this analysis is that Pet Food spending doesn’t just go up every year. It appears to flow in 3 year cycles, corresponding with market trends. Two years of increases is followed by a plateau year or even a spending drop. Then consumers move on to the next “must buy”. Looking at this history, the 2016 drop fits the pattern. If history continues to repeat itself, we should have a flat first half of 2017. Then spending should turn sharply upward as the consumers respond to the continued “humanization” of our Pet Food. However, we’ll just have to wait and see.


