According to the numbers from the American Pet Products Association (APPA), the total U.S. Pet Industry increased $2.76B (4.1%) in 2017 to $69.51B. This is less than half of last year’s increase. However, remember that the 2016 numbers were driven significantly upward by an adjustment to Pet Food $ which research had showed to be too conservative. The increase in 2017 is more reflective of the consistent growth in the 4+% range since 2011.
However, 2017 was not without excitement as the overall inflation for the industry hit a record low of 0.4%. This had a definite impact on many industry segments and meant that overall, 90.2% of the Total Pet Sales Increase was a real increase in the amount of Pet products and services sold. Less than 10% came from price increases – also a new record.
In this report we’ll take a closer look at the performance of the total market and importantly, the individual segments. The report will cover 2017, but also put this year’s numbers into perspective for the period from 2009 to 2017.
Here are the specifics from 2017.
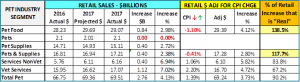
OBSERVATIONS
- The Food segment set a record with a deflation rate of -1.1%. It is a very price competitive market which contributed to the Food segment not making the projected retail $. Although the value of Food sold increased 4.12%.
- After 3 years of declining sales, the sale of Pets essentially leveled out, when a drop had been projected.
- Prices in the Supplies segment deflated in 2017, spurring sales and producing a larger than anticipated increase.
- The inflation rate in the Service segment also slowed significantly. This contributed to them beating their projection and generating a markedly higher real growth rate – 83.8% of the 6.9% retail increase was real.
- The Veterinary Segment also had a record low inflation rate and Pet Parents responded with a $1.1B increase in spending, which was 67% greater than anticipated.
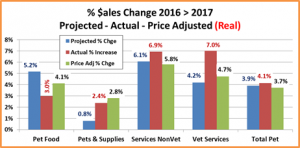
- The Total Pet Market was up 4.13% as every segment but Food beat their projected numbers. The record low inflation rate of 0.4% was a positive factor in increased spending on Supplies and both Service Segments. In Food, absent a new major trend, the deflation retarded retail spending $. The low inflation also produced another record, as 90.2% of the industry’s growth was a “real” increase in products and services.
The Chart below may make it easier to compare the situation in the individual Segments
Now let’s take a look at the performance of the individual segments from 2009 through 2017 starting with Food.

OBSERVATIONS
- The last 3 years have had a huge impact in the overall numbers since 2009:
- 6.5% Annual Growth Rate (Driven up markedly by the 2016 adjustment in Food $)
- Low average inflation – 0.58% (Pushed down to an unhealthy level by two -1+% pricing drops)
- 5.89% CPI adjusted Growth Rate: Over 90% of the growth since 2009 has been “real” – Truly amazing!
- In the 8 years since 2009…
- 4 were deflationary (-0.7%) Average
- 4 were inflationary (1.9%) Average
Since 2013, deflation has been the norm in Pet Food. In a need category, this usually slows retail sales. However, at the same time, we have seen a strong trend to upgrade to ever more expensive premium foods. This has produced the unusual situation of growing retail sales despite extraordinarily strong deflation.
What these “dueling” factors indicate is that the Pet Food Market is the most competitive in history. Manufacturers, Retailers and whole Retail channels are now actively engaged in a furious battle for the consumers’ pet food $. While this price war is initially great for consumers, it could have a negative impact on the supply and distribution channels and ultimately on the consumer… thru reduced choices. In the future, a positive inflation rate for Food that stays at or near 1% should produce the best results…for everyone.
Here’s what 2009 to 2017 looks like on a graph: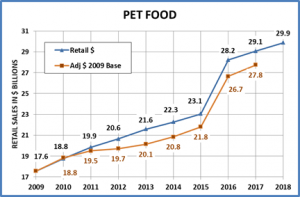
Except for the adjustment in 2016, the annual retail growth rate has generally been slowing. At the same time, the deflation has caused the “real” growth rate to increase since 2012. What will happen in 2018? It’s too early to predict the CPI for 2018. However, through February, the rate of deflation is -1.3%. Last year prices were up 0.17% through February and we still got a record -1.1% annual price drop. This is not a good sign. To counter this continuing deflationary environment we need yet another new, “must have” upgrade in Food to drive consumer spending up.
Let’s turn next to Pets & Supplies.
OBSERVATIONS
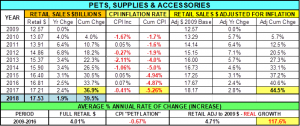
- Deflation
- Prices are 5.3% below 2009 (and about equal to what they were in July 2007)
- Falling at an annual rate of -0.67%
- After a brief respite in 2015 & 2016, prices deflated in 2017 for the 5th time in 8 years.
- Retail Sales – This category has become very price sensitive as increased growth rate seems tied to deflation.
- Over the whole period, the Consumer bought more…and paid less!
- Retail Sales annual growth rate is 4.01%
- Price Adjusted annual growth rate is 4.71% – 18% higher than the retail rate
After the Recession consumers became much more price driven. This had a huge impact on Supplies as most purchases are discretionary and many categories have become commoditized. The first deflationary year was 2010. The Consumer responded very positively with a 6% increase in “real” purchases. This trend continued through 2014 with “real” purchases showing an annual increase of 5.9%. Then prices leveled out in 2015 & 2016 and the increases in both full retail and price adjusted sales fell to the 2.5% range.
In 2017, deflation returned but was not as impactful as in the past. While Supplies sales exceeded expectations, the increase in retail sales was the lowest since 2009 and “real” sales were up less than 3%. Deflation causes strong profit pressure throughout the production and distribution channels. For the good of all we need to get to about a +0.5% rate.
Here is the graph:

In 2018 Pets & Pet Supplies are projected to increase only 1.9% to $17.53B. This reflects an expected $100M decrease in Live Animal Purchases and a 2.7% increase in Supplies. We have noted that the Supplies segment has become very price sensitive. Through February 2018 prices are down -0.5% from a year ago. If this continues or even grows, it could spur increased spending. However, innovation is the only real cure for this condition. The Pet Food segment has shown that consumers will pay more for a truly better product. We need this in Supplies.
Now on to the Service Segments – First, Non-Vet Services.
OBSERVATIONS
- Growth
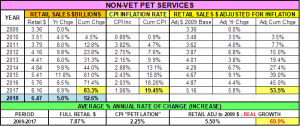
- Annual Retail Growth rate 7.9% – The highest in the industry
- Annual Inflation rate – still a little high at 2.25% but has been slowing and dropped markedly in 2017.
- Years of inflation may have caught up to this segment as the spending increases in 2016 & 2017 were about half of the increase in 2015.
- 69.9% “real” growth since 2009. In 2017, this reached 84%. 75+% is a realistic target.
There are no big negatives regarding this segment. However, it is largely driven by discretionary spending so the consumers’ household income is a bigger factor in spending in this segment than any other. Years of relatively strong inflation and increasing competition from a growing number of outlets offering pet services have finally had an impact, as the inflation rate fell to 1.1% in 2017 – a near record low. The segment has shown strong, consistent growth since the recession, even reaching double digits in 2015. While the 2017 increase was only 6.9%, 84% of the growth was real – a record high. The impact of Services on the industry is limited as it is by far the smallest segment, only accounting for 8.9% of total Pet Industry Sales…but that’s up 20% from its 7.4% share back in 2009.
Here’s how the sales look on a graph:
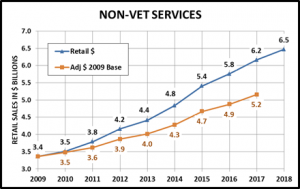
2018 sales are projected to increase 5% to $6.47B. This is 35% below the growth rate since 2009 and even 25% below the growth rate since 2015, so this estimate may be a little low. The keys to a bigger increase are continued growth in the number of outlets offering Services and maintaining a relatively low inflation rate. Through February 2018 prices are 1.1% above the same period in 2017. If this rate can be maintained throughout the year, it is likely that Services Sales will increase more than the 5% projection.
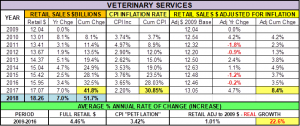
Now, let’s take a closer look at the Veterinary Service Segment, which accounts for 24.8% of Pet Industry Sales.
OBSERVATIONS
- Retail Growth
- Sales are Up 41.8% since 2009
- Annual growth rate 4.46%
- Inflation is the problem
- Annual average CPI increase is 3.42% since 2009, but 2017 saw a record low CPI increase of 2.2%
- Adjusted Growth rate since 2009 is only 1.01%. However, this has doubled since 2016 as 2017 was up 4.7%
- Price increases account for 77.4% of the sales increase from 2009 to 2017.
- “Real Sales”
- Consumers actually bought less in vet services in 4 of the last 8 years. They just paid more.
- Sales were basically stagnant from 2009 to 2016 – average annual growth rate 0.49%
- Then inflation fell to a record low in 2017 and sales took off – Up $1.12B (7%) and 68.6% were real!
Regular veterinary visits are generally viewed as a “need” not a “want”. However, the high inflation rate over the years finally reached a point where Pet Parents, especially those with income pressure, started delaying or foregoing regular procedures entirely. They looked for substitutes in OTC medicines, supplements and treatments whenever possible. They also turned to “no appointment” clinic days offered by some non-pet retailers to get vaccinations and other procedures at radically discounted prices. Then the Veterinary Services inflation rate turned sharply downward in the 2nd quarter of 2016. It stayed at a record low rate through 2017 and Pet Parents responded. They increased the frequency of visits and sales in the Veterinary segment rose $1.1B, the biggest increase of any segment.
Here’s what it looks like:
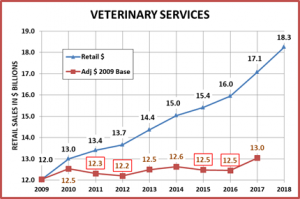
Veterinary Sales are projected to increase 7% in 2018 to $18.3B. This is basically a replication of 2017. From what we have seen over the past 8 years, this is possible but only if the segment maintains an inflation rate of 2.5% or less. Through February of 2018 prices are 2.6% higher than 2017. This seems concerning, but the first quarter invariably has the highest inflation rate in this segment. In fact, this is EXACTLY the same rate as YTD in 2017, the year with the record low rate. Ultimately, we will just have to monitor the CPI and see what happens.
Now we’ll wrap it up with Total Pet.

OBSERVATIONS
- Retail Sales in 2017 were ↑52.7% since 2009; Annual growth rate is 5.43%
- Inflation: Only 11.0% since 2009; 1.31% annual CPI increase. (2017 saw a record low rate: 0.4%)
- “Real” Sales are 74.8% of the Total increase; Annual growth rate of 4.06% (In 2017, 90.2% of increase was real)
The consistently strong Total Pet Retail numbers are a big reason why so many people are attracted to the industry. The retail numbers have been good across all segments. However, to get the “real” story you need to look a little deeper into “petflation” and the actual amount of goods and services being sold. In recent years we have been struggling with deflation in Food and Supplies and inflation in the Veterinary Segment. In 2017 the Total Pet inflation rate fell to 0.4%
- After a 2 year pause, deflation returned to the Supplies Segment for the 5th time in 8 years. Commoditization and a lack of innovation have created extreme competitive pressure which deflates prices. Even a small increase in CPI slows sales, usually through reduced purchase frequency. Innovation is desperately needed!
- After a 1 year pause, Pet Food prices fell a record -1.1%. However, unlike Supplies, the Pet Food segment has been countering the incredibly competitive market with periodic premium upgrade trends. Another is needed.
- After years of strong inflation and “flat” real sales the Veterinary segment finally got the word. A record low 2.2% inflation rate in 2017 resulted in a $1.1B increase and 69% was real. Keep it up!
- The Services segment has been growing in sales and number outlets. In 2017, this competitive pressure was finally visible as the inflation rate fell to 1.1%. Consumers responded as sales grew 6.9% and 84% were real.
Here’s the graph of Total Pet Sales since 2009:
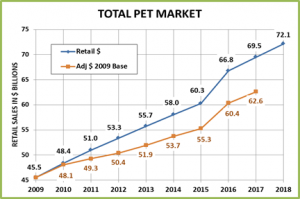
In 2018 Total Pet Sales are projected to increase 3.8% to $72.14B. This would be the smallest percentage increase since 2009. The key factors in meeting or beating this forecast are both of the Service segments continuing lower inflation rates, Supplies staying at or slightly below zero in CPI and whether a new Food Trend starts. Quite frankly, Food is probably the key. If a new Food trend takes off, this could radically increase overall sales. We’ll have to wait and watch.
Remember: In analyzing your own data, always look beneath the surface numbers!