Pet Market Growth – How much is “real”? – Part 1- CPI “Petflation”
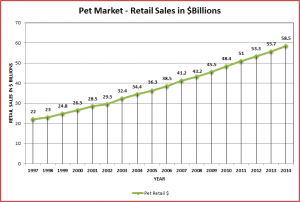
The Pet Industry has shown outstanding and continuous retail growth in the last 17 years. From 1997 to 2014 (projected) it has grown 165.9%. This is an average annual growth rate of 5.92%.
Here’s what it looks like:
Why pick 1997 as a “starting” year? Why not 1996 or 1994? As it turns out 1997 was a very significant year for the industry. In 1997 the United States Bureau of Labor and Statistics (USBLS) recognized the growing significance of the market by dividing the Pet market into distinct segments and establishing 1997 as the base year for future measurements.
The USBLS produces a variety of important economic statistics but perhaps the most famous and arguably most impactful is the CPI – Consumer Price Index – the inflation rate. Changes in the CPI directly affect the income of over 80 million Americans. It is also used by the President, Congress and the Federal Reserve Board in formulating fiscal and monetary policies.
We all know that price increases in Pet Products are a part of the business. When the costs of energy, labor and raw materials rise, price increases become a business necessity. However, since price increases can directly affect consumer purchasing decisions, they can’t be taken lightly.
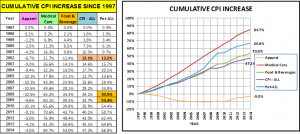
Let’s take a look at “Petflation” since 1997 and see how it compares to the overall CPI and to some other industries:
The first thing that you notice is the strong and unchecked increase in prices for human medical services. Regardless of overall economic conditions, medical prices have consistently gone up. This has to be a factor in our current health care situation.
By the way, prices don’t always go up. Prices in the Apparel market are actually 3% less than they were 17 years ago. A big factor is probably the “offshore” movement of manufacturing in this segment.
But back to Pet. The CPI increase in overall Pet Products and Services is 66.8%. It is not as great as Medical but it is 26% higher than Food & Beverage (53.0%) and 41% higher than the overall CPI (47.2%).
Was it always this way? The answer is no. The first year that Petflation exceeded the national CPI was 2002. It also began to accelerate in 2006 with major increases in 2008 and 2009 – in the midst of the national economic recession.
In 2010 this abrupt upward spiral stopped. In the years since, Petflation has “mirrored” the overall CPI and the Food & Beverage Market.
What does all this mean? How has it affected the consumer? We will get to that “bottom line” but first we’ll look at what is “driving” the Pet price increases. Remember the USBLS divided the market into segments.
In our next post we’ll look at the CPI since 1997 for each of the segments in the Pet Market. Have prices gone up equally across the board or….
[box] Note on Data in this and related Posts: The Pet Retail Sales data is taken from numbers published by the APPA which they obtained from various sources. The APPA published sales of $21B for 1996 and $23B for 1998. The $22B sales for 1997 were estimated by assuming an equal growth rate of 4.65% for 1996>97 and 1997>98. The CPI data is the annual rate from reports downloaded from the USBLS website. For 2014 estimates, the change in CPI was assumed to be the same as for 2013.[/box]


