2016 U.S. Retail Channel Update – Internet/Mail Order Makes a Move!
Earlier this year we updated our ongoing study of the consumer “migration” between retail channels. When we eliminate Restaurants, Auto and Gas Stations, 3 “relevant” channels stood above the “pack”. In homage to the Olympics, for their 2015 performance we “awarded” the following medals:
- Gold: Supermarkets – $588B
- Silver: SuperCenters/Clubs – $440B
- Bronze: Internet/Mailorder – $433B
Unlike the Olympics, this race is run every day and effectively has no finish line. In this report we will update the standings since the end of 2015. But first, we will put these “key” channels into perspective in terms of their historical sales growth and key waypoints. As we have said on numerous occasions, the retail marketplace is constantly evolving to better fulfill the wants and needs of the consumer. These three retail channels are currently at the top but it hasn’t always been that way. Plus, who knows what changes the future will bring?
The following chart tracks $ales for these channels from 1992 to 2015. The Data in this report comes from the U.S. Census Bureau – Specifically: Their Retail Trade Reports and The Economic Census.
Observations
The 90’s – The foundation is laid for retail change.
- Supermarkets show steady, if unspectacular growth over the period. This has been the general “rule” for this channel. The biggest share of their revenue comes from food, which is “need” driven.
- SuperCtrs/Clubs – The major Club store chains – Costco, Sam’s & BJ’s were established in 1983-84. By 1994, the big three discount chains – Walmart, Target and Kmart – were fully committed to the SuperCenter format. By the last years of the century, 97-99, the consumer had begun to “buy into” both of these concepts and there were enough outlets to make a difference.
- Internet/Mailorder – Remember that this group also includes sales through TV – from individual commercials to dedicated “sales only” channels. In the beginning there was no internet. However, by 1995, secure encryption had been developed for online transactions and Amazon was founded. The stage was being set but growth would require increased consumer technological coverage.
2000-2004 – An economic “slow down”
- Spending slowed during this period. It began when the dotcom bubble burst in 2000 along with a slowed GDP in the second half of the year. While Consumer Spending didn’t decline, the increases were significantly smaller in 2001 and 2002. The recovery was then spread over 2003-2004.
- Internet/Mailorder – The dotcom bust had an immediate impact in 2001 with flat sales. Full recovery happened in 2003, which incidentally is the first year that Amazon posted a profit.
- Supermarkets – With “need” driven spending, consumers in this channel are both slower to react to a downturn and to recover. They had flat sales in 2002 and didn’t recover their momentum until 2004.
- SuperCenters/Clubs – They didn’t miss a beat. With a growing store count, consumers turned their attention and their $pending to these “value” store formats.
2004 – 2008 – Good times until….
- A period of strong growth until “the fall” in late 2008.
- Supermarkets, SuperCenters and Clubs all registered strong growth through 2008.
- Internet/Mailorder – From 2004 to 2007, the growth of the internet makes a major impact on this segment. Sales slowed markedly in 2008, a year earlier than other channels. With a high percentage of discretionary purchases, it appears that a slowdown in this channel may possibly provide “early warning” of impending drops in overall retail spending.
2009 – 2010...the recession and rebound.
- U.S. Retail Spending fell 8.2% from 2008 to 2009, affecting most channels.
- Supermarket Sales were flat in 2009 but SuperCenters/Clubs and Internet/Mailorder still posted small increases.
- Once again, it took the Supermarkets an extra year to fully recover (2011). However, the recession firmly established “price” as the primary factor in buying decisions. As a result the sales in SuperCenters/Clubs and Internet/Mailorder responded immediately and strongly.
2011 – 2015 – the Recovery and aftermath.
- Since 2010 Supermarkets have reverted to their previous pattern of slow growth – 3.3% per year. However, they are losing market share as this rate is lower than the growth rate of the overall market.
- SuperCenters/Clubs rate of growth since 2009 is 3.6% which is lower than their pre-recession rate and they too have begun to lose overall market share.
- Internet/Mailorder Sales have literally taken off since the recession – a 10.6% average annual growth.
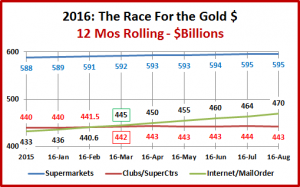
Here’s what has happened since the end of 2015!
- The Internet/Mailorder Channel passed the SuperCenters/Clubs in sales in March of 2016 (about the time of the GPE) and has continued to widen their lead. With the current Holiday forecast, expect the gap to grow even larger.
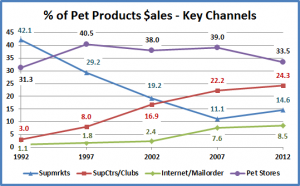
Supermarkets, Internet/Mailorder and SuperCenter/Clubs are the 3 largest “Pet relevant” channels in the U.S. Retail Marketplace. Just how important are they to the Pet Industry? The following chart shows their share of total retail Pet Products (Food & Supplies) sales from the last 5 Economic Census Reports. I took the liberty of including Pet Stores in this elite Pet Products Sales group.
Observations
- In 1992 Supermarkets sold the most pet products. Consumers bought Pet where they did their grocery shopping. After falling precipitously for 15 years, Supermarkets rebounded after the recession. However, in 2012 they have basically 1/3 of the Pet Products market share that they enjoyed in 1992.
- The rapid growth of Pet Chains in the early 90’s helped push Pet Stores to a peak 40% market share in 1997. They maintained this level until the Recession, when consumers started shopping for lower prices.
- The SuperCenters & Clubs share of Pet Products went up sharply as these outlets grew both in number and popularity. Although their Pet Product growth has slowed somewhat in recent years, they are still a strong number 2 behind Pet Stores.
- The first measurable Internet Pet Products sales showed up in 2002 – $70M. By 2012 that had grown to over $1B and the combined Internet/Mailorder channel accounted for 8.5% of all Pet Products sales.
- These 4 Channels account for 80.9% of all Pet Products sales. 66.5% of all Pet Products sales come from outside the Pet Store Channel. These 3 Mass Market channels account for 47.4% of all Pet Products $.
- In 2012 Supermarkets and SuperCenters/Clubs accounted for 38.9% of all Pet Products Sales. In 20 years the market has come “full circle”. In 2012, just like in 1992, Consumers bought the most pet products where they did their regular grocery shopping.
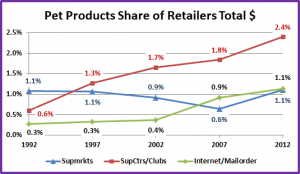
So these Retail Channels are obviously very important to the Pet Industry. What about the reverse? How important are Pet Products Sales to Supermarkets, SuperCenters/Clubs and Internet/Mailorder Retailers? In the next chart, we’ll look at the share of Pet Products Sales of the Total Revenue for each channel.
The percentages may seem low, but they represent Billions of dollars. Let’s put them into perspective. In 2015 Consumer spending on all four Pet Industry segments was about 0.94% of an average household’s total expenditures. Pet Products (Food & Supplies) spending accounted for 0.62%. In 2012 (the latest year on the chart) the numbers were 1.01% for Total Pet spending and 0.64% for Pet Products.
With these lower percentages in mind, now take a look!
Observations
- Supermarkets – From 1992 to 2002 Pet products held at about 1% of total revenue, but their market share of Pet was radically falling as Pet Products’ distribution exploded across retail. They reached a low point in 2007 but have engineered a strong comeback through the recession and recovery.
- Internet/Mailorder – Pet Products were relatively insignificant through 2002. Then the Internet started to take off in 2003 and the importance of Pet Products to the channel began to grow. It’s also important to note that unlike the other 2 channels, the bulk of the purchases were coming from the Supplies Segment, not food. When they turn their efforts to food…
- SuperCenters/Clubs – When this Channel began to grow in the 90’s, Pet Products were an integral part of their plan and grew as their revenue increased. Since the recession, Pet Products have reached an incredible 2.4% of this huge channel’s total revenue. If overall sales flatten out in these stores, it could affect the overall revenue of the Pet Industry…unless the Internet picks up the slack.
We have reviewed the history and growth of the 3 largest Relevant Retail Channels, including a month by month look at 2016 YTD. We documented Internet/Mailorder passing the SuperCenters/Clubs to firmly take over the “silver” spot in the retail marathon. We validated the importance of these channels and Supermarkets to the Pet Industry. We have also confirmed that Pet Products are important in these retailers’ current and future Plans.
What’s next?
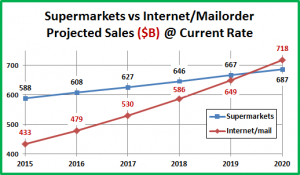
Let’s take a stab at predicting the future. In a final chart, we apply the annual growth rate of Supermarkets and Internet/Mailorder since the recession to project the outcome of the race for the “Gold” that has developed.
Too conservative? Mid 2020 for Internet/Mailorder to “grab the Gold” doesn’t take into consideration that for the first time, the Internet is specifically targeting Grocery products’ revenue.
Too optimistic? Possible restrictive changes in trade agreements could drive up prices and reduce spending on many GM products (like Pet Supplies). This would slow sales in many retail channels, even the internet.
We’ll have to wait and see…




Where do Petco and PetSmart fit into this analysis considering they have over 50 percent of the industry revenue according to IBIS World?