2015 U.S. TOTAL PET SPENDING $67.75B…UP $3.43B
In 2015 Total Pet Spending in the U.S. reached $67.75B, a $3.43B (5.3%) increase over 2014. It was another good year as the percentage increase exceeded that of the Total “Relevant” Retail Market (+3.5%) and even the Top 100 U.S. retailers (+4.9%). However, the story was a bit more complex. The Total increase came from…
- A spectacular $5.4B (22.5%) increase in Food $
- A concerning -$2.1B (-12.5%) drop in Supplies $
- A business as usual $0.6B (11.1%) gain in Services $
- A less than expected -$0.5B (-3.9%) drop in Veterinary $
Let’s see how these numbers blend together starting at the household level. In any given week, 25.9 Million U.S. Households (1/5) spend money on their Pets – food, supplies, services, veterinary or any combination.
In 2015, the average U.S. Household (pet & non-pet) spent a total of $528.17 on their Pets. This was a 4.1% increase over the $507.14 spent in 2014. However, this doesn’t “add up” to a 5.3% increase in Total Pet Spending. With additional data provided from the US BLS, here is what happened.
- 1.2% more H/Hs
- Spent 1.6% more $
- 2.5% more often
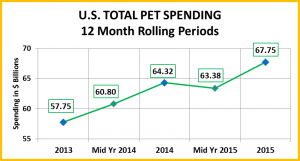
By the way, if 65% of U.S. H/H’s are pet parents, then their annual Total Pet Spending is $812.57. Let’s look at the recent history of Total Pet Spending. The rolling chart below provides a good overview. (Note: All numbers in this report come from or are calculated by using data from the US BLS Consumer Expenditure Surveys)
- For an exact comparison you must compare like time frames. For example at midyear 2015 Total Pet was up $2.58B from the same period a year ago. Food was up sharply but the total increase was pulled down by drops in Veterinary & Supplies spending in the first half of 2015.
- In the second half of 2015, Supplies spending continued to fall, while Food Spending grew even faster and Veterinary staged a $2B comeback. The result was a $3.43B (5.3%) increase in 2015 Total Pet $ over 2014
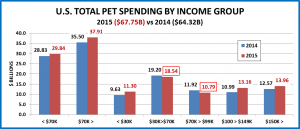
Now we’ll look at some Demographics. First, Total Pet Spending by Income Group
As we drill further down into the demographics of 2015 Total Pet Spending, you will see that it can become complex and also generate some surprises, with the increases and drops sometimes coming from unexpected sources.
- < $70K – (64.4% of U.S. Households); H/H Pet Spending: $359.90, +4.0%; Total $: $29.8B, ↑$1.01B (+3.5%) from…
- Food ↑$2.21B
- Supplies ↓$1.08B
- Services ↓$0.04B
- Vet ↓$0.08B
This low to middle income group represents 2/3 of U.S. H/Hs. A significant proportion of this price sensitive group chose to upgrade their Pet Food. There was a minimal impact on Veterinary and Services spending but the increase in money allocated to Food undoubtedly contributed to the $1B decrease in Supplies spending.
- >$70K – (35.6% of U.S. Households); H/H Pet Spending: $835.18, +2.1%; Total $: $37.9B, ↑$2.42B (+6.8%) from…
- Food ↑$3.22B
- Supplies ↓$1.02B
- Services ↑$0.62B
- Vet ↓$0.39B
This group represents about 1/3 of U.S. H/Hs. Their lowest income is above the U.S. average and $15K above the Median so they have money to spend on their pets. In fact, they are responsible for 56% of the industry’s revenue. They also upgraded their Food Purchases plus spent more on Services. However, there must be some significant price sensitivity in some subgroups as both Supplies & Veterinary Spending fell sharply.
- < $30K – (32% of U.S. Households); H/H Pet Spending: $275.31, +15.8%; Total $: $11.3B, ↑$1.67B (+17.3%) from…
- Food ↑$0.49B
- Supplies ↓$0.37B
- Services ↑$0.12B
- Vet ↑$1.42B
Two significant subsets in this group are H/Hs just getting started along with retirees. There is obviously a commitment to their companion animals by this lowest income group. The lift in food is very significant – new pet parents along with upgrades. However, the increase in Veterinary spending is amazing. Without this group, Vet Spending would be down almost $2B.
- $30>$70K – (32.4% of U.S. Households); H/H Pet Spending: $442.85, -1.1%; Total $: $18.5B, ↓$0.66B (-3.5%) from…
- Food ↑$1.71B
- Supplies ↓$0.71B
- Services ↓$0.16B
- Vet ↓$1.51B
This low to middle income group is by necessity price sensitive. Many of them committed to upgrading their Pet Food. However, the other segments “paid the price”, especially Veterinary and Supplies.
- $70>$99K – (14.1% of U.S. Households); H/H Pet Spending: $599.19, -8.7%; Total $: $10.8B, ↓$1.13B (-9.4%) from…
- Food ↓$0.06B
- Supplies ↓$0.62B
- Services ↓$0.15B
- Vet ↓$0.29B
This upper middle income group demonstrates that price has become a priority in purchase decisions across the U.S. No upgrade in Food. They just spent less in every industry segment.
- $100K>$149K– (12.2% of U.S. Households); H/H Pet Spend: $860.31, +13.9%; Total $: $13.2B, ↑$2.17B (+19.8%) from..
- Food ↑$1.84
- Supplies ↓$0.01B
- Services ↑$0.18B
- Vet ↑$0.17B
This group was the Star of the income groups. They upgraded their Pet Food but still had enough money available to spend more on Veterinary & Services. Only a small drop in Supplies prevented a sweep!
- $150K> – (9.3% of U.S. Households); H/H Pet Spending: $1157.04, -1.4%; Total $14.0B, ↑$1.40B (+11.1%) from…
- Food ↑$1.45B
- Supplies ↓$0.38B
- Services ↑$0.59B
- Vet ↓$0.27B
These wealthiest Americans opted for upgrading their Food and more convenience in Services. However, the drop in Veterinary showed that they are not immune to inflation and the decrease in Supplies is a good indicator that there are definite problems in this industry segment.
Income Recap – 2015 showed that money matters but that a commitment to your companion animals is also a major factor. The Income Group “Team” that produced the $3.4B increase in Total Pet Spending was made up of the opposite ends of the spectrum – those making $100K+, along with those making less than $30K.
The opposite side was “manned” by those making $30K to $99K. This middle income group represents 46.5% of U.S. H/H’s and they are definitely price driven. Although the $30>$70K group “bought into” to upgrading their Pet Food, the Veterinary & Supply segments had to “pay for it”. The $70>$99K group has the money, but spending still dropped in all segments, including Food. A major overall concern revealed by this analysis is the fact that Supplies’ Spending decreased in every income group.
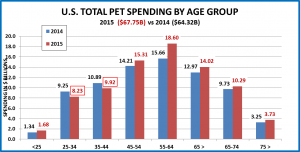
Next let’s look at the Total Pet Spending by Age Group
- Under 25 – (5.9% of U.S. Households); H/H Pet Spending: $208.62, +32.4%; Total $: $1.7B, ↑$0.34B (+25.8%) from…
- Food ↑$0.41B
- Supplies ↓$0.02B
- Services ↓$0.003B
- Vet ↓$0.04B
These young Millennials bought into the Food upgrade but paid for it – in part with small drops in other areas.
- 25-34 – (16.4% of U.S. Households); H/H Pet Spending: $383.65, -13.0%; Total $: $8.2B, ↓$1.02B (-11.1%) from…
- Food ↓$1.23B
- Supplies ↓$0.18B
- Services ↑$0.15B
- Vet ↑$0.24B
These oldest Millennials had a huge drop in Food. This follows a huge increase in the second half of 2014. It’s possible that they opted to upgrade their Pet Food early in the cycle, but decided that the price was too high. Their increases in Veterinary and Services spending show their commitment to their Pets and to convenience.
- 35-44 – (16.8% of U.S. Households); H/H Pet Spending: $467.33, -7.4%; Total $: $9.9B, ↓$0.97B (-8.9%) from…
- Food ↓$0.45B
- Supplies ↓$0.59B
- Services ↑$0.34B
- Vet ↓$0.27B
This group has the largest families and is in the middle of building their careers. This makes them both price and time sensitive. Price and Convenience are their “Watchwords”. The result of this is that their spending declined in all segments but Services.
- 45-54 – (18.9% of U.S. Households); H/H Pet Spending: $645.43, +7.6%; Total $: $15.3B, ↑$1.09B (+7.7%) from…
- Food ↑$0.82B
- Supplies ↓$0.64B
- Services ↑$0.26B
- Vet ↑$0.66
This age group has the highest income and the second largest Total Pet increase – +$1.1B. However, even they did not spend more across the board. In fact, they had the biggest drop in Supplies spending which is seriously concerning for this segment.
- 55-64 – (18.8% of U.S. Households); H/H Pet Spending: $762.98, +14.1%; Total $: $18.6B, ↑$2.94B (+18.8%) from…
- Food ↑$5.02B
- Supplies ↓$0.20B
- Services ↓$0.08B
- Vet ↓$1.80B
These Baby Boomers committed to upgrading their Pet Food. Their Spending drove the big increase in the Food segment as well as much of the overall Industry increase, but the other segments were impacted. In fact, their cut back in Veterinary spending was the single biggest factor in the spending decline in this segment.
- 65-74 – (13.5% of U.S. Households); H/H Pet Spending: $612.54, +2.7%; Total $: $10.3B, ↑$0.56B (+5.8%) from…
- Food ↑$1.13B
- Supplies ↓$0.35B
- Services ↓$0.07B
- Vet ↓$0.15B
Many in this group are retired and about half are Baby Boomers. They also upgraded their Pet Food and spending declined in other segments. However, the drop in Veterinary was not as great as the 55-64 group.
- 75> – (9.8% of U.S. Households); H/H Pet Spending: $297.57, +12.6%; Total $: $3.7B, ↑$0.48B (+14.8%) from…
- Food ↓$0.27B
- Supplies ↓$0.11B
- Services ↓$0.02B
- Vet ↑$0.88B
It definitely becomes both physically and monetarily more difficult to care for a companion animal once you reach an advanced age. The huge increase in Veterinary spending shows that their commitment is still strong.
Age Group Recap: Once again, the team that produced the $3.4B spending increase is made up of the opposite ends of this Demographic -the over 45 age group and the under 25 households. However, the “Starting Lineup” was clearly the over 45 crowd while the under 25 was on “Special teams”. The all-purpose “Running Back” wore #45-54, but the quarterback was #55-64, chosen because of his ability to make the “big play”.
On the downside, the other team is truly “family America” – the age group from 25 to 44. They are the 2nd and 4th highest income groups but they also have the largest families. Extra spending money and time are often in short supply. They search for bargains and anything that makes life’s tasks a little more convenient. Finally, just like the situation with the income groups, Supplies Spending fell in every age segment.
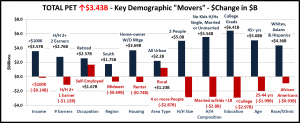
Take a look at some Key Demographic “Movers”. It should give you a better picture of the situation.
Summary
In building my research database, I gathered Pet Spending information for 12 demographic categories with over 80 specific segments. Nothing, including the Pet Industry, is simple anymore. Total Pet Spending was up $3.4B (+5.3%), a strong increase but not one of the 80+ individual demographic segments had an across the board increase in all Industry segments. However, there were 2 segments that had across the board spending decreases: H/H’s with an Income from $70K>$99K were down $1.1B and Married Couples whose oldest child was from 6 to 17 years old spent over $2.1B less on their Pets. These are usually big winners in Pet Spending.
On the upside, it appears that “opposites attract”: 2 earner H/H’s and Retired people; Income Over $100K and Income Under $30K; Over 45 years old & under 25. Other “positive” groups were just “stand alone” unusual: 1 or 2 person H/Hs; No kids H/Hs – whether single, married or unmarried; Homeowners without a Mortgage.
On the downside, there were “losers” in 2015, who usually are winners: Self-employed; 4+ people; Married couples with kids under 18; the 25 to 44 yr age group. Also, the difference between the spending by College Grads and those without a degree was very extreme.
2015 was a “mixed bag”. 80 of the 82 demographic segments had a mixture of up and down spending on the various industry segments. There is no doubt that the big increase in Food spending was primarily responsible for the overall increase in Total Spending. However, it also left less “available” resources for spending in the other segments. This big lift in Food was largely driven by the Baby Boomers, especially the 55 to 64 age group. Their spending in all other segments declined and their big drop in Vet spending turned the whole segment negative.
Regardless of income level, there is definitely increased consumer pricing sensitivity across the entire U.S. retail market. However, product quality and a commitment to the well-being of our companion animals still rank high in the decision making process as was evidenced by the upgrading of Food by the under $30K group and the big increase in Veterinary spending by those over 75. In 2016, we’ll see if the increase in food spending holds on or even expands to more demographics and…if the Supplies segment can make a comeback.


