GLOBAL PET EXPO 2025…PETS. – Where perspectives spark innovation!

Global Pet Expo, the Pet Industry’s premiere event, continues at its “new normal”. The exhibitor count is currently 1077. It could reach 1139 by showtime. This is more than 1129 in 24 but lower than the 1173 peak in 2019. However, it is still more than enough.

Live events are critical in the Pet Industry because of our attitude towards Pets and Pet Products. Pets are an integral part of our families, and we now increasingly personify them. Pet shows are primarily focused on Pet Products. Studies have shown that over 60% of consumers prefer to make initial buying decisions on Pet Products in person. This makes Pet Products 2nd  only to fresh groceries in this behavior. This preference applies to all Pet Products buyers, not just consumers. The retailers and distributors attending GPE and SuperZoo want to see and touch a new product before they buy. Live shows are not just important, they are critical to the continued growth and strength of the Pet Industry.

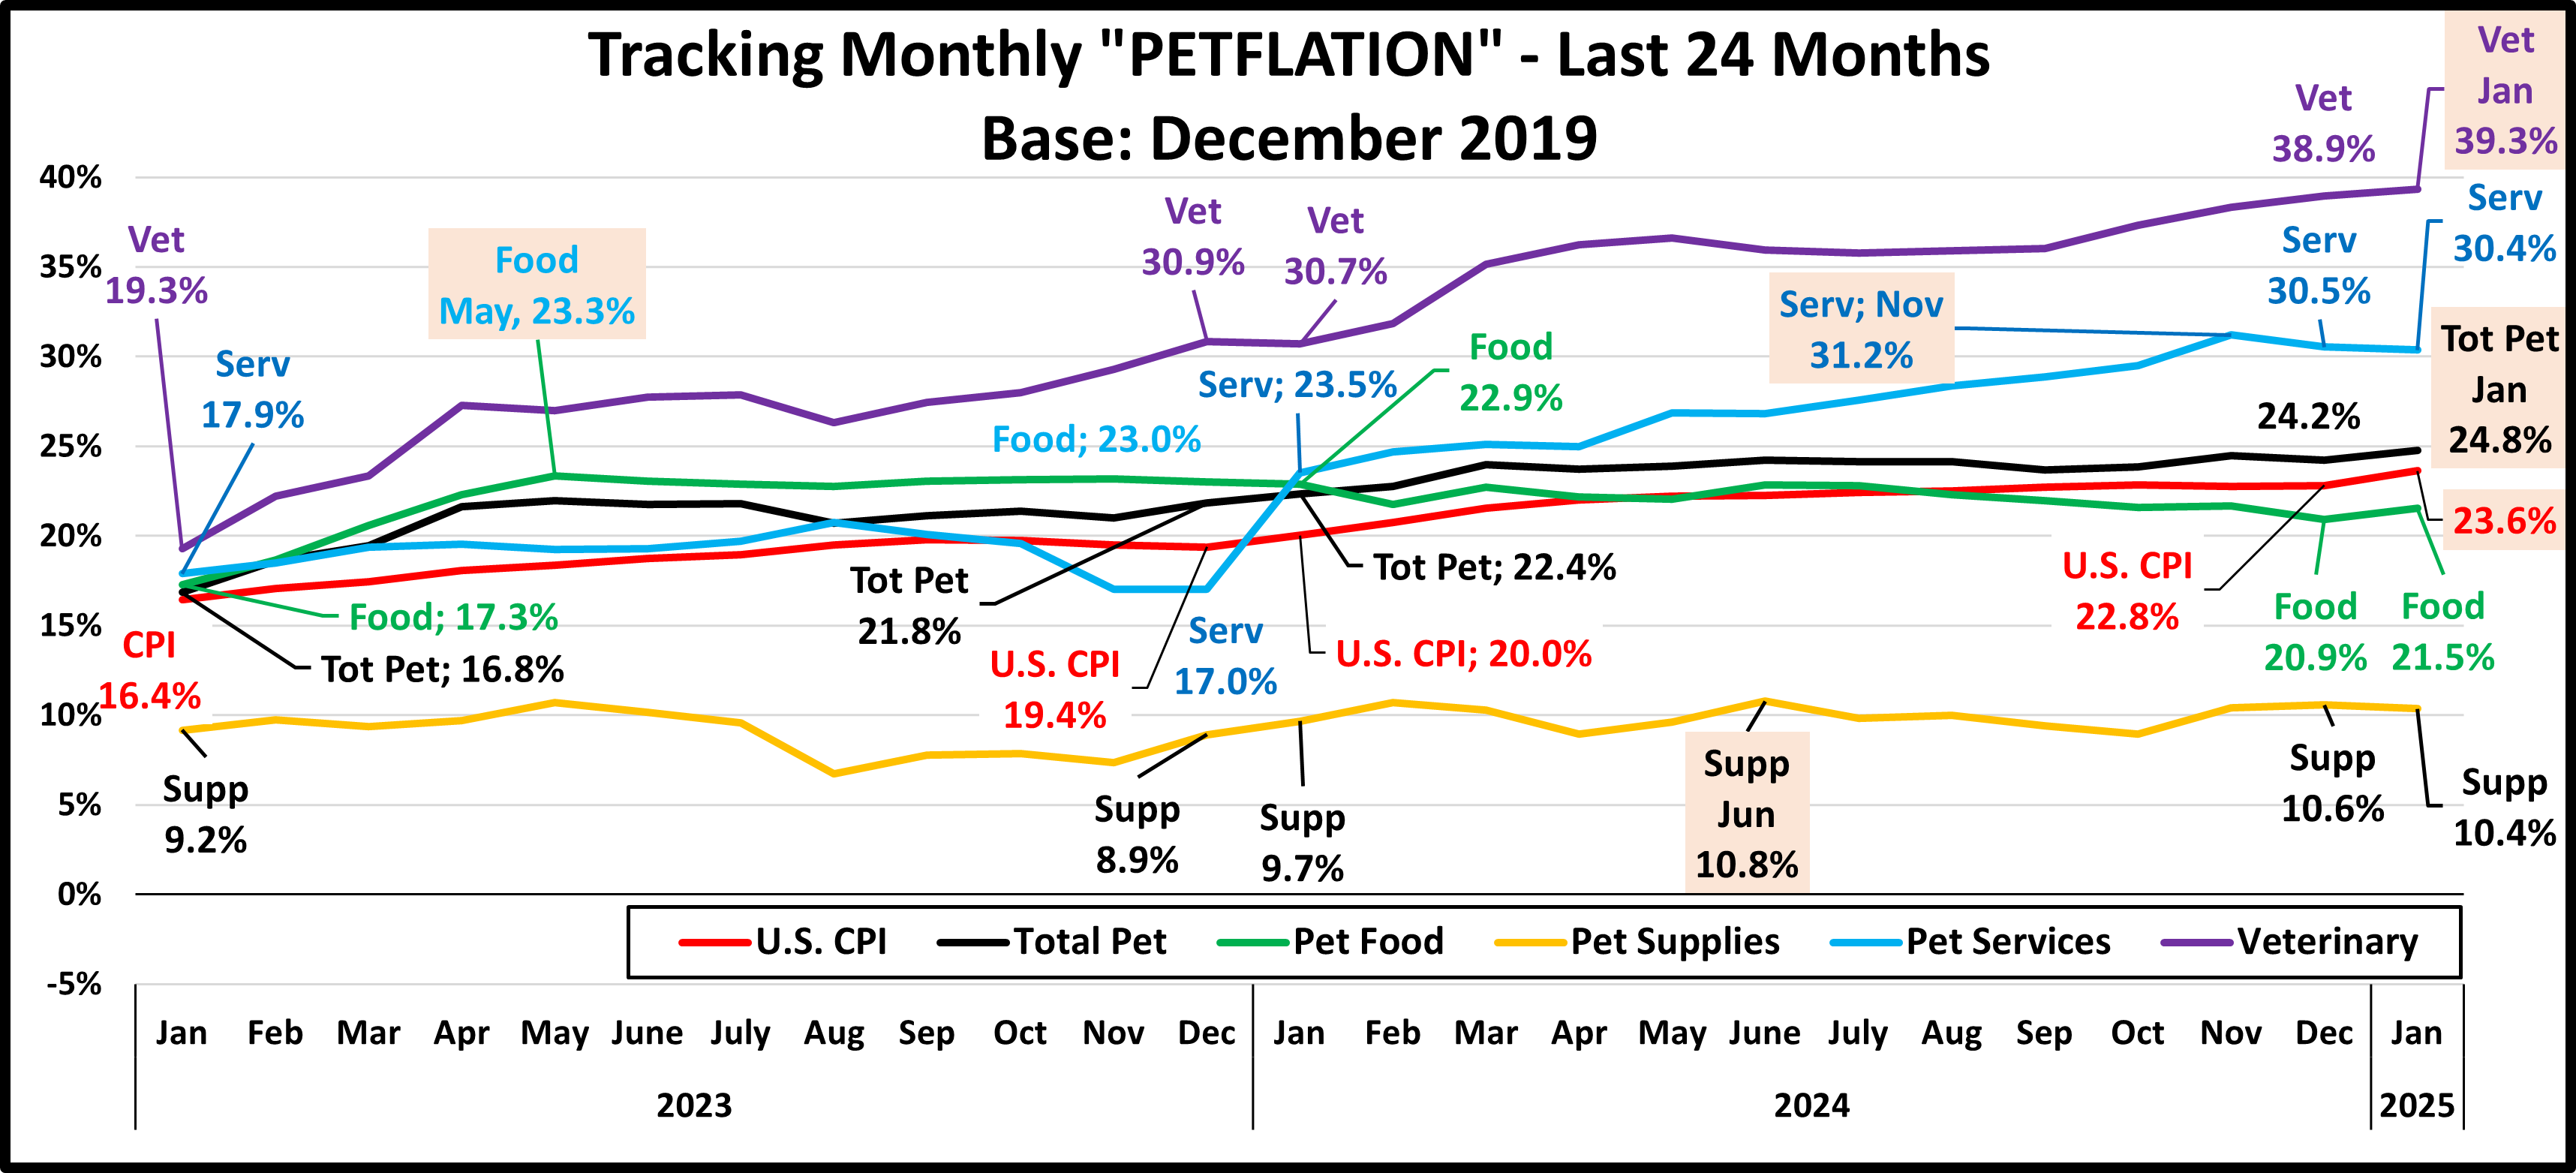
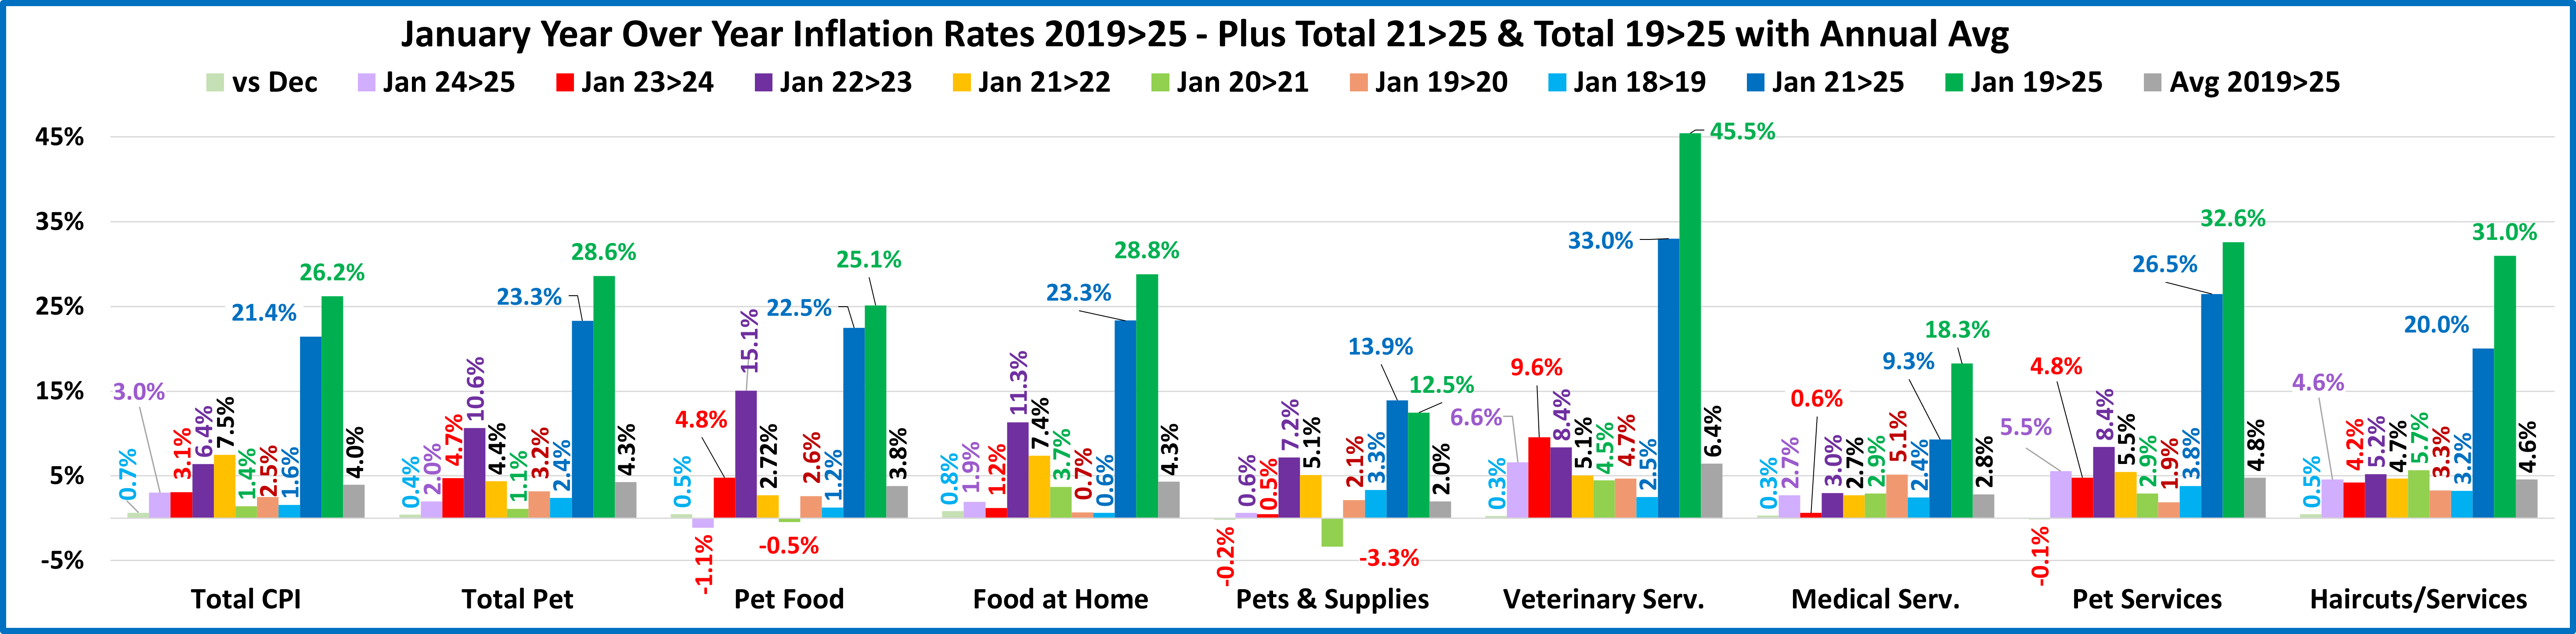
Inflation has slowed but it is cumulative. You will again see evidence of its impact in the makeup of exhibitors at GPE 2025. Consumers are looking for Value (Quality + Price). One way to get it is through Private Label products. GPE 25  has  over 120 companies actively soliciting OEM customers. Foreign companies are especially capable of OEM, so their booth share from 40 countries is now 37%. (up from 36% in 24) Back in 2019, it was 25%. These trends have also affected individual product categories. Now, let’s take a brief look at what awaits attendees of GPE 2025.

If all 62 open booths are filled, the exhibitor count will be -2.7% lower than the 2019 peak but the booth square footage will be +0.8% more. Regardless of the final number, there will be more than enough exhibitors to satisfy the needs and wants of every buyer. Here are some relevant facts.

  • 1077 Booths – assigned as of 2/17 but, with commitments the final count could reach 1139
  • 357,000 sq ft of exhibit booth space (Not counting the 45,000 sq ft new product area)
  • 10 x 20 is the most popular size – 361 (33.5% of committed exhibitors), but 10 x 10 is a close 2nd with 355.
  • Booths are bigger – the average size is 318 sq ft, +5% from 2024. Exhibitors want more space.
  • Size matters – Booths 300 to 800 sq ft (26%) occupy 41% of the space. Those with 1000+ sq ft (5%) cover 28%.

Will you see any new exhibitors or is it the usual group? There have been 10 live pet trade shows from 2019>24 – 5 GPEs and 5 SZs. There are currently 1077 exhibitors at GPE 25 but It took 3870 companies to fill all 11 shows. Of the GPE 25 exhibitors:

  • 139 (13%) – Did all 10 other shows
  • 678 (63%) – Did GPE 2024
  • 321 (30%) – Are new to GPE (at least from 2019>24)
  • 257 (24%) – Did NO other shows from 2019>2024

The percentage of exhibitors new to GPE this year is slightly above “normal”. There is definitely plenty of “New” to see.

Special “Floor Sections” at GPE account for 54% of Booths, up from 37.2% in 2019. This was due to the addition of the Supplier Pavilion in 2024 and the China Pavilion in 2025. The primary comparison of GPE 25 to previous years in this and other areas will be by share of booths. 

Note: In all charts, the Booth count comparison is as of 2/17/25 vs 2/16/24. In the share portion, the 2019>2024 data is the final number while the 2025 data reflects the status as of 2/17/25. 

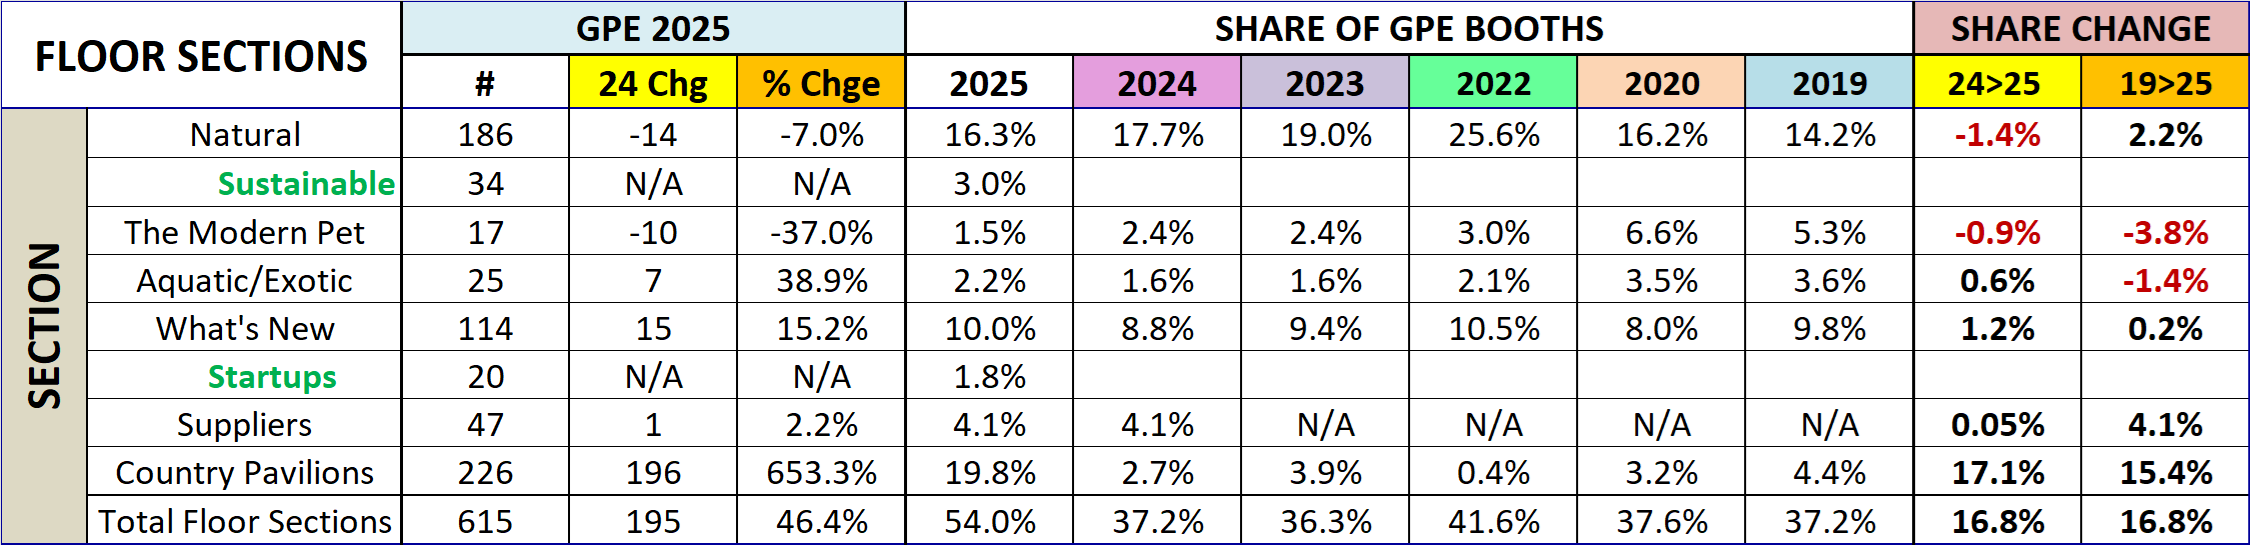
  • Natural – 186 Booths. The number of booths is down from 201 in 24 and the share has been falling since 2022. It is still important as it is a strong trend in society. A new subsection of Sustainability was added this year.
  • Modern Pet – 17 Booths. The booth share continues to fall, down 72% from 2019. This Boutique section is essentially the opposite of Natural and more discretionary in a country that is increasingly focused on “needs”.
  • Aquatic – 25 Booths. This category had strong 24>25 growth but the booth share is still down 56% from 2019.
  • 1st Time Exhibitors – 114 Booths. Their share rebounded in 2025 but most of the 321 exhibitors who didn’t exhibit at GPE (at least from 2019>2024) chose the regular floor or another special section. GPE is a “must do” for new companies and New – products and companies are a major focus of GPE. A Startup subsection was added this year.
  • Supplier – 47 Booths. This section was added in 2024 in response to the growing popularity of OEM products. This trend is still going strong.
  • International/Country Pavvilions – The foreign surge continues and grows. 37% of GPE exhibitors are from 40 foreign countries. The most visible impact is the new China pavilion with 220 booths. Note: All are reserved but 34 are still unassigned.

There are large numbers of exhibitors in the “regular” floor space who would qualify for inclusion in these sections. You need to “work” the whole show to ensure that you get a full view of the product categories of interest to you. I will again be creating a GPE Exhibitor Visit Planner that allows attendees to plan their floor time by targeting the exhibitors with products of interest. The GPE 2025 SuperSearch will be made available by March 10th and be regularly updated with last minute changes. Now, let’s take a look at the results from this year’s research on exhibitors’ product offerings.

1st, we’ll Compare Exhibitor Types– By function: By Animal type (Remember, the 2025 numbers are as of 2/17/25)

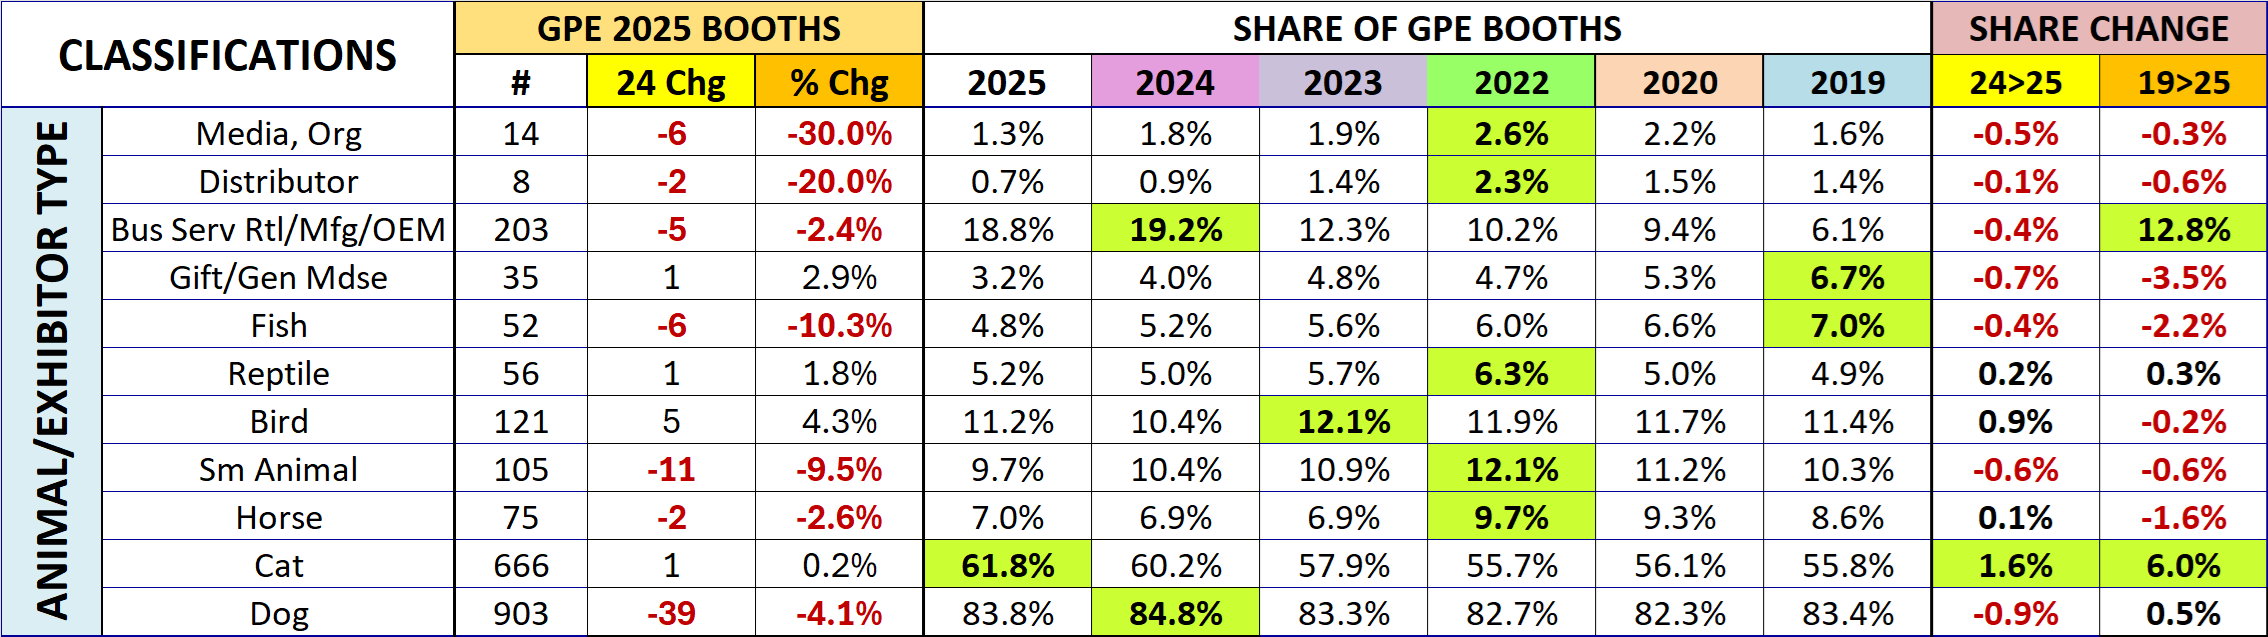
Results were mostly negative as only 4 categories have currently gained share from the 2024 final.

  • Dogs Still Rule – They are still 83>84% of all booths. 5 out of every 6 booths are selling dog products.
  • Cats had the biggest gain of any animal and are now offered by 61.8% of exhibitors. Up from 40% back in 2014.
  • Fish/Aquatic – This category continues to lose share and is down 55% from 2017.
  • Other Animals – Small Animals lost some ground. All others gained share. The biggest lift was in Birds, +0.9%.
  • Business Services – High prices continue to drive the popularity of private label/OEM products. They lost a little share but it is still triple 2019. This reflects the changes in the industry. BTW, there were 8 exhibitors in 2014.
  • Distributors – Their share fell and is again below 1%. The supply chain is shortening for many categories.
  • Gift/Gen Mdse – Their share has been generally declining since peaking at 7.8% in 2016.

Dogs and Cats are still the undisputed royalty of Pet. Because of their huge impact on the industry, I have divided the products designed for them into 33 subcategories. Let’s see how this year’s GPE Top Ten (by booth count) are doing. Note: The 2025 ranks are as of 2/17/25. The 2019>2024 ranks are based upon the final numbers.

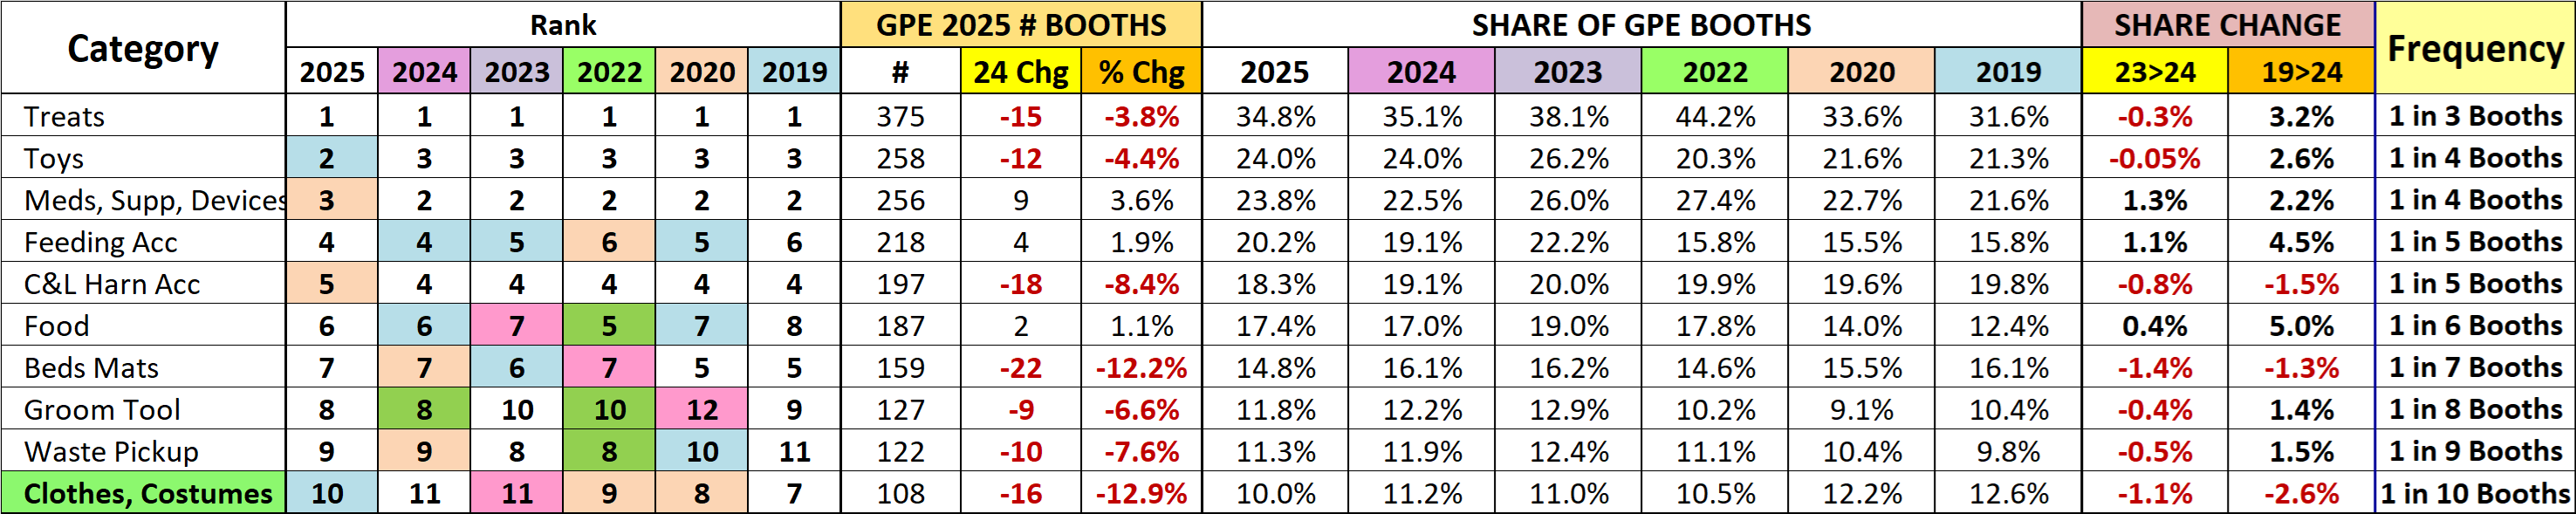
Only 3 have more booths than 2/16/24, but the ranking  changed for 4 – 2 up & 2 down. Clothes/Costumes made the list despite losing -1.1% in share. Food related categories is the big driver. They have the only increases in booth count vs 2024. The biggest share gain was by Meds/Supplements, while Beds had the biggest loss.

  • Treats are still #1 although their share fell by -0.3%. Their priority is reflected in their frequency – 1 in 3 booths offers treats. Many supplements are in treat form and have helped maintain treats at the top.
  • Toys – Toys’ share was stable but they moved up to #2 from #3. This is directly tied to the continuing surge in Chinese companies. 1 in 5 exhibitors are now based in China.
  • OTC Meds/Supplements/Devices – A 3.6% gain in booths and a 1.3% gain in share. Both are the biggest lifts, but they fell from #2 to #3. This anomally was due to a rank change that happened from 2/16/24 to showtime for GPE 2024. They are down 3.6% in share from their peak in 2022, but up 12.8% from 2014 (+116%)
  • Feeding Accessories. They held on to #4. Their booth count and share both rose. Food is the top priority of Pet Parents so bowls/feeders are a necessity. More foreign exhibitors has helped.
  • Collars, Leads & Harnesses – They fell from a tie for #4 to #5. Their share has been relatively stable since 2019 after falling from 22.1% in 2018. In 2016, they also had a 22.1% share which earned them the #2 ranking.
  • Food is a priority as Pet Parents focus on nutrition, health and wellness. Except for some treats, almost all Pet Food sold in the USA is made in the USA. However, frequent purchasing and near record retail prices make it a prime candidate for OEM.
  • Beds/Mats – They had the biggest share loss but stayed #7. They also benefit from more OEM.
  • Grooming Tools – They lost a little share from the record levels of 2023 & 2024, but stayed #8. Once again, Chinese companies are a primary source for this product category.
  • Waste Pickup – They also lost a little share but held on to the #9 spot.
  • Clothes/Costumes – They lost -1.1% in share but Carriers/Crates lost -2.0% so they swapped places – #11 for #10. They are now in the Top 10 for the 1st time since 2022. Both of these strong selling categories are often made for private label.

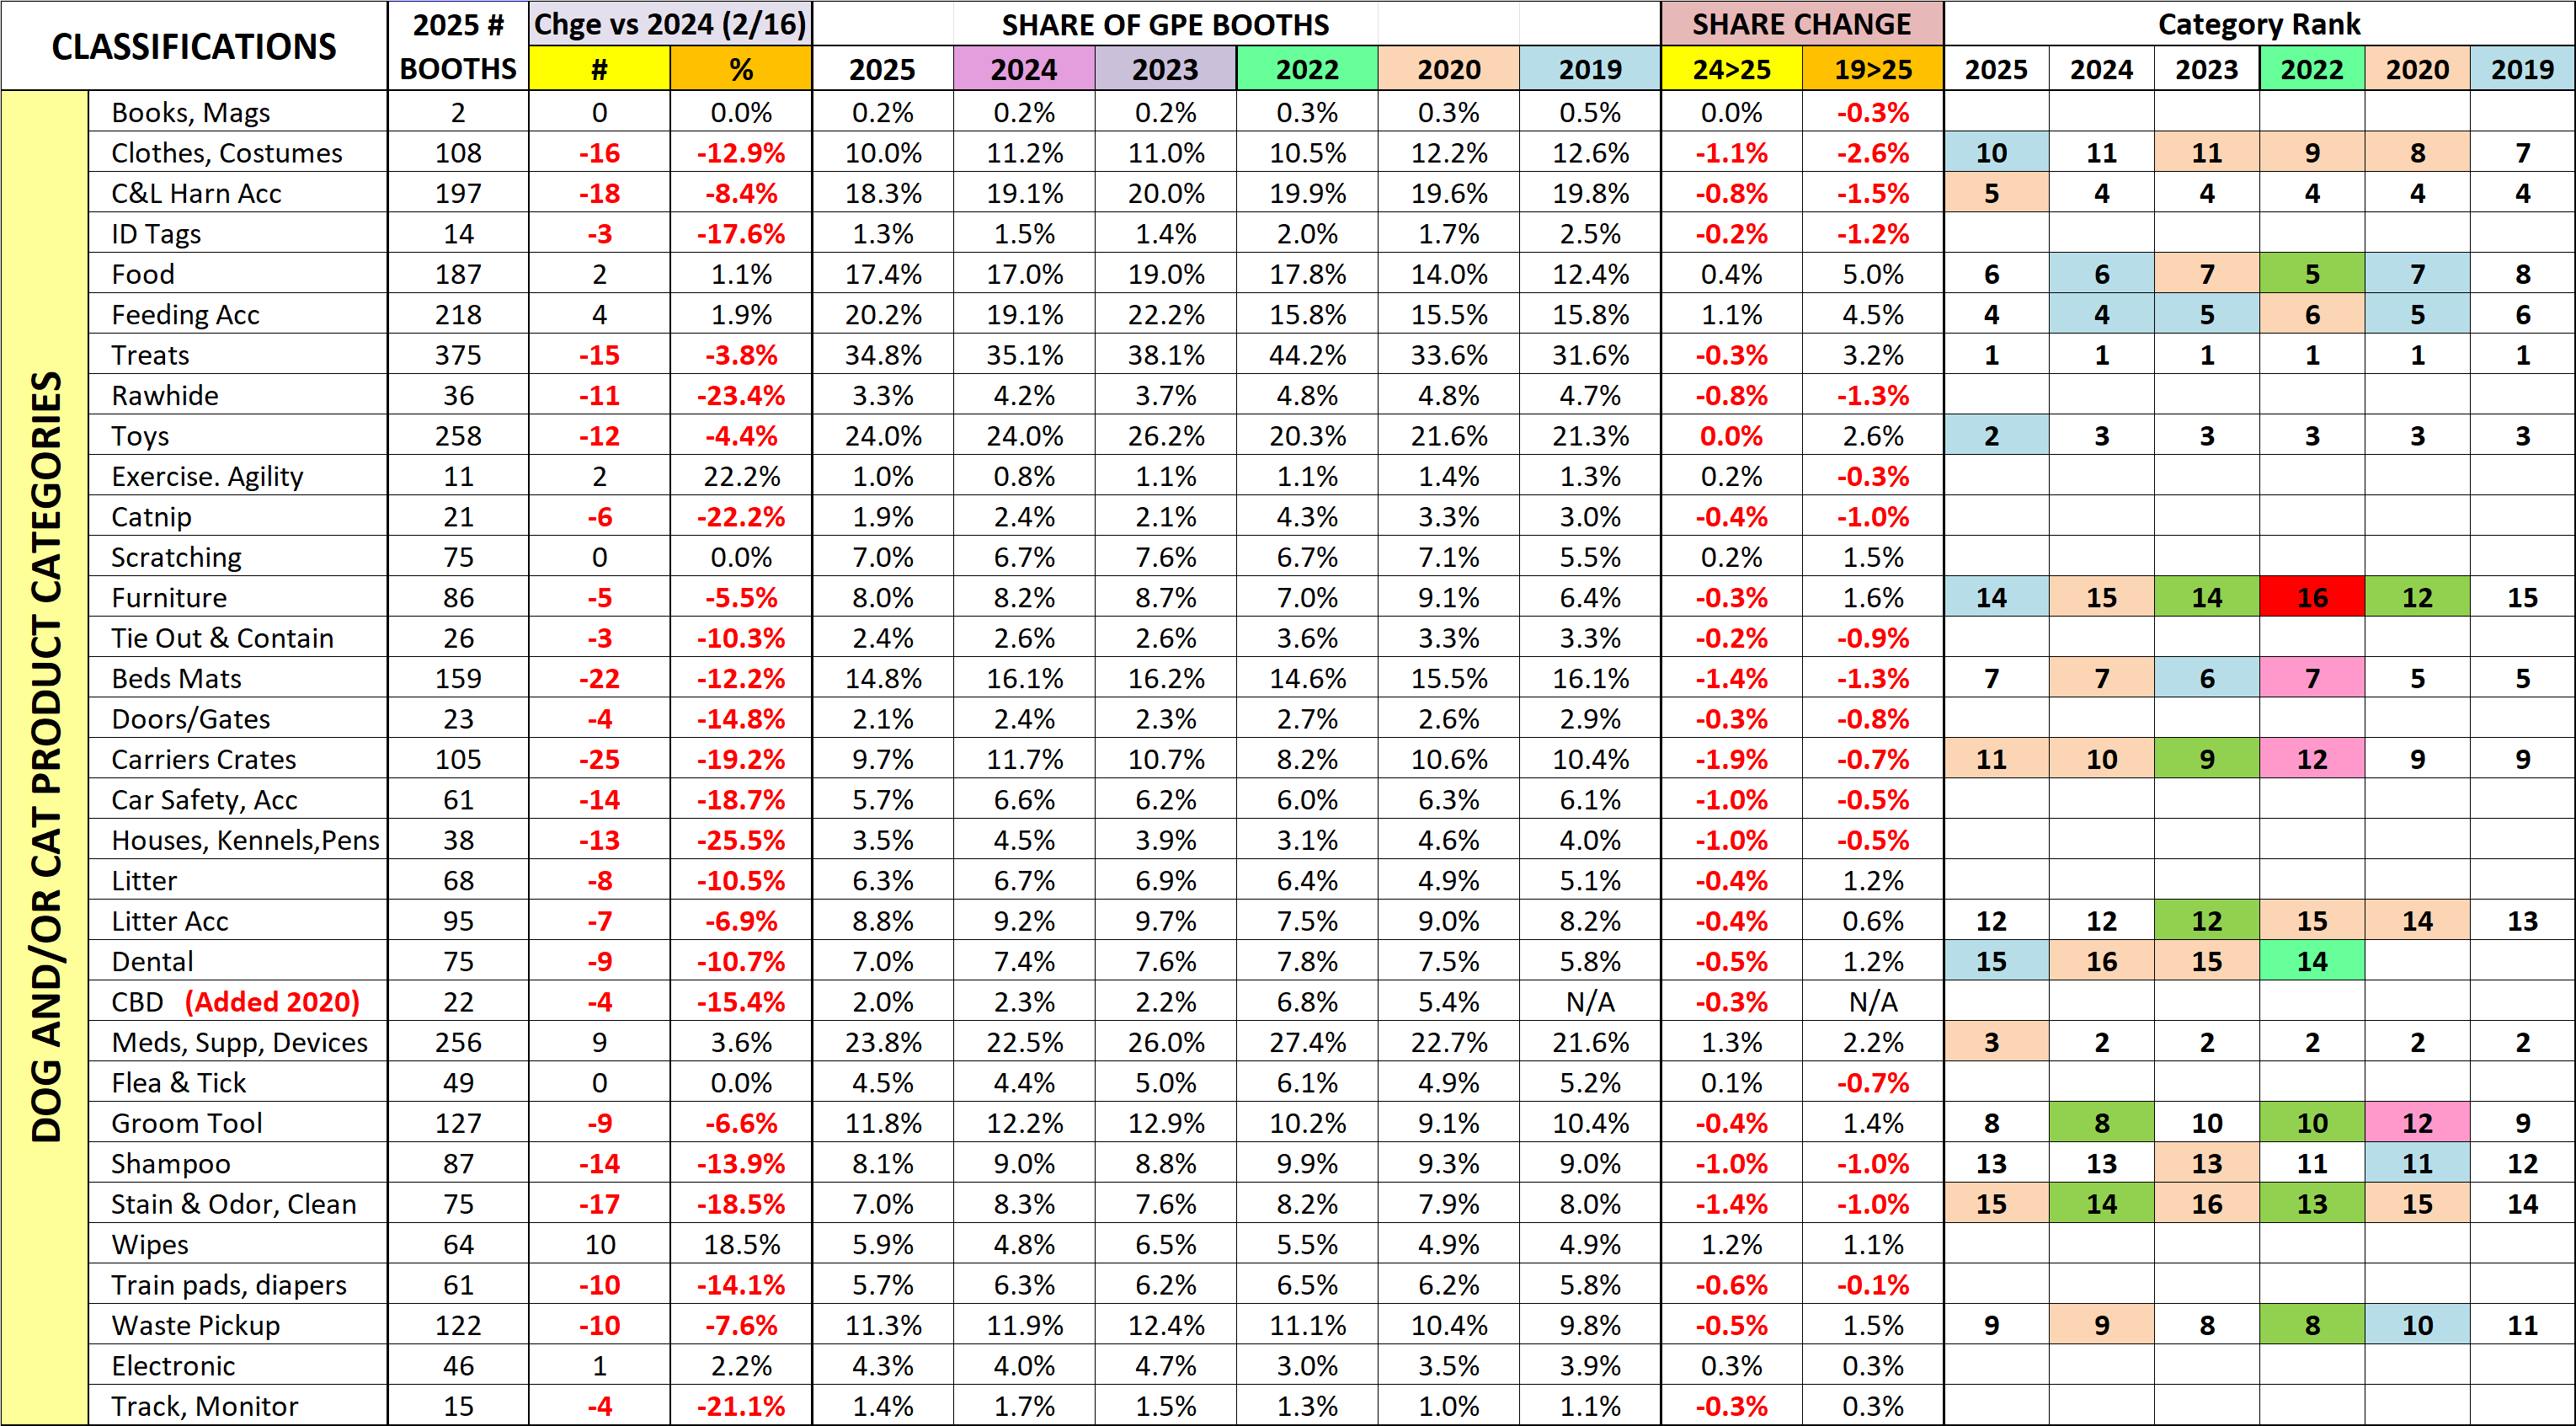
Pet Parents’ concern for the overall health and wellness of their “pet children” remains a big priority but the impact of strong cumulative Petflation has pushed the “value” of Private Label products to the forefront. Their OEM capabilities plus the end of travel restrictions has caused a recent surge in foreign exhibitors, including the huge new China pavilion. They will occupy over 400 booths (37%). In pre-pandemic 2019 they had 295 booths (25%). You first see the impact at the animal type level. In OEM, Dog & Cat are where the $ are. Dogs are #1 (5 of 6 booths) and Cats continue to gain share, now at a record 61.8% (3 of 5 booths). Some product categories are also gaining or keeping an elevated share including Toys, Bowls/Feeders, Grooming Tools, Collars & Leads, Beds and Waste Disposal products.

The last chart details the specifics for all 33 of the Dog/Cat product categories that I defined. Of note: All the data inputs for this report and the SuperSearch tool come from a review of the GPE online exhibitor product listings AND visits to over 1400 websites. They’re not 100% accurate, but pretty close. Which categories are of interest to your business?

GPE 2025 is about innovation and fulfilling needs. There are products, services and education to fulfill every need and…want. There is also an abundance of “new” – both in products and the 250+ exhibitors who are new to Pet Industry shows. However, to reap the benefits, you need a plan. Exhibitors must showcase the “right” items. Attendees need to strategically analyze their data, determine what they need to improve their business and develop a plan to find the products to fulfill their needs. Then…execute the plan. If they do nothing else at GPE, attendees will have 1 minute and 9 seconds to spend at each booth. You definitely need a plan! The GPE 2025 SuperSearch will be available the week of March 10th. It can help. Try it out. Good luck in Orlando!

Petflation 2025 – January Update: Stable at +2.0% vs Last Year

The monthly Consumer Price Index peaked back in June 2022 at 9.1% then began to slow until it turned up in Jul/Aug 2023. Prices fell in Oct>Dec 23, then turned up Jan>Oct 24. Prices fell -0.1% in Nov, but rose 0.04% in Dec and 0.7% in Jan 25. The CPI rose to +3.0% from +2.9% in December. Grocery prices rose 0.8% from December but YOY inflation only grew from 1.8% to 1.9%. After 12 months of 10+% YOY monthly increases, grocery inflation has now been below 10% for 23 months. Even minor price changes can affect consumer pet spending, especially in the discretionary pet segments, so we will continue to publish monthly reports to track petflation as it evolves in the market.

Petflation was +4.1% in Dec 21 while the overall CPI was +7.0%. The gap narrowed as Petflation accelerated and reached 96.7% of the national rate in June 22. National inflation has slowed considerably since then, but Petflation generally increased until June 23. It passed the CPI in July 22 but fell below it from Apr>Jul 24. It exceeded the CPI in August, fell below in Sep>Oct, rose above in Nov, then fell below in Dec>Jan 25. As we drill into the data, all reports will include:

  • A rolling 24 month tracking of the CPI for all pet segments and the national CPI. The base number will be pre-pandemic December 2019 in this and future reports, which will facilitate comparisons.
  • Monthly comparisons of 24 vs 23 which will include Pet Segments and relevant Human spending categories. Plus
    1. CPI change from the previous month.
    2. Inflation changes for recent years (22>23, 21>22, 20>21, 19>20, 18>19)
    3. Total Inflation for the current month in 2024 vs 2019 and vs 2021 to see the full inflation surge.
    4. Average annual Year Over Year inflation rate from 2019 to 2024
  • YTD comparisons (Note: January = YTD, so there will be no separate YTD report this month.)
    1. YTD numbers for the monthly comparisons #2>4 above

In our first graph we will track the monthly change in prices for the 24 months from Jan 23 to Jan 25. We will use December 2019 as a base number so we can track the progress from pre-pandemic times through an eventual recovery. This chart is designed to give you a visual image of the flow of pricing. You can see the similarities and differences in segment patterns and compare them to the overall U.S. CPI. The year-end numbers from 12 and 24 months earlier are included. We also included and highlighted (pink) the cumulative price peak for each segment. In January, Pet prices were up 0.4% from December. Food (+0.5%) & Vet (+0.3%) were up while Supplies (-0.2%) & Services (-0.1%) were down.

In Jan 23, the CPI was +16.4% and Pet was +16.8%. The Services segments inflated after mid-20, while Product inflation stayed low until late 21. In 22, Food prices grew but the others had mixed patterns until July 22, when all rose. In Aug>Oct Petflation took off. In Nov>Dec, Services & Food inflated while Vet & Supplies prices stabilized. In Jan>Apr 23, prices grew every month for all segments except for 1 Supplies dip. In May Products prices grew while Services slowed. In Jun/Jul this reversed. In Aug all but Services fell. In Sep/Oct this flipped. In Nov, all but Food & Vet fell. In Dec, Supp. & Vet  drove prices up. In Jan>Mar 24 Pet prices grew. In April, prices in all but Vet fell. In May, all but Food grew. In June, Products drove a lift. In July, all but Services fell. In Aug, Food drove a drop. In Sep, Products fueled a drop. In Oct, Services drove a lift. In Nov, all were up. In Dec, Total Pet fell. In Jan, the segments were split but Total Pet prices hit a record high.

  • U.S. CPI – The inflation rate was below 2% through 2020. It turned up in January 21 and continued to grow until flattening out in Jul>Dec 22. Prices rose Jan>Sep 23, fell Oct>Dec, rose Jan>Oct 24, fell Nov, then rose Dec>Jan to a record high but 28.8% of the increase since Dec 19 happened from Jan>Jun 22 – 10% of the time.
  • Pet Food – Prices were at the Dec 19 level from Apr 20>Sep 21. They grew & peaked May 23. Jun>Aug ↓, Sep>Nov↑, Dec>Feb↓, Mar↑, Apr>May↓, June↑, Jul>Oct↓, Nov↑, Dec↓, Jan 25↑. 99% of the lift was in 22/23.
  • Pet Supplies – Supplies prices were high in Dec 19 due to tariffs. They had a deflated rollercoaster ride until mid-21 when they returned to Dec 19 prices & essentially stayed there until 22. They turned up in Jan and hit a record high, beating 2009. They plateaued Feb>May, grew in June, flattened in July, then turned up in Aug>Oct to a new record. Prices stabilized in Nov>Dec but grew in Jan>Feb 23. They fell in Mar, but set a new record in May. The rollercoaster continued with Dec>Feb↑, Mar/Apr↓, May/Jun↑, July↓, Aug↑, Sep/Oct↓, Nov/Dec↑, Jan 25↓.
  • Pet Services– Inflation is usually 2+%. Perhaps due to closures, prices increased at a lower rate in 2020. In 2021 consumer demand increased but with fewer outlets. Inflation grew in 21 with the biggest lift in Jan>Apr. Inflation was strong in 22 but prices got on a rollercoaster in Mar>Jun. They turned up Jul>Mar 23 but the rate slowed in April and prices fell in May. Jun>Aug↑, Sep>Dec↓, Jan>Mar 24↑, Apr↓, May↑, June↓, Jul>Nov↑, Dec>Jan 25↓.
  • Veterinary – Inflation has been consistent. Prices turned up in Mar 20 and grew through 21. A surge began in Dec 21 which put them above the overall CPI. In May 22 prices fell and stabilized in June causing them to fall below the CPI. However, prices rose again and despite some dips they have stayed above the CPI since July 22. In 23>24 prices grew Jan>May, leveled Jun/Jul, fell Aug, grew Sep>Dec, fell Jan, grew Feb>May, fell Jun>Jul, grew Aug>Jan 25.
  • Total Pet – Petflation is a sum of the segments. In Dec 21 the price surge began. In Mar>Jun 22 the segments had ups & downs, but Petflation grew again from Jul>Nov. It slowed in Dec, grew Jan>May 23 (peak), fell Jun>Aug, grew Sep/Oct, then fell in Nov. In December prices turned up and grew through March 24 to a record high. Prices fell in April, rose May>June (record), fell Jul>Sep, rose Oct>Nov, fell in Dec, then rose in Jan 25 (record high).

Next, we’ll turn our attention to the Year Over Year inflation rate change for January and compare it to last month, last year and to previous years. We will also show total inflation from 21>25 & 19>25. Petflation was stable at 2.0% in January and it is again below the National inflation rate (by -33.3%). The chart will allow you to compare the inflation rates of 24>25 to 23>24 and other years but also see how much of the total inflation since 2019 came from the current pricing surge. We’ve included some human categories to put the pet numbers into perspective.

Overall, prices were up 0.7% from December and were +3.0% vs Jan 24, up from +2.9% last month. Grocery inflation rose to +1.9% from 1.8%. Only 2 expenditures had price decreases from last month – both Pet: Supplies & Services. There were 2 drops in Oct/Nov but 3 in Aug/Sep & Dec and 5 in July. The national YOY monthly CPI rate of 3.0% is up from 2.9%, but it is  3% below the 23>24 rate and 60% less than 21>22. The 24>25 rate is above 23>24 for 5 – Groceries, Pet Supplies, Med. Services, Pet Services & Haircuts. In our 2021>2025 measurement you also can see that over 80% of the cumulative inflation since 2019 has occurred in 6 segments, 4 are Pet – all but Vet, plus Groceries & the CPI. Except for Pet Services, where prices have surged, Service Segments have had higher inflation rates so there was a smaller pricing lift in the recent surge. Pet Products have a very different pattern. The 21>25 inflation surge provided 95% of their overall inflation since 2019. This happened because Pet Products prices in 2021 were still recovering from a deflationary period. Services expenditures account for 63.8% of the National CPI so they are very influential. Their current CPI is +4.2% while the CPI for Commodities is 0.8%. This clearly shows that Services are driving almost all of the current 3.0% inflation. The situation in Pet is even worse. Petflation: 2.0%. The CPI for the 2 Service Segments is 5.9%. The Pet Products CPI is -0.7%.

  • U.S. CPI– Prices are +0.7% from Dec. The YOY increase is 3.0%, up from 2.9%. It peaked at +9.1% back in June 2022. The targeted inflation rate is <2% so we are now 50+% higher than the target. The January increase was the 4th straight lift after 6 consecutive drops from Apr>Sep. The current rate is below 23>24 but the 21>25 rate is still +21.4%, 81.7% of the total inflation since 2019. The Inflation surge hadn’t started in January 2021, +1.4%
  • Pet Food– Prices are +0.5% vs Dec. but -1.1% vs Jan 24, up from -1.7%. They are still far below the Food at Home inflation rate of +1.9%. The YOY drop of -1.1% is being measured against a time when prices were 20.0% above the 2019 level but the current decrease is still more than double the -0.5% drop from 2020 to 2021. The 2021>2025 inflation surge generated 90% of the 25.1% inflation since 2019. Inflation began in June 2021.
  • Food at Home – Prices are up +0.8% from December but the YOY increase only grew from 1.8% to 1.9%. This is radically lower than Jul>Sep 2022 when it exceeded 13%. The 28.8% Inflation for this category since 2019 is 10% more than the national CPI but only in 4th place behind 3 Services expenditures (2 Pet). 81% of the inflation since 2019 occurred from 2021>25. This is lower than the CPI, but we should note that Grocery prices began inflating in 2020>21 then the rate accelerated. It appears that the pandemic supply chain issues in Food which contributed to higher prices started early and foreshadowed problems in other categories and the overall CPI tsunami.
  • Pets & Supplies– Prices were -0.2% from December and YOY inflation fell to +0.6% from 1.5%. They still have the lowest rate vs 2019. Prices were deflated for much of 20>21. As a result, the 2021>25 inflation surge accounted for 111% of the total price increase since 2019. Prices set a record in October 2022 then deflated. 3 monthly increases pushed them to a record high in Feb 23. Prices fell in March, rose Apr/May (record), fell Jun>Aug, grew Sep>Oct, fell Nov, grew Dec>Feb 24, fell Mar>Apr, rose May>Jun (record), fell July, rose Aug, fell Sep>Oct, rose Nov>Dec, fell in Jan 25.
  • Veterinary Services– Prices are +0.3% from December and +6.6% from 2024, up from 6.2% last month. They are now #1 in inflation vs 24 and still the leader in the increase since 2019 with +45.5% and since 2021, +33.0%. For Veterinary, relatively high annual inflation is the norm. However, the rate has increased during the current surge, especially in 23 & 24. It also has the highest rate in 25, but only 72.0% of the cumulative inflation since 2019 occurred from 2021>25.
  • Medical Services – Prices turned sharply up at the start of the pandemic but then inflation slowed and fell to a low rate in 20>21. Prices rose +0.3% from December, but inflation vs last year slowed to +2.7% from +3.4%. Medical Services are not a big part of the current surge as only 50.8% of the 18.3%, 2019>25 increase happened from 21>25.
  • Pet Services – Inflation slowed in 2020 but began to grow in 21. In 24 prices surged Jan>Mar, fell in April, rose in May, fell in June, rose Jul>Nov, then fell in Dec>Jan 25. In Jaanuary, their rate plummeted from 11.5% to 5.5% and they fell from #1 to #2 in YOY inflation. However, 81.2% of their total 19>25 inflation has occurred since 21. In Dec 23, it was 49%.
  • Haircuts/Other Personal Services – Prices are +0.5% from Dec and +4.6% from Jan 24. 11 of the last 13 months have been 4.0+%. Inflation has been pretty consistent. 64.7% of the 19>25 inflation happened 21>25, 66.7% of the time.
  • Total Pet– Petflation was unchanged at 2.0%. 2 segments had a higher rate and 2 were lower. It is 57% less than the 23>24 rate and 33% below the U.S. CPI. Plus, 2.0% is 35.5% below the 3.1% average January rate since 1997. Jan prices rose 4%, driven by Food & Vet. The Dec>Jan increase was equal to the 97>24 average change and expected. A drop has only occurred in 2 of the last 27 years. The big factor in the CPI stability was that prices also rose 0.4% in Dec>Jan 24. In January, the recovery continued, and we are getting closer to a full recovery.

The Petflation recovery paused in August  24, came back Sep>Oct, paused in November, then resumed in Dec>Jan 25. At 2.0%, January was 35.5% below the 27 yr 97>24 average. We tend to focus on the monthly YOY inflation in the current year and forget that what happened last year is a big factor in determining the current inflation rate. In Dec>Jan, Pet prices rose 0.4% but the YOY rate was stable at 2.0%… because prices also rose 0.4% in 2024. We also ignore the fact that inflation is cumulative. Pet prices are 23.3% above 2021 and 28.6% higher than 2019. Those are big lifts. In fact, January prices reached a record high for Veterinary and Total Pet. All other segments are within 1.5% of the highest price in history. Only Supplies prices (+12.3%) are less than 25.1% higher than 2019. Since price/value is the biggest driver in consumer spending, inflation will affect the Pet Industry. Services will be the least impacted as it is the segment most  driven by high income CUs. Veterinary will likely continue to see a reduction in visit frequency. The product segments will see a more complex reaction. Supplies are more discretionary so we will likely see a reduction in purchase frequency. In Pet Food, the most needed segment, some Pet Parents may even downgrade their Pet Food. However, the biggest impact in both product segments will be a strong movement to online purchasing and private label. We saw proof of this at both GPE 24 & SZ 24 as a huge # of exhibitors offer OEM services. At GPE 25, this trend will continue. Strong, cumulative inflation has a widespread impact.

2023 Veterinary Spending was $35.66B – Where did it come from…?

Now we will turn to Veterinary Services. For years, Veterinary Services have had high inflation. This has resulted in CU income becoming the dominant factor in spending and a reduction in visit frequency.

In 2017 low inflation drove a 7.2% increase in visit frequency and a $2.5B spending lift. In 2018 inflation returned to normal. Consumers spent $0.56B more (+2.7%), but inflation was 2.6% so almost all of the lift was from higher prices. In 2019 the situation got worse. Consumers spent $0.58B (+2.7%) more but inflation was 4.1% so there was a decrease in the amount Vet Services purchased. In 2020 the pandemic hit, and Pet Parents focused on needs – Food & Veterinary. Veterinary spending grew $3.05B, (+14.0%). In 2021, this behavior grew even stronger and produced a record $7.82B (+31.5%) increase. In 2022 inflation reached 8.8%. Spending fell -$2.95B (-9.0%) but the amount of Vet Services sold fell 16.4%. In 2023 inflation was 9.4% but Vet Care is needed so spending grew $5.95B (+20.0%) – with inflation, +9.7%.

We’ll start our analysis with the groups who were responsible for the bulk of Veterinary spending in 2023 and the $5.95B increase. The first chart details the biggest Veterinary spenders for each of 10 demographic categories. It shows their share of CU’s, share of Veterinary spending and their spending performance (Share of spending/share of CU’s). In terms of performance – 5 groups perform above 120%, the same as 2022, but 1 less than 2018>2021. This is 1 less than Supplies, 2 less than Services (7) but 2 more than Food (3). This means that these big spenders are performing well but it also signals that there is still disparity between the best and worst performing demographics in this “needed” segment. Only the Age & Income groups are different from Total Pet and the categories are listed in the order that reflects their share of Total Pet $pending. Again, High Income is the most important factor in Spending.

  1. Race/Ethnic – White, not Hispanic (84.7%) down from 86.0%. This group accounts for the vast majority of spending in every segment but lost share in Vet $ in 2023. Their 127.6% performance is also down from 128.0% but they grew from #5 to #4 in importance in Veterinary Spending. Only African Americans spent less, -$0.04B (-3.8%). Whites spent $4.64B (+18.2%) more but their share & performance fell because of a $1.24B (58.7%) lift by Hispanics.
  2. # in CU – 2+ people (82.0%) up from 79.8% This group, which is 69.8% of U.S. CUs, gained in share and their performance grew from 115.7% to 117.5%. Their rank in importance in Vet Spending moved from #8 to #7. All but 4 People spent more. The gains happened because Singles had a much smaller lift (+7.0%) than 2+ CUs (+23.3%).
  3. Housing – Homeowners (81.2%) down from 83.9% Homeownership is a major factor in pet ownership and spending in all industry segments. In terms of importance to Veterinary spending, their 124.8% performance rating is down from 128.9%, and they dropped to 5th from 4th place. All segments increased spending. Renters were +39.7% while Homeowners were +16.2%. This produced the drops in share & performance for Homeowners. We should also note that Homeownership is definitely not as important to Veterinary Spending as it once was. In 2015 their share was 88.4% with performance of 141.8%.
  4. Age – 35>64 (60.8%) down from 61.1% Their performance also fell from 117.1% to 116.7% and they fell to 8th from 6th place in importance. All ages spent more but 45>54 was only +0.2% while <25 was +190.1%. These were big factors in the group’s small drops in share and performance.
  5. Area – Suburban & Rural (69.3%) down from 70.9% Suburban CU’s are the biggest spenders in every segment. All areas spent more. Center City had the biggest % increase, +27.2%, while Rural was only up +6.0%. This drove the drop in share and caused their performance to fall to 106.0%, from 108.2%. They’re still last in importance.
  6. Income – Over $100K (61.1%) up from 57.0% Their performance also grew from 160.8% to 167.7%. Higher income is still the most important factor in Veterinary spending. The only drops were from <$30K, -$1.11B and $50>69K,  -$0.10B. The $100K> groups spent $4.85B more. This caused he big lifts in share and performance.
  7. # Earners – “Everyone Works” (69.2%) up from 67.7% Their Performance also grew from 116.1% to 118.0%. They moved up from #7 to #6 in importance. Only No Earner, Singles spent less. 3+ Earners were only +$0.05B but 2 Earners & 1 Earner, Singles spent $4.56B more. They drove the group’s lifts.
  8. Occupation – All Wage & Salaried (68.6%) up from 65.9% and their performance increased from 109.3% to 112.6%. In the group, only Blue Collar spent less. Outside the group, Self-employed & A/O, Unemployed spent less. White Collar workers spent $5.32B, +35.6% more. They drove the lifts in share in performance. We should also note that their perfomance lift was slowed a little because they had 1.1 million more CUs than in 2022.
  9. CU Composition – Married Couples (61.5%) down from 62.5% Their performance also fell to 127.7% from 130.8% and they moved down to #3 from #2 in importance. Only Married, Oldest Child 18> & Single Parents spent less. The drops in share and performance were due to big lifts by Singles & Unmarried, All Adult CUs.
  10. Education – College Grads (64.9%) up from 60.9%. Income generally increases with education. It is also important in understanding the need for regular Veterinary care. Their performance also increased from 130.3% to 135.8% and they moved up from #3 to #2 in importance. Only HS Grads or less spent less in 2023. College grads (47.8% of CUs) generated 84.7% of the 22>23 lift and 100% of the big increases in share and performance.

Spending disparity rose in 5 categories and fell in 5 categories. The average group performance was 125.4%, up from 123.2% in 2022 so spending became slightly less balanced. Notably, higher income & education became a little more important. In fact, a College Degree rose to #2 in importance.

Now, we’ll look at 2023’s best and worst performing Veterinary spending segments in each category.

There are no surprising winners or losers but 9 are different from 2022, up from 4 last year. This is 5 more than Services, and 1 more than Supplies but 2 less than the 11 in Food. Also, the average difference between Best & Worst was 89.8%, a little more than 88.8% in 2022. There was considerable turmoil, but it was evenly divided so the change in spending disparity between segments in 2023 was minimal. The changes from 2022 are “boxed”. We should note:

  • Income– The Winner & Loser are the same. The gap is 175.0% but 6.8% less than 2022.
  • Earners – 2 Earners replaced 3+ Earners on top but the gap widened by 3.8%.
  • Occupation – Blue Collar replaced Service Workers at the bottom and the gap widened a lot, +32.3%.
  • Age – 55>64 replaced 45>54 yr-olds and 75+ replaced <25. The gap actually narrowed by an incredible -42.0%.
  • Race/Ethnic; Another set of expected repeats. The gap between winner and loser widened by 6.2%
  • Education; Housing; Area – These all had an expected repeat winner & loser, but the performance gap change for Education was very different. Education: +33.3%; Housing: -15.0%; Area: -19.2%.
  • Region – West replaced Midwest at the top. The South has now finished last for 8 years in a row, but the win/lose gap increased by 12.2%. Also, 3 regions performed at 100+%. That hasn’t happened since 2018.
  • CU Composition – Couple Only replaced Child 18> & Single Parents replaced Child <6. The gap widened +14.8%.
  • # in CU – 3 People replaced 4 on top and the gap grew by +5.3%. Only 2 & 3 people CUs perform above 100%.
  • Generation – Born <1946 replaced Gen Z at the bottom and the performance gap narrowed by -13.4%.

It’s time to “Show you the money”. Here are segments with the biggest $ changes in Veterinary Spending.

We saw some turmoil in performance. It continues here. There was 1 repeat, and 13  segments flipped from 1st to last or vice versa. Last year there were 3 repeats and 14 flips. There were no truly surprising winners and there was only 1 surprising loser – the high income, 45>54 yr olds. In 2023 there were 4 categories in which all segments spent more. In 2022, there were 3 where all spent less. Plus, in 2022, only 23% of 96 demographic segments spent more. In 2023, that grew to 82.3%. If you consider 9.4% inflation, 67.7% still spent more.

  • Race/Ethnic – The winner and loser flipped.
    • Winner – White, Not Hispanic– Veterinary: $30.19B; Up $4.64B (+18.2%)                                            2022: African Americans
    • Loser – African Americans – Veterinary: $1.13B; Down $0.04B (-3.8%)                                                   2022: White, Not Hispanic
    • Comment– African American were the only group that spent less and the drop was small. Hispanics spent $1.24B, +58.7% more after a $1.12B drop in 2022. Asian Americans also spent a little more, $0.11B, +12.3%. That’s 4 consecutive years of increases for this group with a low level of pet ownership – very encouraging.
  • Occupation – The winner and loser both flipped back to more “normal” positions.
    • Winner – Mgrs & Professionals – Vet Spending: $14.77B; Up $4.10B (+38.4%)                                    2022: Blue Collar
    • Loser – Blue Collar – Vet Spending: $1.36B; Down $0.56B (-29.2%)                                                         2022: Mgrs & Professionals
    • Comment – All Other/Unemployed & Self-Employed also spent less. We should also note that Retired had the 2nd largest lift, both in $ and percentage, +$1.66B, +31.6%.
  • Education – Adv. College degree flipped to the top. HS Grads replaced them at the bottom.
    • Winner – Adv. College Degree – Veterinary Spending: $11.85B; Up $3.79B (+47.1%)                           2022: <HS Grads
    • Loser – HS Grads – Veterinary Spending: $2.70B; Down $0.35B (-11.5%)                                                 2022: Adv College Degree
    • Comment – In 2023, only HS Grads or less had spending decreases. < College still spent $0.90B more in 2023, almost triple their 2022 lift. However, the big turnaround was in College Graduates. In 2022 they spent -$3.27B less than in 2021. In 2023 they spent $5.04B, +27.8% more. 85% of the Vet $ lift came from 48% of the CUs.
  • # Earners – The winner and loser both flipped.
    • Winner – 2 Earners – Veterinary Spending: $15.69B; Up $3.49B (+28.6%)                                              2022: No Earner, Single
    • Loser – No Earner, Single – Veterinary Spending: $1.79B; Down $0.65B (-26.7%)                                 2022: 2 Earners
    • Comment – No Earner, Singles had the only decrease, but No Earner, 2+ CUs spent $1.04B more. Interestingly, the highest income segment, 3+ Earners had the smallest lift, +$0.05B, +1.2%.
  • # in CU – 2 People flipped to the top and 4 People replaced them on the bottom.
    • Winner – 2 People – Veterinary Spending: $15.13B; Up $3.20B (+26.8%)                                                 2022: 3 People
    • Loser – 4 People – Veterinary Spending: $4.29B; Down $0.49B (-10.3%)                                                  2022: 2 People
    • Comment: In 2022, all groups spent less. In 2023, only 4 People CUs spent less. The 22>23 lift was definitely concentrated as 2 & 3 People CUs (47.7% of CUs) produced 88.4% of the lift, +$5.26B.
  • Area Type – Suburbs 2500> flipped from last to 1st and Rural replaced them at the bottom.
    • Winner – Suburbs 2500> – Veterinary Spending: $17.21B; Up $3.17B (+22.6%)                                    2022: Center City
    • Loser – Rural – Veterinary Spending: $7.48B; Up $0.43B (+6.0%)                                                              2022: Suburbs 2500>
    • Comment – In 2020 & 2021 all groups spent more. In 2022, all spent less. In 2023, all spent more again. Since 2020, all segments have the same spending pattern. Center City settled into 2nd place after flipping for 3 straight years. The Suburbs 2500> have the biggest share of Vet $, 48.3% and generated 53.3% of the lift.
  • CU Composition – The winner & loser are again both new.
    • Winner – Married, Couple Only – Veterinary: $11.17B; Up $2.30B (+26.0%)                                       2022: Married, Child 6>17
    • Loser – Married, Child 18> – Veterinary: $2.79B; Down $0.49B (-14.9%)                                               2022: Unmarried, 2+ Adults
    • Comment – Single Parents also spent less. 2023 favored CUs with no children. Married, Couple only had the biggest lift and 2nd place went to Unmarried, 2+ All Adult CUs, +$2.18B, +50.9%.
  • Region – The Midwest flipped to the bottom and the West replaced them on top. This ends 5 yrs of Northeast flips.
    • Winner – West – Veterinary Spending: $10.32B; Up $2.30B (+28.6%)                                                     2022: Midwest
    • Loser – Midwest – Veterinary Spending: $7.93B; Up $0.31B (+4.1%)                                                        2022: Northeast
    • Comment – All Regions spent more. In 2022, only the Midwest increased spending.
  • Generation – Both winner & loser are new. (CU Comp was the only other category with a new winner & loser.)
    • Winner – Baby Boomers – Veterinary: $11.94B; Up $2.21B (+22.7%)                                                     2022: Gen X
    • Loser – Born <1946 – Veterinary: $1.38B; Down $0.44B (-24.0%)                                                             2022: Millennials
    • Comments – Only the oldest group spent less. In 2022, Millennials had the biggest drop. In 2023 they finished a close 2nd to the Boomers, +$2.09B, +29.3%. In 2022, Gen Z “got on board” in every aspect of Pet Parenting, including an +80.9% increase in Veterinary $. In 2023 their commitment continued to grow as Vet $ were +133%.
  • Housing – Homeowners w/Mtges stayed on top while those w/o Mtges replaced Renters at the bottom.
    • Winner – Homeowner w/Mtge – Veterinary: $19.11B; Up $2.21B (+13.1%)                                          2022: Homeowner w/Mtge
    • Loser – Homeowner w/o Mtge – Veterinary$: $86B; Up $1.83B (+22.9%)                                             2022: Renter
    • Comment – In 2023, all spent more. In 2022, all spent less but Renters had the only drop over -$1B. From 2020>2023: Homeowners w/Mtges are +$5.05B (+35.9%); Homeowners w/o Mtges are +$3.27B (+49.6%); Renters are +$2.51B (+59.9%). That’s strong, widespread growth in this category.
  • Age – Both winner and loser flipped. That’s the 2nd consecutive flip for 55>64.
    • Winner – 55>64 yrs – Veterinary Spending: $8.29B; Up $2.15B (+35.0%)                                             2022: 45>54 yrs
    • Loser – 45>54 yrs – Veterinary Spending: $6.91B; Up $0.01B (+0.2%)                                                    2022: 55>64 yrs
    • Comment: All segments spent more. The lift for 45>54 was virtually no gain. In 2022 the spending skewed a little older. In 2023, it also skewed older, but the lift was pretty evenly divided by the 45>54 age group. Segments below 45 yrs old spent $2.70B more (46% of the lift). Those 55> spent $3.23B more (54% of the lift).
  • Income – $150>199K flipped to the top and <$30K replaced them at the bottom.
    • Winner – $150>199K – Veterinary Spending: $5.35B; Up $1.92B (+55.9%)                                           2022: $200K>
    • Loser – <$30K – Veterinary Spending: $1.97B; Down $1.11B (-35.9%)                                                    2022: $150>199K
    • Comment – Only the <$30K & $50>69K groups spent less. All groups $70K> had $1B increases so they were close to winning. Their increases were 21+% and generated 108% of the $5.95B Veterinary lift.

We’ve now seen the winners and losers in terms of increase/decrease in Veterinary Spending $ for 12 Demographic Categories. 2022 had a $2.95B drop. The decrease brought a lot of turmoil in the $ changes. In 2023 there was a huge turnaround as spending rose $5.95B, +20.0%  and reached $35.66B. The big flip in spending caused the  turmoil in $ change to continue. In 2023 only 1 held their spot and 13 flipped from 1st to last or vice versa. In 2022 there were 3 holds and 14 flips – about the same. The biggest difference was that in 2022, only 23% of demographics spent more and there were 3 categories where all spent less. In 2023, 87% spent more and there were 4 categories where all segments had increases. This made the “hidden gems” much easier to find. Here are some segments that didn’t win but helped drive the big lift in Veterinary spending. These groups don’t win an award, but they certainly deserve…

HONORABLE MENTION

Married, Oldest Child <6 are just getting started. They have slightly above average income so the 142% lift in Vet spending shows that they are also committed to their Pet Children. Gen Z “got on board” with Pet Parenting in 2022. With big lifts in all segments, their commitment is growing even stronger in 2023. Hispanics have high pet ownership but low income. In 2022, their Vet spending fell $1B. In 2023, they found the $ for the needed services, +$1.24B. Lower incomes are always challenged by Veterinary high prices but many of the services are necessary for the health of their pets. In 2023, No Earner, 2+ CUs & $70>99K found over $1B more to spend on Vet Services. Renters also have low income, but pet ownership is growing in this segment. They had 30+% increases in the most needed segments – Pet Food & Vet Services.

Summary

In 2020 the pandemic focused Pet Parents on the needed segments. This drove a $3B increase in Veterinary $. Boomers & Millennials led the way, but the lift was widespread as 85% of demographic segments spent more. In 2021 the lift grew to a record $7.82B with 93% of all segments spending more including 9 categories where all segments had increases. In 2022, the “binge” was not repeated. Inflation also increased radically to 8.8% and spending fell -$2.95B (-9.0%). Only 23% of demographics spent more and in 3 categories all segments decreased spending.

In 2023 Inflation grew to 9.4% but the higher income groups stepped up. The $30>49K segments also found the necessary $ so their spending increased. The result was a $5.95B, +20.0% increase as Veterinary Spending reached $35.66B. In 2023, 82.3% of demographics spent more and in 4 categories all segments increased spending. Even considering the 9.4% inflation, 67.7% spent more – a big change from 2022.

The performance of big spending groups is very important in all industry segments. In Veterinary we identified 5 demographic categories with high performing (120+%) large groups. That is the same as 2022. It is 2 more than Pet Food, but 1 less than Supplies & 2 less than Services. The big groups with a high performance level in Veterinary are:

  • Income: $100K> (167.7%) Performance increases with income but doesn’t reach 100+% until income reaches $70K
  • CU Composition: Married Couples (127.7%) Only Married Couples (except Child <6) & All Adult CUs perform at 100+%.
  • Education: College Grads (135.8%) Performance increases with education. All with an Associate’s Degree> are 100+%
  • Housing: Homeowners (124.8%) Only Renters (53.8%) perform below 100%.
  • Race/Ethnic: White, Not Hispanic (127.6%). Hispanics, African Americans & Asians only perform between 25% and 62%

Consumers have no control over Race/Ethnicity but can make decisions in the other categories. Income is still the most important factor. The others are important but essentially equal in performance – 125>136%. Although spending grew, the balance was basically unchanged with again 5 big groups performing over 120%. Another indication of this is that the average spending disparity between the best and worst performing segments only grew from 88.8% to 89.8%. We should note that the 50/50 spending dividing line did increase from $115K to $124K, emphasizing income’s importance.

Perhaps the biggest concern is high inflation. In 2021 spending grew 31.5% in the pandemic surge. Inflation was high at 4.2% but 84% of the growth was real. In 2022 spending fell -9.0%. Inflation was 8.8% so the amount sold was really down -16.4%. Also 77% of 96 demographic segments spent less $ but if we factor inflation into the numbers, 91% actually bought less Veterinary Services. In 2023, inflation reached a record 9.4%. Spending was +20.0% so the “real” increase was 9.7%. If high inflation continues it could have a major impact on Veterinary Spending. We’ll see.

Finally – The “Ultimate” Veterinary Services Spending CU consists of 4 people – a married couple with children. Their oldest child, still at home is under 18. They are 55>64 years old. They are White, but not of Hispanic origin. Both work. At least one of them has an Adv. College Degree and is a Mgr/Professional. Their total income is $200K>. They live in a small suburb, adjacent to a big city in the Western U.S. and are still paying off the mortgage on their home.

2023 Pet Services Spending was $13.42B – Where did it come from…?

Next, we will look at Pet Services. It is still by far the smallest Segment, but like Supplies and Veterinary, it had a record increase in 2021. However, unlike them, there was no $ drop in 2022. The lift grew stronger, up $3.26 (+35.8%). After the great recession, Services’ annual spending slowly but steadily increased. During this time, the number of outlets offering Services strongly grew as brick ‘n mortar retailers looked for a way to combat the growing influence of online outlets. After all, you can buy products, but you can’t get your dog groomed on the Internet. This created a highly price competitive market for Pet Services. In 2017 there was a slight increase in visit frequency, but Pet Parents just paid less. This resulted in a 1.0% decrease in Services spending. In 2018 consumer behavior changed as a significant number decided to take advantage of the increased availability and convenience of Pet Services and spending literally took off, +$1.95B (+28.9%), the biggest increase in history. In 2019 Pet Parents, especially the younger ones, value shopped, and spending turned down $0.10B. In the 2020 pandemic Services outlets were often deemed nonessential and were subject to restrictions and closures which drove a huge drop in $. In 2021 things opened up and Services spending rebounded with 2 consecutive record lifts in 2021 & 2022. In 2023, the growth continued but it slowed, +$1.05B (+8.5%).

Services spending is the most discretionary, but its reach is expanding. Let’s look deeper into the demographics.

Let’s start by identifying the groups most responsible for the bulk of Services spending in 2023 and the $1.05B increase. The first chart details the biggest Pet Services spenders for each of 10 demographic categories. It shows their share of CU’s, share of Services spending and their spending performance (Share of spending/share of CU’s). In order to better target the bulk of the spending we had to alter the groups in 4 categories – income, area, age & housing. The performance level should also be noted as 7 of 10 groups have a performance level above 120%. This is 1 more than 2022 and the most for any segment. Supplies has 6. Veterinary and Total Pet have 5 but Food has only 3. This indicates that the disparity between the best and worst performing segments grew a little in 2023 and is still the highest of any segment. Income is still the biggest factor in Services Spending. The categories are presented in the order that reflects their share of Total Pet $ which highlights the differences of the 6 matching groups. For Services, the biggest share ranking differences from Total Pet are that the # of Earners and Education are more important in Services.

  1. Race/Ethnic – White, not Hispanic (84.2%) down from 84.9%. This big group accounts for most of the spending in all segments. Their performance grew from 126.3% to 126.9% but they dropped from 4th to 5th place in importance. Only Hiispanics spent less. Big lifts by the other groups caused the share drop but fewer CUs improved performance.
  2. # in CU – 2+ people (81.4%) up from 80.2% Their performance also increased from 116.0% to 116.7% but they stayed #8 in importance. All sizes spent more. The small lift in share and performance happened because 2+ CUs had a bigger % lift than 1 Person CUs.
  3. Housing – Homeowners w/Mtge (61.3%) up from 56.7%. Homeownership is a big factor in spending in all industry segments. This special group was created because those w/Mtge reached the 60% target. Their performance grew from 148.9% to 162.6% and they moved up from #5 to #2 in importance. Homeowners with and without a mortgage spent more. Renters spent -12.3% less.
  4. Age – 35>64 (64.8%) up from 60.0%. Their performance grew from 115.0% to 124.0%. They re-joined the 120+% club and moved up to #6 from #9 in importance. 25>34 & 65>74 spent less. This concentrated spending in the 35>64 group. Their $1.27B spending lift drove the increases in share & performance and put them in the 120% club.
  5. Area – City/Suburbs >2500 (79.2%) up from 77.8% in share, and performance grew from 96.2% to 97.8%. Again they didn’t earn their share of $pending. Services is an Urban Segment. All Areas spent more but the Suburbs had the biggest lift and drove Share and Performance up. The group’s performance is <100% due to Center City.
  6. Income – $100K> (70.7%) up from 64.2% This group’s performance rating is 194.1%, up from 193.6%. CU income is still by far the most important factor in increased Pet Services Spending. Only the $50>69K, $100>149K & $200K> income groups spent more. At +$1.16B, $200K> was the big driver in the share gain. The peformance increase was small because the number of CUs <$100K fell -4.5% while those $100K> increased by 10.2%.
  7. # Earners – “Everyone Works” (72.5%) up from (72.2%) All adults in the CU are employed. Income is important so a high market share is expected. Their performance dropped to 123.6% from 123.7% and they fell from #6 to #7 in importance. All CUs within the group spent more. Only No Earner, Singles spent less. The slight performance drop was due to an increase in CUs.
  8. Occupation– All Wage & Salary (66.2%) down from 70.3% and their performance rating fell from 116.5% to 108.7%. They dropped fro #7 to #9 in importance. Only Tech/Sales/Clerical and Service Workers spent less on Services in 2023. Managers & Professionals had the biggest $ increase, +$0.18B but it was only +3.3%. Retirees and A/O, Unemployed were +$0.76B. In fact, the Wage Group was only +$0.20B while those outside the group were +$0.85B. This caused the big drops in share and performance.
  9. CU Composition – Married Couples (67.8%) up from 63.6%. Married couples are a big share of $ and have 123+% performance in all segments. Their performance increased to 140.7% from 133.1% but they fell from #3 to #4 in importance in Services spending. Led by Couples Only (+$0.51B), all Married CUs spent more. They were +$1.24B (+15.7%) while Unmarried CUs were -$0.19B. This drove the big lifts in share & peformance.
  10. Education – College Grads (72.7%) up from 69.8%. Income generally increases with education so Services spending grows with increasing education. Performance grew from 149.3% to 152.0% but Education fell from #2 to #3 in importance. Only Assoc Degree spent less but the drop made <College -$0.07B. College Grads were +$1.12B, +13.0%

We changed 4 of the groups for Services – Income, Area, Housing & Age to better target the biggest spenders. We should also note that Income is still more important to spending in Services than in any other segment. In the Big Groups, only Occupation fell in both share and performance. Also, Services now has 7 groups performing at 120+%, up from 6 in 2022. Overall, in 2023 Services spending became less demographically balanced.

Now, we’ll look at 2023’s best and worst performing Pet Services spending segments in each category.

Except for CU Comp & Size, the best & worst performers are not a surprise. There are 4 that are different from 2022, all in the best group, 1 more than last year. CU Comp & Size show the move towards “family” CUs. Income is a big factor for almost all categories. Gen X is still on top, but spending shifted towards their oldest members, 55>64.(and young Boomers) The average difference between Best & Worst is 111.8%, the highest of any segment and up from 100.3% in 2022. Pet Services spending became less balanced in 2023. Changes from 2022 are “boxed”. We should note:

  • Income is even more important to Pet Services. 314.7% is the highest performance by any group in any segment.
  • # Earners – 2 Earners returned to the top but No Earner, Singles stayed on the bottom.
  • Age – 55>64 is a mixture of the oldest Gen Xers & youngest Boomers. They have the 3rd highest income. All groups from 35>64 performed at 100+%. The lowest performers were at both ends of the age spectrum.
  • CU Composition – Married, Oldest child 6>17, the 2021 winner, returned to the top while Single Parents remain firmly entrenched at the bottom.
  • CU Size – The key is having 2 or more people in the CU. 4 People is the current leader but all 2+ CUs perform above 100%. 1 Person CUs Services’ performance is 61.4%.
  • Generation – Gen X retained the Top Spot and Gen Z stayed at the bottom. Both Boomers and Millennials earned their share with 100+% performance. Born <1946 was next to last with 39.1%.

In Pet Services spending performance, income is still the major factor. Spending began skewing younger in 2018. They slipped a little in 2019, but they basically held their ground during the 2020 pandemic. In 2021, Boomers, Millennials and the younger Gen Xers got on board. In 2022 & 2023, spending skewed towards the older Gen Xers.

It’s time to “Show you the money”. Here are segments with the biggest $ changes in Pet Services Spending.

In this chart you immediately see the difference from last year. In 2023 you see a little less stability. There were 7 repeats. In 2022 there were 13. Also, 2 segments flipped from 1st to last or vice versa. In 2022 there were no flips. While 2021 & 2022 had record increases, the lift in 2023 was only $1.05B, +8.5% and less widespread. In 2 categories all segments spent more compared to 9 in 2022. Also, 75% of 96 demographic segments spent more, down from 93% in 2022. Another thing is definitely worse. The biggest drop was -$0.58B. In 2022 it was only -$0.12B.

Here are the specifics:

  • Housing – Both winner and loser are the same as 2022.
    • Winner – Homeowner w/Mtge – Services: $8.23B; Up $1.23B (+17.5%)                                  2022: Homeowner w/Mtge
    • Loser – Renter – Services: $2.08B; Down $0.29B (-12.3%)                                                            2022: Renter
    • Comment – Homeowners w/o Mtges were up $0.12B, +4.0%.
  • Income – $200K> won again but $70>99K replaced $30>39K at the bottom.
    • Winner – $200K> – Pet Services Spending: $4.82B; Up $1.16B (+31.8%)                                   2022: $200K>
    • Loser – $70 to $99K – Pet Services Spending: $1.24B; Down $0.43B (-25.8%)                           2022: $30 to $39K
    • Comment – Only $50>69K, $100>149K & $200K> spent more, but their lifts were substantial, totaling $1.95B. This more than made up for the total drop by the other groups, -$0.90B.
  • Area Type – Suburbs 2500> stayed on top while Rural replaced Center City at the bottom.
    • Winner – Suburbs 2500> – Pet Services Spending: $6.62B; Up $0.90B (+15.7%)                    2022: Suburbs 2500>
    • Loser – Rural – Pet Services Spending: $2.79B; Up $0.04B (+1.5%)                                             2022: Center City
    • Comment – Center City was +2.9% & Rural was +1.5%. All spent more but the Suburbs drove the lift.
  • Race/Ethnic – White, Not Hispanic stayed on top while Hispanics replaced Asians at the bottom.
    • Winner – White, Not Hispanic – Services: $11.30B; Up $0.80B (+7.6%)                                  2022: White, Not Hispanic
    • Loser – Hispanic – Services: $0.92B; Down $0.19B (-16.8%)                                                       2022: Asian
    • Comment– Asian were +$0.29B & African Americans were + $0.15B so Minorities were up $0.26B, +13.7%.
  • Generation – Gen X replaced Boomers on top and Born <1946 replaced Gen Z at the bottom.
    • Winner – Gen X – Services: $4.78B; Up $0.79B (+19.8%)                                                                 2022: Baby Boomers
    • Loser – Born <1946 – Services: $0.44B; Down $0.17B (-28.0%)                                                      2022: Gen Z
    • Comment – In 2022, all generations spent more. In 2023, only Born <1946 spent less. Millennials finished in second place with a $0.29B, +8.7% increase.
  • Age – Both winner and loser are new.
    • Winner – 55>64 yrs – Pet Services Spending: $3.22B; Up $0.68B (+26.5%)                               2022: 65>74 yrs
    • Loser – 25>34 yrs – Pet Services Spending: $1.65B; Down $0.18B (-9.6%)                                   2022: <25 yrs
    • Comment: In 2022 only the <25 group spent less. In 2023, 25>34 & 65>74 had drops. The lift continues to skew a little older, up to 64 but it was actually pretty balanced between the 3 groups from 35>64. They dominate Services spending, 64.7% of the total. Their 22>23 lift was +$1.27B. That’s 121% of the $1.05B lift in Services.
  • # Earners– 2 Earners held their spot at the top while No Earner, Singles replaced No Earner, 2+ CUs at the bottom.
    • Winner – 2 Earners – Pet Services Spending: $6.15B; Up $0.66B (+12.0%)                                2022: 2 Earners
    • Loser – No Earner, Single – Pet Services Spending: $0.60B; Down $0.05B (-7.7%)                   2022: No Earner, 2+ CU
    • Comment – Only No Earner, Singles spent less, but the biggest % lift was from No Earner, 2+ CUs, +26.9%
  • Region – Northeast flipped from last to 1st and the South replaced them at the bottom.
    • Winner – Northeast – Pet Services Spending: $2.53B; Up $0.63B (+33.0%)                               2022: Midwest
    • Loser – South – Pet Services Spending: $3.87B; Down $0.01B (-0.3%)                                          2022: Northeast
    • Comment – In 2021 & 2022, all spent more. In 2023 only the South spent less, and it was a minuscule drop.
  • Education – BA/BS replaced Adv. College Degree on top. Assoc Degree replaced HS Grads at the bottom.
    • Winner – BA/BS Degree – Pet Services Spending: $4.47B; Up $0.61B (+15.9%)                        2022: Adv. College Degree
    • Loser – Associate’s Degree – Services Spending: $0.93B; Down $0.58B (-38.3%)                     2022: HS Grads
    • Comment – Associate’s degree had the only decrease. The drop was not unexpected as they more than doubled their spending in 2022, +116%. College Grads have 47.8% of CUs but generated 107.1% of the increase.
  • CU Composition – Married, Couple Only stayed on top. Unmarried, 2+ Adults replaced Single Parents at the bottom.
    • Winner – Married, Couple Only – Services: $4.31B; Up $0.51B (+13.5%)                                  2022: Married, Couple Only
    • Loser – Unmarried, 2+ Adults – Services: $1.60B; Down $0.17B (-9.4%)                                    2022: Single Parents
    • Comment – Single Parents also spent less. All Married CUs had double digit % increases. The biggest % lift was by Married, Oldest Child <6, +29.7%. In 2022, they were the only segment that spent less on Services.
  • Occupation – Both winner and loser are new.
    • Winner–– Retired – Pet Services Spending: $2.34B; Up $0.50B (+26.9%)                                    2022: Mgrs & Profess.
    • Loser – Tech/Sales/Clerical – Pet Services Spending: $1.48B; Down $0.08B (-5.0%)                 2022: Blue Collar
    • Comment – Service Workers also spent a little less, -$0.02B. The biggest surprise was that All Other, Unemployed had the 2nd biggest $ lift and the highest % increase, +$0.26B (+45.9%).
  • # in CU – 5+ People flipped from last to first and 1 person replaced them at the bottom.
    • Winner – 5+ People – Pet Services Spending: $1.36B; Up $0.36B (+35.4%)                                 2022: 2 People
    • Loser – 1 Person – Pet Services Spending: $2.49B; Up $0.02B (+0.7%)                                          2022: 5+ People
    • Comment: All segments spent more. The biggest lifts were from CUs with 3 or more people.

We’ve seen the winners and losers in terms of change in Services Spending $ for 12 Demographic Categories. The growth slowed after 2 record lifts but was still widespread. Here’s some data which shows the evolution from 2019 to 2023. Services were hit hard by the pandemic but recovered stronger than ever with 2 record lifts. In 2023 the situation has become more “normal” but is markedly better than pre-pandemic 2019.

Total $:                   2019: $8.62B      2020: $8.69B     2021: $9.10B     2022: $12.36B      2023: $13.42B

% Segmts $:        2019: 49%          2020: 21%          2021: 90%          2022: 93%             2023: 75%

Avg Big $:            2019: $0.25B     2020: $0.05B     2021: $1.10B      2022: $1.43B        2023: $0.73B

Avg Big $:            2019: -$0.27B    2020: -$0.89B    2021: $0.07B      2022: $0.16B        2023: -$0.16B

We found the winners in performance and $, but there were others who performed well but didn’t win. They deserve…

HONORABLE MENTION

Services is the most driven by high income. The performance of the low-income segments in this group gives evidence that Service usage is becoming more widespread. < HS Grads more than doubled their spending. The $50>69K group was up 48.9%. Blue Collar Workers and No Earner, 2+ People CUs had lifts over 25%. The other 2 segments tell a different story. Asians have the highest income but lowest % of Pet ownership. That may be changing as they doubled their Services spending. Married, with an oldest child <6 also have a higher income, but their expenditures are high, 31% above average. This increases their financial pressure. Pet Services prices are high, but they are a great benefit, so more demographics are finding the $ to spend.

Summary

For years, Services’ spending slowly but steadily increased. However, the number of outlets offering Services was radically increasing. In 2017, this competitive pressure caused Pet Parents to shop for value and spending fell 1%. In 2018, the abundance of outlets and competitive prices finally had their intended impact. Many more consumers took advantage of the convenience of Pet Services and spending literally took off with a record increase to a new all-time spending high. In 2019 Consumers held their ground at the new higher level but we saw turmoil similar to 2017. Again, value shopping likely contributed to the small decrease.

In 2020, pandemic Services outlets were often deemed nonessential, so they were subject to restrictions and closures. Services are definitely needed by some groups. However, for most demographics, Services are a convenience, and spending is very discretionary in nature. The reduced availability and the pandemic driven focus on the “needed” segments – Food and Veterinary caused a 20% drop in Services $.

In 2021 the Retail Marketplace opened up again and many Pet Parents strongly returned to their previous Services mantra, “I need help with my Pet “children” and I have the money to pay for it!”. This behavior was widespread as 90% of all demographics spent more on Services, producing a record increase. In 2022 Services showed that it was different from other segments. All had record lifts related to the Pandemic followed by drops, except for Services. 2022 spending didn’t decrease, it grew even stronger, +$3.26B and more widespread as 93% of demographics increased spending. That brings us to 2023. Growth continued, but slowed considerably, +$1.05B (+8.5%). The lift was also less widespread as 75% of CUs spent more. That’s still very good. There was 1 definite negative in 2023. Services is the segment where spending is the most driven by income, so it has always had a big disparity between segments. This improved slightly in 2022 but definitely worsened in 2023. Performance differences are a key measurement of disparity. Let’s consider the performance of the big groups. There were 7 categories with a 120+% performing big group, up 1 from 2022, and now 1 more than Supplies (6), 2 more than Veterinary (5) and 4 more than Food (3). There is an even better measure of the worsening. In 2023, the average difference between best & worst performers was 111.8%. In 2022 it was only 100.3%.

Another key trend in 2023 was that 35>64 is still the dominant group, but spending continues to skew older.

Services were hit the hardest by the pandemic, but they had a record, widespread recovery in 2021>22. They are the segment most driven by high income so the high  inflation in 2022>23 had less of an impact. It did affect the spending of some financially challenged groups, but in 2023, Services spending seems to have returned to a more normal pattern.

At Last – The “Ultimate” Pet Services Spending Consumer Unit consists of 4 people – a married couple with children. Their oldest child, still at home, is <18. They are 55>64 yrs-old and White, but not of Hispanic origin. They both work and at least one of them has an Advanced College Degree and is a Manager or Professional. They have an income of over $200K. They live in a small suburb in the Western U.S. and are still paying off their home mortgage.


2023 Pet Supplies Spending was $23.02B – Where did it come from…?

Next, we’ll turn our attention to Pets & Supplies. We’ll see differences from Pet Food as the spending in the Supplies segment is more discretionary. There are other factors too. Spending can be affected by the spending in other segments as consumers often trade $ between segments. However, the biggest factor is price. Many categories have become commoditized so price changes can impact buying behavior. In the 2nd half of 2016, deflation began, and Supplies started a 24 month lift, totaling $5B. Prices turned up in mid-2018 due to new tariffs and Supplies $ fell a record -$3B in 2019. In the 2020 pandemic, Supplies weren’t a necessity, so sales dropped -$1.7B. In 2021, Pet Parents caught up with their children’s needs and Supplies spending exploded, +$8.65B. In 2022, the “binge” was not repeated, and inflation was 7.7%. Spending fell -$1.86B. In 2023, inflation fell to 2.6% and Supplies $ grew $1.08B, 4.9% to $23.02B.

Let’s see which groups were most responsible for the bulk of Pet Supplies spending in 2023 and the $1.08B lift. The first chart details the biggest pet supplies spenders for each of 10 demographic categories. It shows their share of CU’s, share of Supplies spending and their spending performance (Share of spending/share of CU’s). 2 groups are different from Total Pet – Age & Education. The groups are presented in the order that reflects their share of Total Pet Spending. This highlights the differences in share. The biggest difference is in performance. There are 6 groups with performance of 120% or more, down from 7 in 2022, but 1 more than Total Pet and 3 more than Pet Food. The drop from 2022 indicates that Supplies spending became slightly more balanced in terms of the big groups in 2023.

  1. Race/Ethnic – White, not Hispanic (83.6%) up from 81.5%. This large group accounts for the vast majority of spending in every segment. Their share increased and their performance grew from 121.2% to 125.9% and they moved up from #4 to #3 in importance in spending. Minority groups account for 33.7% of all CUs but spend only 16.4% of Supplies $. Only African Americans spent less but the lifts by Hispanics & Asians were under 1%.
  2. # in CU – 2+ people (81.1%) down from 83.3% and their performance fell from 120.8% to 116.2% – Out of 120% Club. 2 & 4 People CUs spent less while 1 Person CUs were +18.6%. This caused the drops in share & performance.
  3. Housing – Homeowners (78.4%) down from 78.8%. Homeownership is a big factor in pet ownership and spending in all segments. Their performance fell to 120.4%, from 121.0% but they stayed #5 in importance. All segments spent more but the w/o Mtge lift was only +0.5%. Renters led with +6.5%. This caused the small drops.
  4. Age – 35>64 (61.9%) up from 61.8%. Their performance level rose to 118.8% from 118.6% and moved up from #8 to #7 in importance. Only the 25>34, 55>64 and 75+ yr-old groups spent less. All others spent more. However, most lifts were small. Only <25 (+63.1%) and 45>54 (+18.6%) had double digit % growth. The result of this mixture of spending was the miniscule increase in group share and performance.
  5. Area – Suburban & Rural (72.5%) up from 70.3% and their performance grew to 110.7%, from 107.3%, but they stayed last in importance. In this category, only Center City spent less, -2.8%. The big Suburbs, over 2500 population only had a 0.9% lift. This was a bit of a surprise after their -$2.74B drop in 2022. The action was in the Rural areas. They were +$1.16B (+20.6%). The gains in share and performance were due to Rural spendng.
  6. Income Over $70K (72.1%) up from (71.0%) A gain in share but their Performance fell from 150.2% to 142.7%. Income remains the most important factor in increased Pet Supplies Spending. Both <$70K and $70K> spent more. However, the lift for $70K> was $1.01B while <$70K was only $0.07B. Only 3 segments spent less – <$30K (-$0.07B), $40>49K (-$0.18B) & $100>149K (-$0.15B). Almost all of the lift came from $70K>. A key factor in the increase in share but drop in performance was that $70K> gained 4.5 million CUs. This gain in CU share lowered performance.
  7. # Earners – “Everyone Works” (71.4%) up from 69.7%. Their performance grew from 119.5% to 121.8% and they moved up from #7 to #4 in importance and joined the 120% club. In this group, all adults in the CU work. The # Earners is more important than in Food but it is income that truly matters. In the group, only 2 Earners spent less, but 1 Earner, Singles were +$0.98B. They were the primary driver in the increase in share and performance.
  8. Occupation – All Wage & Salary Earners (69.3%) up from 68.7%. Their performance was 113.8%, down from 114.0%. Only Tech/Sls/Cler & Self-Employed spent more. Tech/Sls/Cler was up +$1.55B. This drove the lift in share. Performance dropped in the group because they had a 1.1 million increase in CUs.
  9. CU Composition – Married Couples (61.3%) up from 60.7%. Their performance also increased from 127.1% to 127.2% but they stayed 2nd in importance. Only Married, Oldest Child <6 or 18> had decreases. The Married group was +0.78B, +5.9%. The “Unmarried” group was only +$0.3B, +3.5%. This resulted in the small increases in share and performance for all Married CUs.
  10. Education – Associate’s Degree> (70.0%) down from 72.0%. This group was expanded to reach a 60+% share. In 2023, they lost market share and their performance level also decreased from 124.8% to 120.0%. Higher Education fell from 3rd to 6th in importance. In the Education category, the only spending decreases were by HS Grads and those with an Adv. College Degree. There were big lifts by HS Grads w/some College & <HS Grads. The BA/BS group couldn’t keep up so <College were +$0.92B, +10.1% & College Grads were +$0.15, +1.2%. This caused the drops.

Pet Supplies spending still skews more towards younger and higher income CUs than Food. However, the biggest difference may be in the spending disparity in segments within the big groups. Supplies now has 6 big groups with perfomance of at least 120%. That’s down from 7 in 2022, but it’s twice as many as the 3 in Pet Food.

Now, we’ll look at 2023’s best and worst performing Pet Supplies spending segments in each category.

Almost all of the best and worst performers are those that we would expect. There are truly no big surprises. In Pet Supplies spending, there are 8 that are different from 2022, up from 5 last year. That is 1 less than Veterinary & 3 less than Food, but 1 more than Total Pet and 4 more than Services. They have 5 new winners. With 6, only Food has more. In terms of disparity, the difference between the avg winner & loser was 95.4%, up from 87.5% in 2022 but stlll less than 123.6% in 2021. A little less balanced at the segment level. Changes from 2021 are “boxed”. We should note:

  • Income matters in Supplies spending – 220.8% performance and a disparity of 180.9%.
  • Occupation – Self-Employed replaced Managers. Only White Collar Workers – at any level, perform at 100+%.
  • Education – Both are new, but not a big change from Adv College Degree & <HS Grads.
  • Region – The Midwest replaced the West at the top and the South returned to their usual spot at the bottom. The South is the only Regon with under 100% performance. The disparity grew to 60% from 41% in 2022.
  • CU Composition – Married, Oldest Child 6>17 returned to the top while Single Parents replaced Singles at the bottom. In 2023, all Married CUs, except those with an oldest child <6, performed over 100%.
  • CU Size – 3 People CUs replaced 5+ People at the top. 1 Person CUs are the only size performing <100%.

Performance Overview – While the increase in the average performance disparity was small, 95.4% from 87.5%, it was widespread – 10 of 12 categories. Only Occupation & CU Size had less disparity between segments.

Now, it’s time to “Show you the money”. Here are segments with the biggest $ changes in Pet Supplies Spending.

In 2019, Tarifflation caused a record $2.98B drop in Supplies spending. 2020 brought the pandemic and pet parents focused on “needs” so the more discretionary Supplies segment fell another $1.65B. In 2021 Pet Parents caught up on  the Supplies needed by their “children” and spent a record $8.65B more. In 2022, the binge wasn’t repeated so the $ fell -$1.86B. In 2023 there was a small $1.08B lift. In the chart, there are 5 repeats from 2022 and 9 segments flipped from last to 1st  or vice versa. In 2022 there was 1 repeat and 15 flips. In 2023, 65.6% of segments spent more (with inflation 54.2%) and Housing was all positive. In 22, only 52% spent more and no category was all positive. Here are the specifics:

  • Occupation – Tech/Sls/Clerical flipped from last to 1st and Blue Collar replaced them at the bottom.
    • Winner – Tech/Sales/Clerical– Supplies Spending: $4.37B; Up +$1.55B (+54.8%)                                             2022: Mgrs/Profess.
    • Loser – Blue Collar – Supplies Spending: $1.02B; Down -$0.38B (-27.0%)                                                           2022: Tech/Sls/Cler.
    • Comment – Only Tech/Sls/Cler & Self-Employed spent more in 2023. Managers & Professionals are the only segment that spent more every year 2020>22. Even their spending fell -2.7% in 2023. Except for Blue Collar, all of the drops in spending were small, less than -4.5%.
  • Race/Ethnic – White, Not Hispanic and African Americans swapped positions at the top and bottom.
    • Winner – White, Not Hispanic – Supplies: $19.24B; Up +$1.36B (+7.6%)                                                   2022: African Americans
    • Loser – African Americans – Supplies: $0.97B; Down -$0.31B (-23.9%)                                                      2022: White, Not Hispanic
    • Comment – Their share of Pet Supplies $ rebounded to 83.3% from the 81.1% low in 2022. White, Not Hispanics still drive this discretionary segment. They have the highest % of pet ownership and the second highest income. The interaction of these two factors is very apparent in this category. Only African Americans spent less but the gains by Hispanics and Asians were <$0.02B. Whites produced 126% of the Supplies lift.
  • Area Type– Center City flipped from 1st to last and Rural replaced them on top.
    • Winner – Rural – Pet Supplies Spending: $6.76B; Up +$1.17B (+20.9%)                                                        2022: Center City
    • Loser – Center City – Pet Supplies Spending: $6.33B; Down -$0.18B (-2.8%)                                               2022: Suburbs 2500>
    • Comment– Only Center City spent less but the Suburbs 2500> only spent $0.09B more. Rural (Areas <2500 Population) drove the Supplies spending lift.
  • Region – The South flipped from 1st to last and the Northeast replaced them on top.
    • Winner – Northeast – Pet Supplies Spending: $4.07B; Up $1.11B (+37.2%)                                                  2022: South
    • Loser – South – Pet Supplies Spending: $6.99B; Down -$0.65B (-8.5%)                                                         2022: West
    • Comment – Like 2022, 2 spent more & 2 spent less. In 2022, the South & Midwest spent $1B more. In 2023, the Midwest again spent $1B more but they were joined by the Northeast. The West spent less in both years.
  • # Earners – 2 Earners stayed on the bottom but a new 1 Earner winner – Singles.
    • Winner – 1 Earner, Single – Pet Supplies Spending: $3.37B; Up +$0.98B (+41.0%)                                   2022: 1 Earner, 2+ CU
    • Loser – 2 Earners – Pet Supplies Spending: $9.22B; Down -$0.40B (-4.2%)                                                 2022: 2 Earners
    • Comment – Income is the biggest factor, but the # of Earners is still important in Supplies Spending. The ups & downs were mixed with no clear pattern. 1 Earner, Singles, No Earner, 2+ CU and 3+ Earners spent more. No Earner, Singles, 1 Earner, 2+ CU and 2 Earners spent less. Most drops were small while all lifts were 17+%.
  • Age – 45>54 stayed on top while the older 55>64 replaced 35>44 on the bottom.
    • Winner – 45>54 yrs – Pet Supplies Spending: $5.41B; Up $0.84B (+18.3%)                                                   2022: 45>54 yrs
    • Loser – 55>64 yrs – Pet Supplies Spending: $4.39B; Down -$0.26B (-5.6%)                                                    2022: 35>44 yrs
    • Comment: 2023 Supplies spending was an age rollercoaster. <25: +$0.40B; 25>34: -$0.17B; 35>54: +$0.95B; 55>64: -$0.26B; 65>74: +$0.25B; 75>: -$0.09B.
  • # in CU – 3 People stayed on top. 4 People replaced 5+ on the bottom.
    • Winner – 3 People – Pet Supplies Spending: $4.49B; Up $0.78B (+21.1%)                                                      2022: 3 People
    • Loser – 4 People – Pet Supplies Spending: $2.86B; Down -$0.47B (-14.0%)                                                   2022: 5+ People
    • Comment: 3 People CUs were the only size to spend more in 2022. In 2023, 1 and 5+ CUs also spent more. Only 2 and 4 People CUs spent less.
  • Housing – The winner and loser flipped positions.
    • Winner – Homeowner w/Mtge – Supplies: $12.44B; Up +$0.74B (+6.3%)                                           2022: Homeowner w/o Mtge
    • Loser – Homeowner w/o Mtge – Supplies: $5.60B; Up +$0.03B (+0.5%)                                             2022: Homeowner w/Mtge
    • Comment – All Housing segments spent more but all of the lifts were small. Renters finished second In $, +$0.34B but they had the biggest percentage increase, +6.8%.
  • CU Composition – Married, Oldest Child 18> flipped from 1st to last. Singles replaced them on top.
    • Winner – Singles – Supplies: $4.34B; Up $0.68B (+18.6%)                                                               2022: Married, Oldest Child 18>
    • Loser – Married, Oldest Child 18> – Supplies: $2.44B; Down $0.49B (-16.6%)                            2022: Married, Oldest Child 6>17
    • Comment – CUs with children spent -$0.06B less due to drops by Single Parents and Married couples with an oldest child under 6 or over 18. CUs with no children were +$1.14B.
  • Generation – Gen X flipped from last to 1st. Boomers replaced them on the bottom.
    • Winner – Gen X – Supplies: $7.71B; Up $0.67B (+9.5%)                                                                       2022: Gen Z
    • Loser – Boomers – Supplies: $6.50B; Down -$0.30B (-4.3%)                                                               2022: Gen X
    • Comment – Only Boomers and those born <1946 spent less. The younger groups – Gen X, Millennials and Gen Z spent more. Gen Z’s lift was only -$0.02B behind Gen X but the percentage was much bigger, +74.9%.
  • Income – $150>199K stayed on top and $40>49K replaced $200K> on the bottom.
    • Winner – $150>199K – Pet Supplies Spending: $4.24B; Up +$0.61B (+16.7%)                                 2022: $150>199k                     
    • Loser – $40>49K – Pet Supplies Spending: $1.06B; Down -$0.18B (-14.6%)                                      2022: $200K>
    • Comment – All big groups <$70K, $70K>, <$100K and $100K> spent more. There were only 3 segments that spent less – <$30K, $40>49K and $100>149K. Except for $40>49K, the drops were -3.4% or less. While all big groups spent more, $150K> provided $1.0B (92.6%) of the Supplies lift.
  • Education – Adv College Degrees stayed on the bottom while HS Grads w/some College replaced Associate’s on top.
    • Winner – HS Grad w/some College – Supp. Spending: $4.05B; Up +$0.58B (+16.6%)                         2022: Associate’s Degree
    • Loser – Adv. College Degree – Supplies Spending: $5.60B; Down $0.25B (-4.3%)                                 2022: Adv College Degree
    • Comment – HS Grads also spent less but the group w/o at least a BA/BS degree spent $0.92B more. This was 85.2% of the Total Supplies lift and certainly an unexpected pattern.

We’ve now seen the winners and losers in Pet Supplies Spending $ for 12 Demographic Categories. In 2022, despite the -$1.86B decrease, 52% of demographic segments spent more but there was no all-positive category.  In 2023, there was a small lift, $1.08B, 66% of demographics spent more (54% with inflation) and Area Type was all positive. Overall, 2023 had less turmoil than 2022. In performance, there were no surprises but the disparity between winner and loser increased by 8%. The performance winners reflected the importance of income in Supplies spending. However, not every good performer can be “the” winner and some of these “hidden” segments should be recognized for their performance. They don’t win an award, but they deserve…

HONORABLE MENTION

Supplies spending is driven by income, but Pet Parenting is widespread. This is very apparent in the strong performance of these segments. All have below average incomes, with many at or near the bottom in their category. The 100>250K Small City group is a low Total Pet spender but perform above 100% in Supplies. Gen Z’s surge in commitment to their Pets continues. In recent years, the <HS Grad group has significantly increased pet spending. In 2023 they turned their attention to Supplies. No Earner, 2+ CUs turned their attention to Pets with big spending lifts in all segments. 2023 was a great “Pet” year for Singles. They also had lifts in all industry segments. The $30>39K group had double digit lifts in all but Services. This clearly demonstrates that while income may be the most important, it is not the only factor in Supplies spending. Although the lift was small, it was demographically widespread.

Summary

While Pet Food spending has shown a definite pattern, Pet Supplies have been on a roller coaster ride since 2009. Many Supplies categories have become commoditized and react strongly to changes in the CPI. Prices go up and spending goes down…and vice versa. Supplies spending has also been reactive to big spending changes in Food. Consumers spend more to upgrade their Food, so they spend less on Supplies – trading dollars. We saw this in 2015. In 2016 the situation reversed. Consumers value shopped for Food and spent some of the “saved” money on Supplies.

That brought us to 2017. Both Supplies and Food prices deflated while the inflation rate in both of the Services segments dropped to lows not seen in recent years. Value was the “word” and it was available across the market. Perhaps the biggest impact was that the upgrade to super premium Food significantly penetrated the market. This could have negatively impacted Supplies Spending, but it didn’t. Supplies’ spending increased in 93% of all demographic segments.

2018 started out as expected with a $1B increase in Supplies and a small lift in Food. Then the government got involved. In July the FDA issued a warning on grain free dog food and spending dropped over $2B. New tariffs were implemented on Supplies and spending flattened out then turned down -$0.01B in the 2nd half. The full retail impact of Tariffs hit home in 2019 when Supplies spending fell -$2.98B, affecting 97% of all demographic segments.

In 2020 The pandemic caused consumers to focus on needs. That resulted in big spending lifts for Food and Veterinary and big drops in Supplies and Services. Some good news was that Supplies spending became more balanced. The performance gap between best and worst narrowed by 10.25%.

In 2021 the overall Retail Market had recovered but with no repeat  of the buying binge, Pet Food $ dropped. In Supplies, the pent-up buying desires of Pet Parents were unleashed. They bought all the Supplies items that had been on “hold” for the last 2 years. The result was the biggest spending increase in history.  In 2022, the Supplies binge was also not repeated, and inflation took off, so spending fell -$1.86B. However, 52% segments still spent more on Supplies.

In 2023, inflation slowed and Supplies had a small $1.08B, 4.9% lift. 65.6% of segments spent more (54.2% with inflation) and the Housing category was all positive. At the Big Group level things were slightly more balanced with 6 performing at 120+%. (Down from 7) At the segment level, it was different. The 50/50 income spending divide increased from $114K to $117K and the disparity between the Best and Worst performers increased to 95.4% from 87.5%. The 2023 results are mixed but the recovery from the 2022 drop is under way. Ytd in 2024 inflation was only 0.7%. We’ll see what happens.

Finally – The “Ultimate” Pet Supplies Spending CU consists of 3 people – a married couple, with a child under 18. They are 45>54 yrs old. They are White, but not of Hispanic origin. They have their own business where they both work and at least one has a Associate’s Degree. Their child also works – part time and their household income is $150>199K. They live in a small suburb in the Midwest and are still paying off the mortgage on their home.