2022 Pet Services Spending was $12.36B – Where did it come from…?
Next, we will look at Pet Services. It is still by far the smallest Segment, but like Supplies and Veterinary, it had a record increase in 2021. However, unlike them, there was no $ drop in 2022. The lift grew stronger, up $3.26 (+35.8%). After the great recession, Services’ annual spending slowly but steadily increased. During this time, the number of outlets offering Services strongly grew as brick ‘n mortar retailers looked for a way to combat the growing influence of online outlets. After all, you can buy products, but you can’t get your dog groomed on the Internet. This created a highly price competitive market for Pet Services. In 2017 there was a slight increase in visit frequency, but Pet Parents just paid less. This resulted in a 1.0% decrease in Services spending. In 2018 consumer behavior changed as a significant number decided to take advantage of the increased availability and convenience of Pet Services and spending literally took off, +$1.95B (+28.9%), the biggest increase in history. In 2019 Pet Parents, especially the younger ones, value shopped, and spending turned down $0.10B. In the 2020 pandemic Services outlets were often deemed nonessential and were subject to restrictions and closures which drove a huge drop in $. In 2021 things opened up again and Pet Parents came back to Services generating the biggest $ increase ever. The trend didn’t end in 2022. It accelerated with a new record increase.
Services spending is the most discretionary, but its reach is expanding. Let’s look deeper into the demographics.
Let’s start by identifying the groups most responsible for the bulk of Services spending in 2022 and the $3.26B increase. The first chart details the biggest Pet Services spenders for each of 10 demographic categories. It shows their share of CU’s, share of Services spending and their spending performance (Share of spending/share of CU’s). In order to better target the bulk of the spending we had to alter the groups in 3 categories – income, area & education. The performance level should also be noted as 6 of 10 groups have a performance level above 120%. This is 1 less than 2021 but the 2nd most for any segment only behind Supplies with 7. Veterinary and Total Pet have 5 and Food has only 4. This indicates that the disparity between the best and worst performing segments shrank a little in 2022, but it is still the highest of any segment. Income is still the biggest factor in Services Spending. The categories are presented in the order that reflects their share of Total Pet $ which highlights the differences of the 7 matching groups. For Services, the share ranking differences from Total Pet are small. The # of Earners and Occupation are more important in Services.
- Race/Ethnic – White, not Hispanic (84.9%) up from 84.6%. This big group accounts for most of the spending in all segments. Their performance grew from 125.9% to 126.3% and they moved up from 5th to 4th place in importance. All groups spent more. The Hispanics’ increase was below average which produced the gains in share & performance
- Housing – Homeowners (80.8%) up from 80.5%. Homeownership is a big factor in spending in all industry segments. Their performance fell from 124.5% to 124.1% but they moved up from #6 to #5 in importance. All segments spent more. Homeowners gained share because of more CUs. This and a big % lift by Renters made Performance drop.
- # in CU – 2+ people (80.0%) down from 82.2% Their performance also decreased from 118.3% to 116.0% but they moved up from #8 to #7 in importance. All sizes spent more. The drop in share and performance is due to a spectacular 52.5% increase by Singles while spending for 5+ CUs grew only +0.1%.
- Area – City/Suburbs >2500 (77.8%) down from 80.0% in share, and performance fell from 98.1% to 96.2%. Again they are the only group not earning its share of $pending. Services is an Urban Segment. All Areas spent more but Suburbs had the biggest lift, +$1.48B. Center City “lost” with a $0.83B, 27.1% increase. Areas <2500 were +53.1%.
- Education – College Grads (69.8%) down from 71.7%. Income generally increases with education so Services spending grows with increasing education. Performance fell from 151.5% to 149.3% but education stayed #2 in importance. Only HS Grads spent less but the <College group was +45.3% while College Grads were only +32.1%.
- Income – $100K> (64.2%) up from 63.3% This group’s performance rating is 193.6%, down from 211.4%. CU income is still by far the most important factor in increased Pet Services Spending. Only the $30>39K and $50> 69K income groups spent less, They gained in share but their performance fell. The biggest factor in this situation was a change in CU count. The number of CUs <$100K fell -4.2% while those $100K> increased by 11.1%.
- # Earners – “Everyone Works” (72.2%) down from 72.8%. All adults in the CU are employed. Income is important so a high market share is expected. Their performance dropped to 123.7% from 128.3% and they fell from #4 to #6 in importance. All CUs, with or without Earners spent more. Spending became slightly more balanced but again the big change was in # of CUs. The Everyone Works group grew by 2.5 million CUs causing the big performance drop.
- Occupation– All Wage & Salaried (70.3%) up from 67.6% and their performance rating increased from 114.0% to 116.5%. – #9 to #8. Only All Other/Unemployed spent less on Services in 2022. Managers & Professionals had the biggest increase, +$1.75B (+46.0%). Tech/Sls/Cler were up 25.7% but all other segments were up at least 38.9%. Spending within the group became a little more balanced. The Wage and Salary group had a 1.6 million increase in CUs which increased share but slowed the performance lift.
- CU Composition – Married Couples (63.6%) up from 63.3%. Married couples are a big share of $ and have 127+% performance in all segments. Their performance fell slightly to 133.1% from 133.6% but they stayed #3 in importance in Services spending. All CU types spent more. The biggest $ increase came from Married Couple Only, +$1.18B. The performance of the Married group fell because of a $0.85B, 52.5% increase by Singles.
- Age – 35>64 (60.0%) down from 63.9%. Their performance fell from 122.0% to 115.0%. They dropped out of the 120+% club and fell to 9th in importance. Only <25 spent less. 35>64 was up $1.60B, +27.5%. The other age groups spent $1.66B more, +50.6%. This produced the drop in share and the big decrease in performance.
We changed 3 of the groups for Services – Income, Area & Education, to better target the biggest spenders. We should also note that Income is still more important to spending in Services than in any other segment. Only Race/Ethnic and Occupation gained in both share and performance. Also, Services now has 6 groups performing at 120+%, down from 7 in 2021. Overall, in 2022 Services spending became slightly more demographically balanced.
Now, we’ll look at 2022’s best and worst performing Pet Services spending segments in each category.

Except for Area, the best & worst performers are not a surprise. There are 3 that are different from 2021, all in the best group, 7 less than last year. Area shows the continued move away from high population. Income is a big factor for almost all categories. Gen X is still on top, but spending shifted towards their older members, 45>54. The average difference between Best & Worst is 100.3%, the highest of any segment. However, it is better than 108.5% in 2021. Pet Services spending became slightly more balanced in 2022. Changes from 2021 are “boxed”. We should note:
- Income is even more important to Pet Services. The $200K> group has its best performance in this segment.
- # Earners – 3+ Earners replaced 2 Earners on top but No Earner, Singles stayed on the bottom. No Surprises.
- Age – 45>54 is all Gen X and the highest income group. All groups from 35>74 performed at 100+%. 25>34 was close at 94.6%. The lowest performers were at both ends of the age spectrum.
- Area – Services $ are still skewed towards population density. However, the performance of Rural areas has tripled from 2019 and Center City has been below 100% for 3 straight years.
- CU Composition – Married, Couple Only barely edged out last year’s winner Married, Oldest child 6>17 – 142.8% to 142.5%. This was basically a tie. Single Parents remain firmly entrenched at the bottom.
- Generation – Gen X retained the Top Spot and Gen Z stayed at the bottom. Both Boomers and Millennials earned their share with 103.6% performance. Born <1946 was next to last with 54.5%.
In Pet Services spending performance, income is still the major factor. Spending began skewing younger in 2018. They slipped a little in 2019 but they basically held their ground during the 2020 pandemic. In 2021, Boomers, Millennials and the younger Gen Xers got on board. In 2022, spending skewed a little towards the older Gen Xers – 45>54.
It’s time to “Show you the money”. Here are segments with the biggest $ changes in Pet Services Spending.
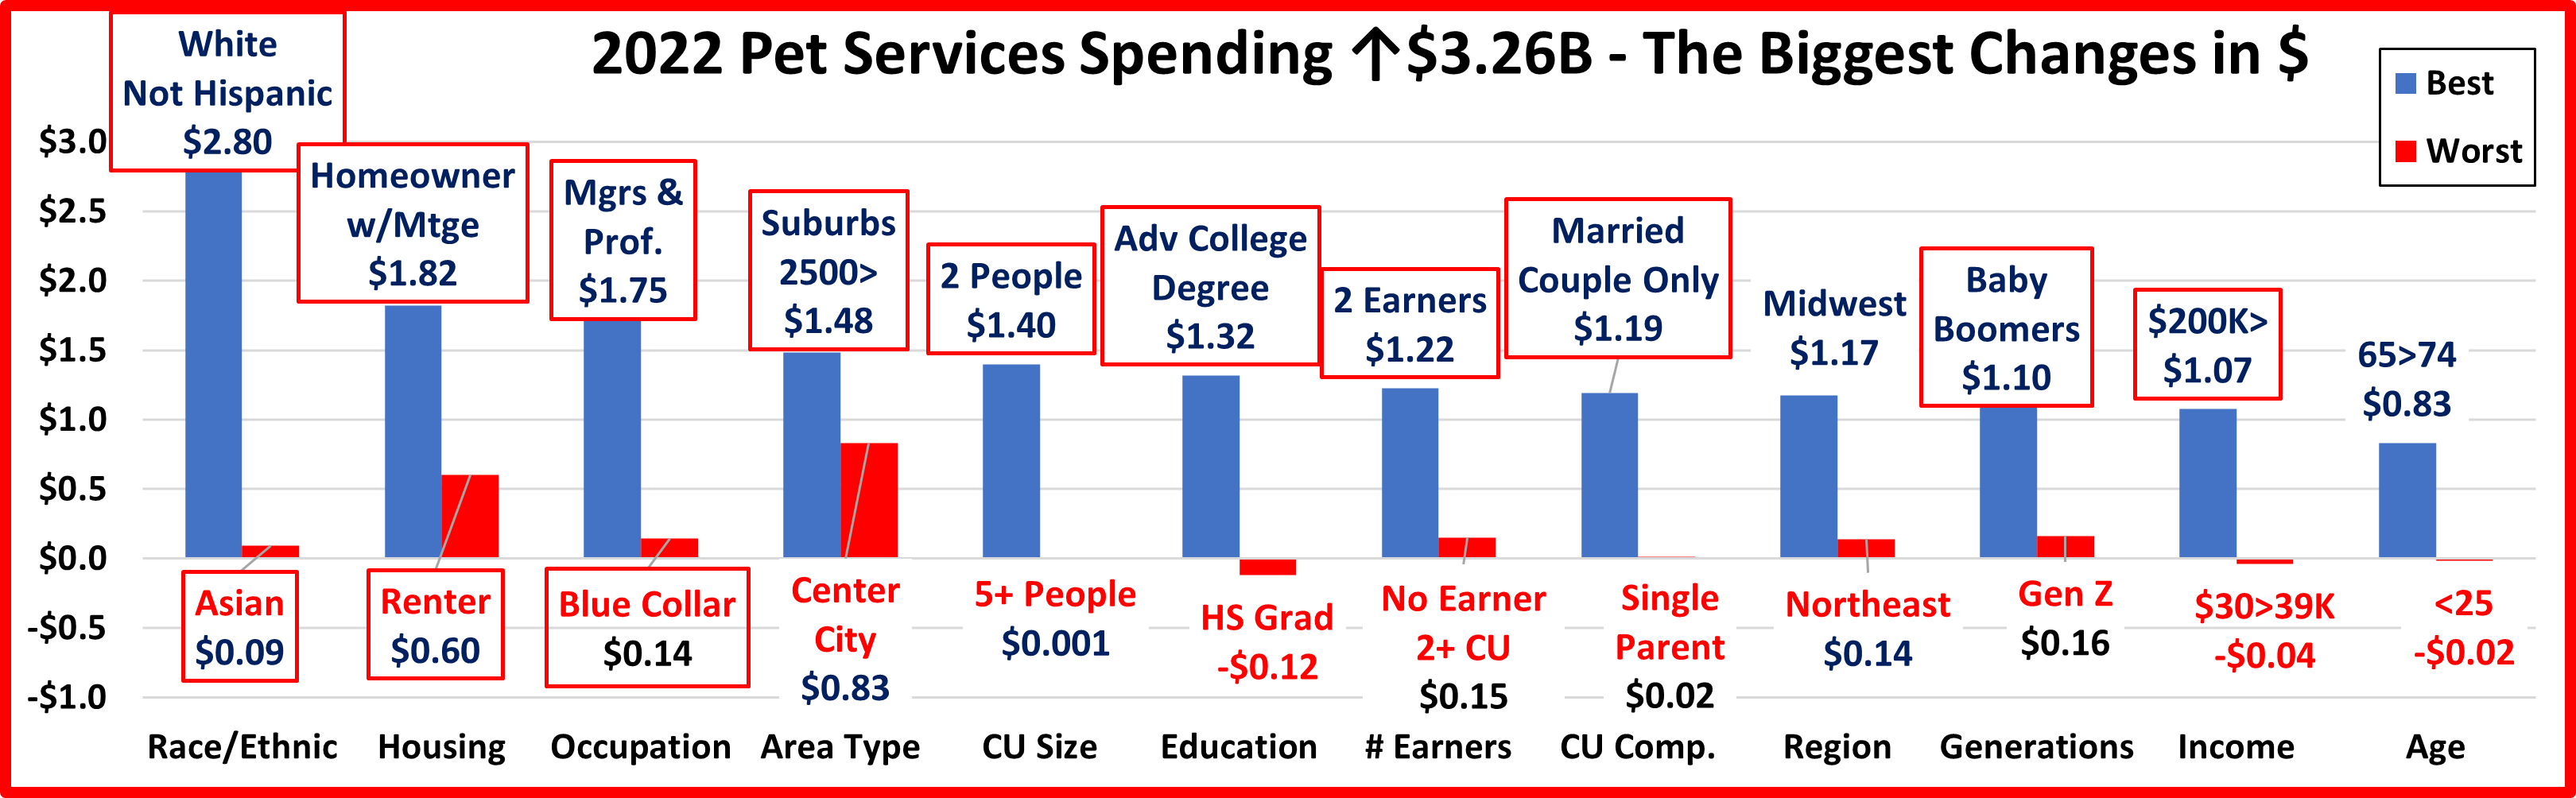
In this chart you immediately see the difference from last year. In 2022 you first notice stability. There were 13 repeats. In 2021 there were none. Also, no segments flipped from 1st to last or vice versa. In 2021 there were 13 flips. While 2021 brought a record increase, the lift in 2022 was even stronger and more widespread. In 9 categories all segments spent more compared to 5 in 2021. Also 93% of 96 demographic segments spent more, up from 90% In 2021. One thing is slightly worse. The biggest drop was -$0.12B. In 2021 it was only -$0.07B. 😊
Here are the specifics:
- Race/Ethnic – Both the winner and loser are the same as 2021.
- Winner – White, Not Hispanic – Services: $10.50B; Up $2.80B (+36.3%) 2021: White, Not Hispanic
- Loser – Asian – Services: $0.31B; Up $0.09B (+43.8%) 2021: Asian
- Comment– All segments spent more. Minorities were up $0.46B, +32.8%.
- Housing – Both winner and loser are the same as 2021. All segments spent more.
- Winner – Homeowner w/Mtge – Services: $7.01B; Up $1.82B (+35.2%) 2021: Homeowner w/Mtge
- Loser – Renter – Services: $2.37B; Up $0.60B (+34.1%) 2021: Renter
- Comment – Homeowners w/o Mtges had the biggest percentage increase, +39.0%.
- Occupation – For the 3rd and last time, no change in winner and loser.
- Winner–– Mgrs & Professionals – Pet Services Spending: $5.56B; Up $1.75B (+46.0%) 2021: Mgrs & Profess.
- Loser – Blue Collar – Pet Services Spending: $0.44B; Up $0.14B (+48.9%) 2021: Operators/Laborers
- Comment – Self-Employed had the 2nd biggest $ lift and the highest % increase, +$0.47B (+60.1%)..
- Area Type – Suburbs 2500> stayed on top while Center City replaced Rural at the bottom.
- Winner – Suburbs 2500> – Pet Services Spending: $5.72B; Up $1.48B (+34.9%) 2021: Suburbs 2500>
- Loser – Center City – Pet Services Spending: $3.90B; Up $0.83B (+27.1%) 2021: Areas <2500
- Comment – Center City “lost” with an $0.83B increase. This shows how well the Services segment is doing.
- # in CU – 2 People won again but 5+ People is a new loser.
- Winner – 2 People – Pet Services Spending: $5.15B; Up $1.40B (+37.3%) 2021: 2 People
- Loser – 5+ People – Pet Services Spending: $1.01B; Up $0.001B (+0.1%) 2021: 3 People
- Comment: All segments spent more. The 2 People lift was primarily driven by the Married Couple Only segment.
- Education – College Degree returned as #1. HS Grads replaced those with no HS Diploma at the bottom.
- Winner – Adv. College Degree – Pet Services Spending: $4.77B; Up $1.32B (+38.1%) 2021: Adv. College Degree
- Loser – HS Grads – Services Spending: $0.47B; Down $0.12B (-20.5%) 2021: <HS Grads
- Comment – Only HS Grads spent less. College Grads have 46.7% of CUs but generated 64.3% of the increase. However, those with an Associate’s degree more than doubled their spending, +$0.81B (+116.3%).
- # Earners– 2 Earners held their spot at the top while No Earner, 2+ CUs replaced No Earner, Singles at the bottom.
- Winner – 2 Earners – Pet Services Spending: $5.49B; Up $1.22B (+28.7%) 2021: 2 Earners
- Loser – No Earner, 2+ CU – Pet Services Spending: $0.82B; Up $0.15B (+21.9%) 2021: No Earner, Single
- Comment – All segments spent more. The biggest % lifts were in Singles – 1 Earner: +52.9%; No Earner: +51.6%
- CU Composition – Married, Couple Only stayed on top. Single Parents were a new loser.
- Winner – Married, Couple Only – Services: $3.80B; Up $1.19B (+45.5%) 2021: Married, Couple Only
- Loser – Single Parents – Services: $0.27B; Up $0.02B (+6.0%) 2021: Married, Oldest Child <6
- Comment – All groups spent more. Last year only Married, Oldest Child <6 spent less. This year they spent 33.9% more. Single Parents don’t spend much on Services. They spent 6% more, slightly less than the 6.3% inflation rate
- Region – Both the winner, Midwest, and loser, Northeast, are new.
- Winner – Midwest – Pet Services Spending: $2.82B; Up $1.17B (+71.5%) 2021: West
- Loser – Northeast – Pet Services Spending: $1.90B; Up $0.14B (+7.8%) 2021: South
- Comment – In 2020 all Regions spent less. In 2021 & 2022, all spent more. The South finished a close 2nd, +$1.15B
- Generation – Boomers won again but the youngsters, Gen Z, replaced the oldsters, Born <1946, at the bottom.
- Winner – Baby Boomers – Services: $4.15B; Up $1.10B (+35.9%) 2021: Baby Boomers
- Loser – Gen Z – Services: $0.27B; Up $0.16B (+143.5%) 2021: Born <1946
- Comment – In 2021, only Gen Z and those Born <1946 spent less. In 2022, all generations spent more, but the strongest lifts again came from Boomers (+$1.10B), Millennials (+$1.00B) and Gen X (+$0.74B).
- Income – $200K> won again but $30>39K replaced $40>49K at the bottom.
- Winner – $200K> – Pet Services Spending: $3.66B; Up $1.07B (+41.6%) 2021: $200K>
- Loser – $30 to $39K – Pet Services Spending: $0.37B; Down $0.04B (-9.4%) 2021: $40 to $49K
- Comment – The $50>69K group also spent-$0.02B less but <$30K spent 30% more and $40>49K doubled their spending. All income groups over $70K had 31+% increases, led by $70>99K at +60.9%.
- Age – Both winner and loser are new.
- Winner – 65>74 yrs – Pet Services Spending: $2.20B; Up $0.83B (+61.1%) 2021: 35>44 yrs
- Loser – <25 yrs – Pet Services Spending: $0.17B; Down $0.02B (-8.4%) 2021: 45>54 yrs
- Comment: In 2021, only the high-income 45>54 yr-olds spent less. In 2022 only the low income <25 group had a drop in spending. The lift skewed a little older, but it was actually pretty balanced among big age ranges. 25>44 was up +$0.90B; 45>64 was +$1.24B; 65> was +$1.13B.
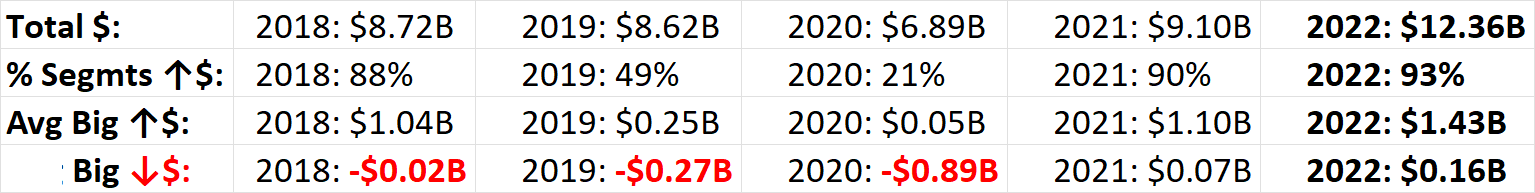
We’ve seen the winners and losers in terms of change in Services Spending $ for 12 Demographic Categories. The lift set another new record and was even more widespread than 2021. Here’s some data which shows the evolution from 2018 to 2022. Services were hit hard by the pandemic but recovered stronger than ever with 2 record lifts. They were the only segment to do this which reflects an attitudinal change by Pet Parents. You see the differences in the big swings.
We found the winners in performance and $, but there were others who performed well but didn’t win. They deserve….
HONORABLE MENTION
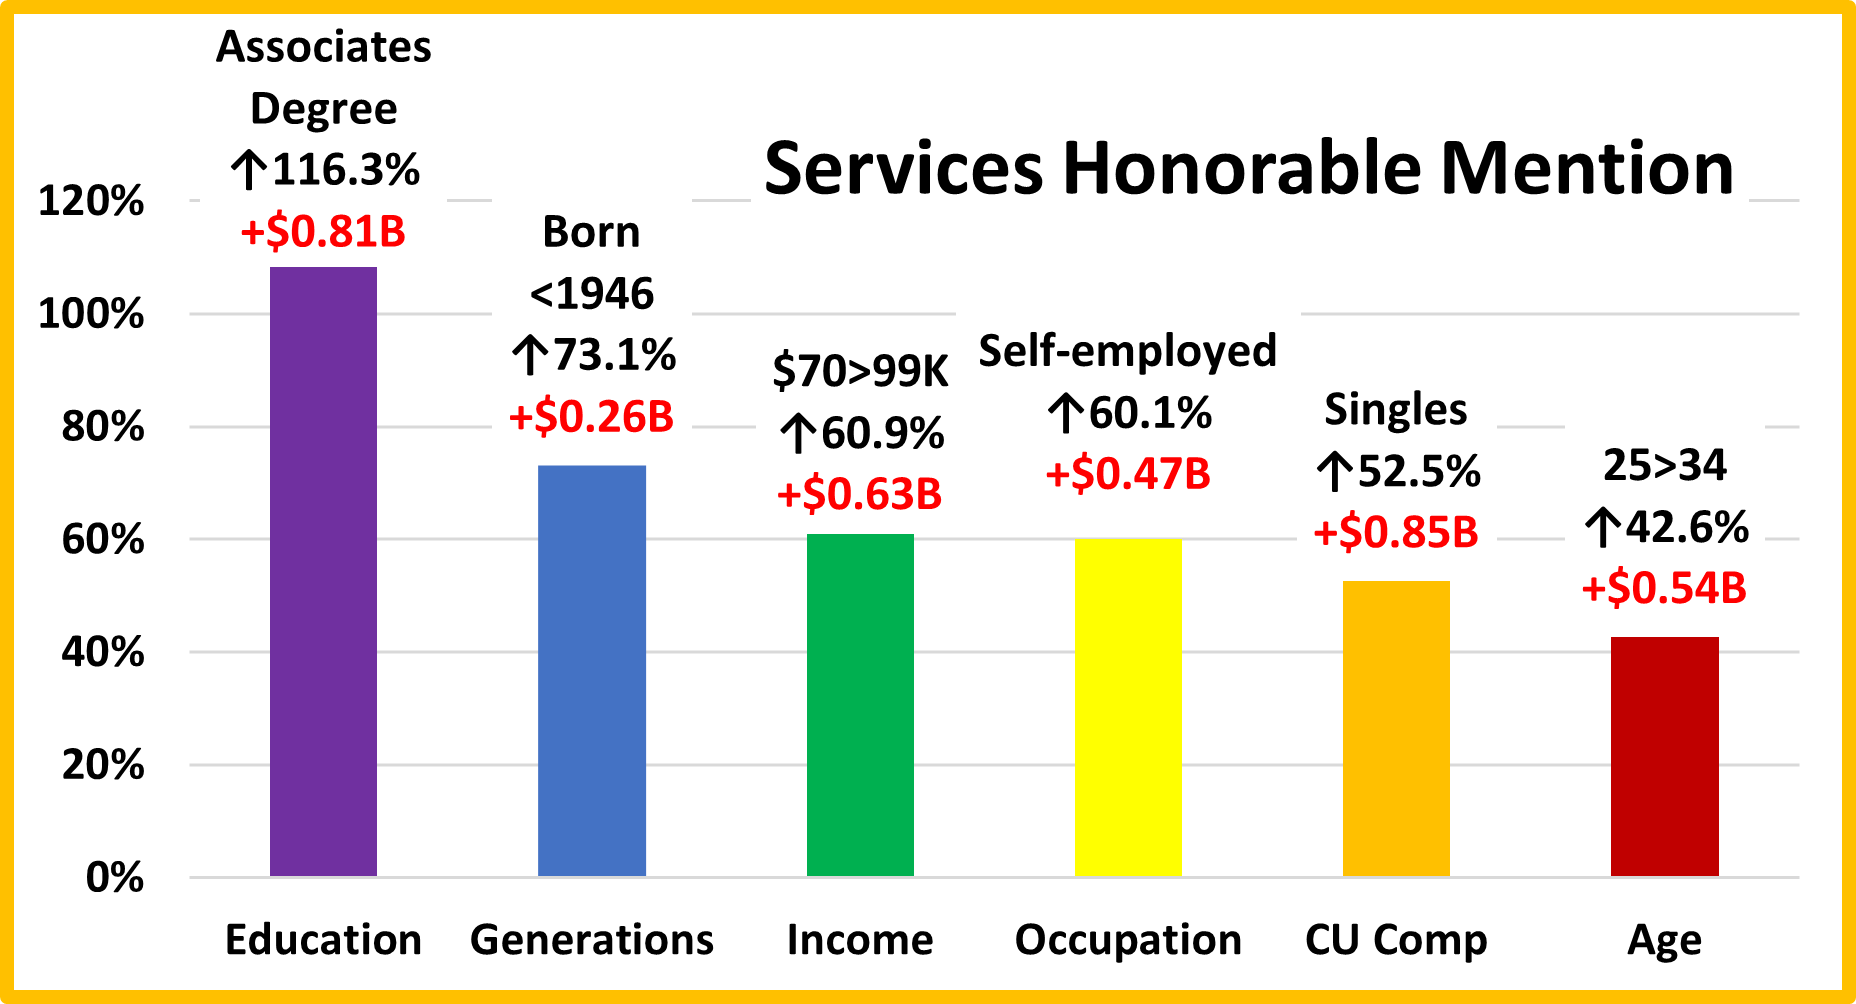
As usual this group is an eclectic mix. The Associate’s degree group immediately stands out as they more than doubled their Services’ spending. While spending skewed a little older, it also became a little more balanced among age groups which is shown by the strong performances of 25>34 yr-olds and those Born <1946. The Self-Employed group is often a winner, so they are no surprise. Their big lift didn’t happen until 2022 but their Services spending has generally grown every year, including aa 24% increase in 2020. Singles are often at the bottom in spending. They too had a small, 8% increase in spending in 2021 and followed it up with a 52% lift in 2022. Finally, the $70>99K group. Their income is below average and they have big CUs. However, they still managed to have a huge 60.9% lift in spending. In 2022, 93% of all segments increased Services spending. That means that we could have added many more to this honored group.
Summary
For years, Services’ spending slowly but steadily increased. However, the number of outlets offering Services was radically increasing. In 2017, this competitive pressure caused Pet Parents to shop for value and spending fell 1%. In 2018, the abundance of outlets and competitive prices finally had their intended impact. Many more consumers took advantage of the convenience of Pet Services and spending literally took off with a record increase to a new all-time spending high. In 2019 Consumers held their ground at the new higher level but we saw turmoil similar to 2017. Again, value shopping likely contributed to the small decrease.
In 2020, pandemic Services outlets were often deemed nonessential, so they were subject to restrictions and closures. Services are definitely needed by some groups. However, for most demographics, Services are a convenience and spending is very discretionary in nature. The reduced availability and the pandemic driven focus on the “needed” segments – Food and Veterinary caused a 20% drop in Services $.
In 2021 the Retail Marketplace opened up again and many Pet Parents strongly returned to their previous Services mantra, “I need help with my Pet “children” and I have the money to pay for it!”. This behavior was widespread as 90% of all demographics spent more on Services, producing a record increase. In 2022 Services showed that it was different from other segments. All had record lifts related to the Pandemic followed by drops, except for Services. 2022 spending didn’t decrease, it grew even stronger, +$3.26B and more widespread as 93% of demographics increased spending. However, Services is the segment where spending is the most driven by income, so it has always had a big disparity between segments. This improved slightly in 2022. Performance differences are a key measurement of disparity. Let’s consider the performance of the big groups. There were 6 categories with a 120+% performing big group, down 1 from 2021, and now 1 less than Supplies (7) but more than Veterinary (5) and Food (4). There is an even better measure of the improvement. In 2021, the average difference between best & worst performers was 108.5%. In 2022 it was 100.3%.
Another key trend in 2022 was that Gen X & Boomers are still the top 2 spenders, but their older members drove the lift.
Services were hit the hardest by the pandemic in 2020 but they had a record, widespread recovery in 2021. They are the segment most driven by high income so the 6.3% inflation in 2022 had less of an impact. It affected the spending of some specific, financially challenged groups, but the 2022 lift was even bigger and more widespread than 2021.
At Last – The “Ultimate” Pet Services Spending Consumer Unit consists of 2 people – a married couple with no kids at home. They are 45>54 yrs-old and White, but not of Hispanic origin. They both work and at least one of them has an Advanced College Degree and is a Manager or Professional. They have an income of over $200K. They live in a small suburb of a metropolitan area of 2.5>5 MM in the Western U.S. and are still paying off their home mortgage.

