2018 Pet Services Spending was $8.72B – Where did it come from…?

Next, we will look at Pet Services. They are by far the smallest Segment at $8.72B but in 2018, they made the most “noise”. Spending increased $1.95B (+28.9%). This was by far the biggest increase in history. The number of outlets offering Services has been strongly increasing in recent years as brick ‘n mortar retailers look for a way to combat the growing influence of online outlets. After all, you can certainly buy products, but you can’t get your dog groomed on the Internet. This created a highly price competitive market for Pet Services. In 2017 there was a slight increase in visit frequency, but Pet Parents just paid less. This resulted in a 1.0% decrease in Services spending. In 2018 consumer behavior changed as a significant number decided to take advantage of the increased availability and convenience of Pet Services and spending literally took off.

To better appreciate the significance of this huge spending lift, let’s put it into historical perspective. The $1.95B increase in Pet Services spending was larger than the total annual spending for the segment for every year prior to 1999. It was also more than twice as big as the previous largest increase of $0.82B in 2012. This is great news as Pet Services now has a stronger “presence” at the Pet Industry “table” and Pet Spending becomes a little more balanced. Let’s look a little deeper into the demographics.

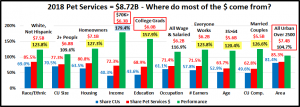
Let’s start by identifying the groups most responsible for the bulk of Services spending in 2018 and the $1.95B increase. The first chart details the biggest Pet Services spenders for each of 10 demographic categories. It shows their share of CU’s, share of Services spending and their spending performance (Share of spending/share of CU’s). The differences from the products segments are immediately apparent. In order to better target the bulk of the spending we had to alter the groups in three categories – income, education and area. The performance level should also be noted as 7 of 10 groups have a performance level above 120%. This compares to 6 for Total Pet, Veterinary and Supplies but only 4 for Food. These big spenders are performing well but it also indicates that there is a large disparity between the best and worst performing segments. Income is absolutely the biggest factor in Services Spending. The categories are presented in the order that reflects their share of Total Pet Spending which highlights the differences of the 7 matching groups.

  1. Race/Ethnic – White, not Hispanic (85.5%) down from 87.9%.This big group accounts for the vast majority of spending in every segment but Services Spending became slightly more diverse in 2018 as their performance fell from 128.3% to 123.8%. However, they are still tied for 5th in terms of importance.
  2. # in CU – 2+ people (77.3%) down from 79.8% The share of market for 2+ CU’s is very close for all segments but lowest in Services and the only one with a share less than 80%. Their performance of 109.6% is down from 111.9% also last. The explanation is that Singles had a great year. They are 29.5% of CUs and spent 44% more on Services.
  3. Housing – Homeowners (80.8%) down from 86.4%. Homeownership is a big factor in pet ownership and spending in all industry segments. The Homeowners’ share of Services spending fell sharply in 2018 as did their performance, from 137.4% to 127.3%. Homeownership fell from 3rd to a tie for 5th in terms of importance for increased Services spending. Homeowners w/mtge spent 34% more, but those w/o a mtge spent 5% less and … Renters $ were up 82%.
  4. Income – Over $70K (72.3%) up from 71.2% This group’s performance rating is 179.4%, down from 185.2% but still shows that CU income is the single most important factor in increased Pet Services Spending. The slight gain in share with a slight drop in performance can be explained by the slowly growing CU income. CUs under $70K spent 27% more on Services but they had 2% fewer CUs. The over $70K spent 23% more but gained 6% in CUs.
  5. Education – College Grads (68.9%) up from 68.8% Income generally increases with education. Services spending moves up with each increasing level of education. This is why we again shifted the group up to College Grads. Performance of 157.9% was down from 161.9% but a college education is still the 2nd most important factor.
  6. Occupation – All Wage & Salaried (71.4%) up from 64.1% – Last year we had a special group called “I’m the Boss” which consisted of Mgrs & Professionals, Self-employed and Retirees. This year regular workers took the lead. Their performance rating increased from 104.9% to 116.9%, but Occupation is no longer a member of the influential 120% club. As many “non bosses” stepped up, Services spending became more balanced in terms of Occupation.
  7. # Earners – “Everyone Works” (71.5%) up from (64.9%) All adults in the CU are employed. Income is important so a relatively high market share is expected. However, their performance grew to 123.8% from 113.3% and they returned to the 120% club at #5. This lift reflects the youth movement. Younger CUs generally have more earners.
  8. Age – 35>64 (63.7%) up from 61.0%. Their performance also increased significantly from 114.3% to 120.4%. A big lift in spending by the 35>44 yr olds caused the big spending group to grow younger from 45>74 yr olds. Services spending is becoming a little more balanced in this category, but age still ranks 7th in importance for Services $.
  9. CU Composition – Married Couples (62.8%) down from 64.5%. Married couples are a big share of $ and have 120+% performance in all segments. Their performance fell to 126.6% from 130.3% but they moved up to 4th place in terms of importance to Services spending. Married Couples spent 25.5% more on Services but that wasn’t as big a lift as the +44% by Singles or even the +30% by Single Parents, so they lost a little ground.
  10. Area – City/Suburbs >2500 (85.3%) up from 79.8% in share, while performance increased from 97.7% to 104.7%. Last Year the big group was all Suburban. In 2018 Central City virtually tied Suburbs >2500 for the spending lead. To get 60% and properly reflect the urban trend in this segment, we combined those 2 groups.

We changed 3 of the groups for Services – Income, Education and Area, to better target the biggest spenders. Income is even more important to Services spending than it is to Veterinary, where we only changed Income. The performance levels in Services spending in categories related to income – Income, # Earners, Occupation and Education, are markedly higher than Veterinary which shows an even  bigger spending disparity between the segments in Services.

Now, we’ll look at 2018’s best and worst performing Pet Services spending segments in each category.

Most of the best and worst performers are not a surprise. However, there are 8 that are different from 2017, the most of any segment – 4 of the best and 4 of the worst. Also, half the changes were in 2 categories – Age & Generation. The 4 new winners, Gen X, 35>44, Center City and Married, Oldest Child < 6, do reflect the very definite “youth movement” behind the big 2018 lift in Services Spending. Changes from 2017 are “boxed”. We should note:

  • Income is even more important to Pet Services. While the 364.0% Performance by the $200K> group is less than last year’s 398.8%, it is 41% higher than Veterinary and 130% higher than the best performing income segment in Food.
  • Generation – Gen X took over the Top Spot from the Boomers and Millennials got off the bottom. It was a good year for the younger generations.
  • Age – The 35>44 group reflects the youth movement. They are the best performers and spend the most $. It is also significant that the <25 group got off the bottom. All groups from 35>64 perform at 100+%. In 2017 it was 45>74.
  • Area –Center City became the performance leader, going from 90% to 117.3%, and was within $0.02B of taking the Spending $ lead from Suburbs >2500. Areas >2500 pop. were up $2B and accounted for 85.3% of total Services $.
  • CU Composition Married Couples, with an oldest child <6 may seem like a surprise, but they won in 2016. They also had the biggest % increase of ANY segment, +152.6%. Marriage and children are important factors in Services spending. Married Couples only and those with children of any age all perform over 100%. They all earn their share.

In Pet Services spending performance, we see 2 major factors – income, which is not a surprise in this most discretionary segment and youth, which is a surprise in a segment that has skewed older.

It’s time to “Show you the money”. Here are segments with the biggest $ changes in Pet Services Spending.

Pet Services Spending was up $1.95B, the biggest lift in history. In this chart you see the strong demographic impact as 9 of 12 categories had an individual segment that accounted for at least 47% of the increase. At the same time, the drops were small. The largest was only $0.17B. In fact, 6 of 12 categories had no segments that spent less. There were 7 repeats, 4 winners and 3 losers from 2017 but only 5 of 24 segments switched their position from first to last or vice versa, the same as Supplies. All of this indicates little turmoil, just strong, widespread growth. Here are the specifics:

  • Area Type – The winner and loser flipped as spending became more urbanized. Areas >2500 were up $2.04B.
    • Winner – Center City – Pet Services Spending: $3.71B; Up $1.51B (+68.5%)
      • 2017: Suburbs <2500
    • Loser – Suburbs <2500 – Pet Services Spending: $0.94B; Down $0.07B (-7.0%)
      • 2017: Center City
    • Comment – Center city won in 2015 & 2016 then lost in 2017. In 2018, they returned to the top.
  • Race/Ethnic – African Americans flipped from 1st to Last but all racial/ethnic groups spent more.
    • Winner – White, Not Hispanic – Services: $7.46B; Up $1.51B (+25.3%)
      • 2017: African American
    • Loser – African American – Services: $0.41B; Up $0.10B (+33.3%)
      • 2017: Hispanic
    • Comment – White, Non-Hispanics returned to their “usual” position at the top of this category.
  • Generation – The Winner and Loser are repeats.
    • Winner – Gen X – Services: $3.34B; Up $1.44B (+75.9%)
      • 2017: Gen X
    • Loser – Baby Boomers – Services: $2.76B; Down $0.17B (-5.9%)
      • 2017: Baby Boomers
    • Comment – Gen X became the biggest Services Spenders in 2018, taking over from the Baby Boomers. Boomers spent less in all segments, but their smallest decrease was in Services. Over 1/3 of their decrease came from fewer CUs, down 2.1%.
  • Housing – The winner and loser in Housing are also repeats from 2017.
    • Winner – Homeowner w/Mtge – Services: $5.19B; Up $1.31B (+33.7%)
      • 2017: Homeowner w/Mtge
    • Loser – Homeowner w/o Mtge – Services: $1.86B; Down $0.11B (-5.4%)
      • 2017: Homeowner w/o Mtge
    • Comment – Renters also spent a lot more, +$0.88B. The drop by Homeowners w/o mtge is tied to Retirees.
  • Occupation – The high income group, Mgrs & Professionals, was a repeat winner.
    • Winner– Mgrs & Professionals – Pet Services Spending: $3.89B; Up $1.06B (+37.5%)
      • 2017: Mgrs & Professionals
    • Loser – Retired – Pet Services Spending: $1.23B; Down $0.17B (-12.1%)
      • 2017: Self-employed
    • Comment – The Services spending increase was widespread as only Retirees spent less.
  • # Earners– No repeats or flips. 2 Earners was the big winner and No Earner, 2+ CUs was the only group to spend less.
    • Winner – 2 Earners – Pet Services Spending: $3.91B; Up $1.01B (+34.9%)
      • 2017: 1 Earner, 2+ CU
    • Loser – No Earner, 2+ CU – Pet Services Spending: $0.53B; Down $0.04B (-7.4%)
      • 2017: 3 Earners
    • Comment – The # of Earners became more important as “Everyone Works” CUs provided 94% of the increase.
  • Age – No repeats or flips and no real surprise as the 35>44 year olds do have the second highest income.
    • Winner – 35>44 yrs – Pet Services Spending: $2.00B; Up $0.96B (+93.3%)
      • 2017: 75+ yrs
    • Loser – 65>74 yrs – Pet Services Spending: $1.24B; Up $0.01B (+0.5%)
      • 2017: 55>64 yrs
    • Comment: All age groups spent more on Services as even the 65>74 yr olds eked out a $0.01B increase. The 35>44 yr olds led the way, followed by 45>54, then 25>34. In fact, CUs under 55 spent $1.89B more on Services, 97% of the increase. CUs 55 and over are 44% of the population but only generated 3% of the increase.
  • Region – The Midwest flipped from 1st to last, but the South is a new winner.
    • Winner – South – Pet Services Spending: $3.05B; Up $0.96B (+45.6%)
      • 2017: Midwest
    • Loser – Midwest – Pet Services Spending: $1.63B; Up $0.14B (+9.1%)
      • 2017: West
    • Comment – All regions spent more and all, but the Midwest, had at least a 21% increase.
  • Education – College Degree flipped from last to first and returned to the top after a year in the cellar.
    • Winner – Adv. College Degree – Pet Services Spending: $3.09B; Up $0.91B (+41.5%)
      • 2017: BA/BS Degree
    • Loser – HS Grad – Pet Services Spending: $0.55B; Up $0.02B (+3.8%)
      • 2017: Adv. College Degree
    • Comment – Again, all segments in this category spent more on Services. BA/BS had the second biggest increase, so College Grads accounted for 70% of the $1.95B spending lift.
  • # in CU – 2 Person CUs were the repeat winner.
    • Winner – 2 People – Pet Services Spending: $3.58B; Up $0.63B (+21.4%)
      • 2017: 2 People
    • Loser – 5+ People – Pet Services Spending: $0.52B; Up $0.06B (+12.3%)
      • 2017: 4 People
    • Comment: All size CUs spent more on Services. Singles finished a strong second with a $0.61B increase,
  • CU Composition – The winner and loser are both new and Singles are definitely an unusual winner.
    • Winner – Singles – Services: $1.98B; Up $0.61B (+44.2%)
      • 2017: Unmarried, 2+ Adults
    • Loser – Single Parents – Services: $0.21B; Up $0.05B (+30.0%)
      • 2017: Married, Oldest Child <6
    • Comment – CUs of every possible composition spent more on Services. Singles won, but Married Couples with children of any age spent $0.59B more, a 31% increase.
  • Income – The winner is new but not unexpected. The loser is a repeat from 2017.
    • Winner – $200K+ – Pet Services Spending: $2.07B; Up $0.58B (+38.5%)
      • 2017: $100 to $149
    • Loser – $30 to $39K – Pet Services Spending: $0.27B; Down $0.08B (-22.8%)
      • 2017: $30 to $39K
    • Comment – All income groups but one spent more on Pet Services. However, as expected the increase was skewed more towards the higher income groups. Income groups over $100K represent 25.8% of all CUs. They spent $1.36B more on Services, 69.7% of the increase. The $30>39K group had the only decrease. This income range corresponds to the average income of Retirees, so they undoubtedly were the primary negative driver.

We’ve now seen the winners and losers in terms of increase and decrease in Services Spending $ for 12 Demographic Categories. 2018 was a fabulous year. In 6 categories all segments spent more. Moreover, the winning increase in each category averaged +$1.04B up from +$0.25B in 2017, while the biggest decreases averaged -$0.02B up from -$0.27B.  That certainly shows a widespread lift . The major trend was definitely to the younger groups. Income reasserted its importance, certainly in terms of the number of Earners. Singles definitely stepped up and we also saw a spending move back to more populated areas. The $1.95B increase was the biggest in history and we have detailed the winners in performance and $. However, there were many who performed well but didn’t win an award. They deserve….

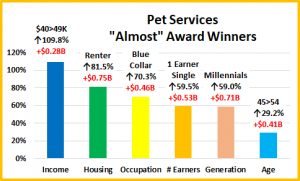
HONORABLE MENTION

It wasn’t all higher incomes, the $40>49K group more than doubled their Services Spending. With +$.75B, Renters definitely contributed. The Blue Collar workers rolled back their Food Spending in 2018 but increased Services $ by 70%. The 2017 winner for biggest increase, 1 Earner, 2+ CU actually did better in 2018. Gen X won the awards, but the Millennials weren’t far behind. The 45>54 yr olds are mostly Gen Xers and they did their part, finishing 2nd in Age Groups. The spending increase was widespread. In fact, only 8 of 92 demographic segments less on Pet Services in 2018. That means 84 (91.3%) spent more.

Summary

The Services segment has usually been “above” changes in other segments. Since 2010 prices have steadily increased but so did Spending …until 2017. An increase in outlets offering Services created a much more competitive environment. While prices didn’t deflate, inflation slowed significantly, and “deals” abounded as Retailers began a pitched battle for Consumers’ Services $. The net result was turmoil and a 1% decrease in spending. In 2018, the abundance of outlets and competitive prices finally had their intended impact. Many more consumers took advantage of the convenience of Pet Services and spending literally took off.

Pet Services are definitely needed by some groups. However, for most demographics, Services are a convenience and spending is very discretionary in nature. The result of this is that CU income is of paramount importance to increased Services spending. This impacts many demographic categories and we adjusted the big spender groups in 2 categories specifically to accommodate this difference in behavior and to better target where most of the $ are coming from. Just how important is income? 40.3% of CU’s have an income over $70K and account for 72.3% of Services Spending. This is a performance rating of 179.4% – the highest rating earned by any group in any category in any industry segment.

Performance is an important measurement. We identified 7 categories with high performing big groups. There were 6 for Veterinary and Supplies but only 4 for Food. This indicates greater demographic disparity in Services Spending.

  • Income  · Occupation     · Higher Education     · Homeownership    · CU Composition     · Race/Ethnicity    · Age

3 of these groups are directly related to income – Education, Occupation and Income. However, for 2 – Race/Ethnicity and Age, the consumer has no control over their inclusion. They can’t control their age, but it turns out that age was the single biggest factor in Pet Services spending in 2018. The biggest spending group changed from 45>74 to 35>64. However, it wasn’t just the added Gen Xers. The Millennials also stepped up.

Although the lift was widespread, as 91% of all demographic segments spent more on Services, there was a big disparity in the amount spent. This is apparent as 10 of the 12 best performing segments also had the biggest $ increase and the average increase was $1B, up from $0.25B in 2017.

The Youth movement was apparent in the improved performance of segments which reflect their demographics:

  • Preference for Urban areas
  • Higher education
  • More CU Earners
  • Presence of children…or Singles

… to name a few. In 2018, the Gen Xers and Millennials stepped up and took a position of prominence in Services Spending and raised the visibility of the Services Segment.

At Last – The “Ultimate” Pet Services Spending Consumer Unit consists of 3 people – a married couple, with 1 child under 6. They are White, but not of Hispanic origin. At least one of them has an advanced College Degree. They are 35 to 44 years old and both of them work, in managerial positions. They’re doing well with an income over $200K. They live in the Center City of a metropolitan area of over 2.5 million in the Western U.S. and are still paying off their mortgage.




2018 Pet Supplies Spending was $19.8B – Where did it come from…?

Next, we’ll turn our attention to Pets and Supplies. We’ll see some differences from Pet Food as the spending in the Supplies segment is more discretionary in nature. There are other factors too. Many supplies categories have become commoditized so pricing changes (CPI) can strongly impact Consumers’ buying behavior in this segment. Supplies’ Spending can also be affected by the spending behavior in other segments, especially Food. Consumers often trade $ between segments. In the second half of 2016, Supplies began a 24 month spending lift. The increase totaled $4.97B and ended in the second half of 2018 with a slight drop, -$0.01B. Coincidentally, the drop correlated with new added tariffs on Supplies. The net 2018 result for Supplies was a $1.22B (6.6%) spending increase.

Let’s see which groups were most responsible for the bulk of Pet Supplies spending in 2018 and the $1.22B lift. The first chart details the biggest pet supplies spenders for each of 10 demographic categories. It shows their share of CU’s, share of Supplies spending and their spending performance (Share of spending/share of CU’s). Although their share of the Pet Supplies $ may be different, all of the big spending groups are the same as Total Pet. Remember, for Food the age group is slightly older. The categories are presented in the order that reflects their share of Total Pet Spending. This highlights the differences in importance. All 10 of the groups have over a 60% market share. Pet Food had 9. We’re also back to 6 groups with performance over 120%. Pet Food had only 4. Education and Age dropped out. Higher Education correlates with higher income and income is more important in Supplies spending. Supplies spending also skews younger

  1. Race/Ethnic – White, not Hispanic (86.3%) up from (84.2%) This large group accounts for the vast majority of spending in every segment. Their performance rating was up from 122.9% to 125.0%. They are #4, but in a virtual 3 way tie for 3rd in terms of importance in Supplies Spending. Minority groups account for 31% of all CUs but spend only 13.7% of Supplies $. This is primarily due to lower income for Hispanics and African Americans and a lower rate of pet ownership in African American and Asian American CUs.
  2. # in CU – 2+ people (82.7%) down from (82.8%) Their Supplies performance was 117.3%, up from 116.1%. They lost share but increased performance because of a big increase in the number of single CUs, but singles perform so poorly. 2 People CUs dominate share. However, the performance in 2+ CUs is 100+% for all sizes. In Supplies spending, it definitely “just takes two.”
  3. Housing – Homeowners (79.9%) up from (79.4%) Homeownership is a major factor in pet ownership and spending in all industry segments. Their performance was down slightly to 125.9%, from 126.2%, but they held on to 3rd place in terms of importance for increased Pet Supplies spending. All groups, Homeowners and Renters spent more. However, the bulk of the spending lift – $0.8B (65%) came from Homeowners with a mortgage.
  4. Income Over $50K (73.3%) up from (71.3%) With a performance rating of 137.6%, down from 138.8%, CU income is the single most important factor in increased Pet Supplies Spending. The increased discretionary nature of much of Supplies spending pushes the share and performance level  higher than that of Pet Food. However, it is still significantly below the Service Segments. Higher Income still generally generates Higher Pet Supply Spending.
  5. Education – Associates Degree or Higher (68.2%) up from (65.6%) Higher Education gained market share and their performance level rose from 122.2% to 125.0%. They stayed 4th in importance for generating greater Supplies spending. Higher Education generally produces higher income.
  6. Occupation – All Wage & Salary Earners (65.2%) up from (63.4%) – The performance of this group was 106.8%, up from 103.8%. In a marked contrast to Pet Food, they gained in share and performance as all wage/salary groups spent more on Supplies. However, half of the group’s spending comes from the higher income Mgrs/Professionals.
  7. # Earners – “Everyone Works” (65.4%) up from (62.5%) In this group, all adults in the CU are employed. Income is important in Supplies Spending and the only thing holding this group back is the poor performance by 1 earner, singles. CUs with 2+ Earners spent $1.22B more on Supplies. The group performance went from 109.1% to 113.2%.
  8. Age – 35>64 (65.2%) up from (64.1%) Traditionally, Supplies Spending skews more towards the younger groups. The 35>64 group maintained their dominance and even gained a little ground. Supplies Spending was up in all age segments of this group, but it was primarily driven by the 35>44-yr olds. The 65>74 yr olds spent less which contributed to the 35>64 performance level increasing to 123.2% from 120.0%. However, they stayed in 6th place.
  9. CU Composition – Married Couples (64.8%) up from (64.2%) Married couples are a big share of $ and perform well whether alone or with children. They gained slightly in share, as all segments spent more, especially Couples Only. Their performance also grew slightly from 129.7% to 130.5% and they remain 2nd in importance.
  10. Area – Suburban (63.3%) up from (63.0%) Suburban CUs are the biggest spenders in every segment. They gained a little ground in Supplies and their performance improved to 114.4%, from 113.3% in 2017. All areas spent more but the Suburbs over 2500 population had the biggest lift.

The biggest spending groups for Pet Supplies are the same as Total Pet and 9 of 10 are the same as Food. However, the discretionary nature of Supplies causes spending to be more impacted by income than Food. Groups associated with higher income, like Education and # Earners, perform better than in Food. Homeownership and Marriage had the most growth in Supplies $. Having 6 groups with 120+% performance also indicates greater disparity between segments.

Now, we’ll look at 2018’s best and worst performing Pet Supplies spending segments in each category.

Almost all of the best and worst performers are those that we would expect. In Pet Supplies spending, there are only 3 that are different from 2017. That is by far the least change of any segment, 4 fewer than Pet Food and 2 less than for Total Pet. As we move deeper into the data, we will start to see even more differences between the Industry Segments. Changes from 2017 are “boxed”. We should note:

  • Income matters in Supplies spending.
    • The 228.5% Performance by the $200K> group is 44.1% better than the best income segment in Food.
    • 9 of the 12 winners for best performance had the highest income of any segment in the category. The other three came in 2nd – White, not Hispanics, Suburbs <2500 and the West.
    • In Categories associated with Income, including # Earners, Occupation and Higher Education, the disparity between the best and worst performers grew in 2018. This indicates less balance in spending.
  • Occupation – Blue-Collar workers lost last year. This year it was Retirees. After a huge lift in all segments in 2017, they cut back spending on everything but food in 2018. They still spent $0.5B more in 2018 on supplies than in 2016.
  • # in CU –In 2018 the performance of 2 to 4 people CUs was again very close. 4 edged out 3 for the win. However, even 5+ earned their share at 100.6%. That truly leaves Singles “standing alone”. It just takes 2.

It’s time to “Show you the money”. Here are segments with the biggest $ changes in Pet Supplies Spending.

In 2018 Supplies Spending was up $1.22B. However, the ongoing lift, which began in the second half of 2016 ended in the second half of 2018 as spending flattened and then turned down slightly. In the chart, there are 6 repeats from 2017 – 5 winners and 1 loser. 5 segments switched from last to first or vice versa. However, this is much less turmoil than in the Food Segment. Tech/Sls/Clerical, 4 People CU’s and Millennials were surprise winners. However, the biggest surprise or change from 2017 was that in 3 of 12 Demographic Categories every segment increased spending on Supplies. In 2017 it was 10. This provides perhaps the first indication of the impact of the spending downturn in the second half of 2018. Here are the specifics:

  • Race/Ethnic – The White, Non-Hispanics share of Supplies spending is 86.3%, but they produced 117%% of the lift.
    • Winner – White, Not Hispanic – Supplies: $17.08B; Up $1.43B (+9.1%)
      • 2017: White, Not Hispanic
    • Loser – Asian Americans – Supplies: $0.41B; Down $0.19B (-31.3%)
      • 2017: African Americans
    • Comment – African Americans spent 11.8% more in 2018 but Hispanics spent 6.7% less. In 2017 all groups increased Supplies Spending. In 2018 the White, Not Hispanic group increased their dominance in Supplies.
  • Generation – The Boomers flipped from 1st to last but everyone else spent more.
    • Winner – Millennials – Supplies: $4.57B; Up $0.90 (+24.7%)
      • 2017: Baby Boomers
    • Loser – Baby Boomers – Supplies: $6.86B; Down $0.62 (-8.3%)
      • 2017: Silent Generation
    • Comment – Just as they did in the Food Segment, the Millennials stepped up with the biggest increase, but once again, the Gen Xers weren’t far behind, +$0.85B
  • Housing – All segments maintained their positions and all increased spending.
    • Winner – Homeowner w/Mtge – Supplies: $10.80B; Up $0.80B (+8.0%)
      • 2017: Homeowner w/Mtge
    • Loser – Renter – Supplies: $3.98B; Up $0.15B (+3.8%)
      • 2017: Renter
    • Comment – Renters finished last but this year that meant a 3.8% increase. Unfortunately, Renters continue to lose ground to Homeowners. One factor is that the number of CUs is falling as Homeownership slowly increases.
  • # Earners – 1 Earner, 2+ CUs flipped for the second consecutive year and are back on the bottom.
    • Winner – 2 Earners – Pet Supplies Spending: $8.26B; Up $0.80B (+10.6%)
      • 2017: 1 Earner, 2+ CU
    • Loser – 1 Earner, 2+ CU – Pet Supplies Spending: $4.13B; Down $0.17B (-4.1%)
      • 2017: No Earner, Single
    • Comment – Income is always a big factor and the # of Earners became more important in 2018, at least for the 70.5% of CUs with 2 or more people. Singles spent more on Supplies regardless if they worked or not. However, in 2+ people CUs, unless there were 2 or more earners, Supplies spending decreased. The 2 Earner CUs beat out the 3+ Earner CUs for the biggest increase for 1 simple reason. There are 4 times more of them.
  • Occupation – The Tech/Sales/Clerical flipped to 1st from last.
    • Winner – Tech/Sls/Clerical – Pet Supplies Spending: $3.26B; Up $0.77B (+31.0%)
      • 2017: Mgrs & Professionals
    • Loser – Retired – Pet Supplies Spending: $3.05B; Down $0.42B (-12.0%)
      • 2017: Tech/Sls/Clerical
    • Comment – Last year all groups spent more on Supplies. In 2018 all groups but Retirees spent more, even Blue-Collar workers. However, 63% of the increase was driven by Tech/Sls/Clerical workers. Their “Bosses”- Managers & Professionals and the Self-Employed supplied 32%.
  • Education – BA/BS Degrees led the way for the second consecutive year.
    • Winner – BA/BS Degree – Pet Supplies Spending: $6.27B; Up $0.76B (+13.8%)
      • 2017: BA/BS Degree
    • Loser – < High School Grads – Pet Supplies Spending: $0.60B; Down $0.17B (-22.4%)
      • 2017: High School Grads
    • Comment – There was another clear dividing line. All High School Grads with some college courses, specific job training or a formal degree spent more. Those with only a High School diploma or less, spent less.
  • Area Type – Suburbs Over 2500 population kept the top spot.
    • Winner – Suburbs >2500 – Pet Supplies Spending: $8.89B; Up $0.70B (+8.6%)
      • 2017: Suburbs > 2500
    • Loser – Suburbs < 2500 – Pet Supplies Spending: $3.64B; Up $0.12B (+3.5%)
      • 2017: Rural
    • Comment – All areas spent more but those with a population over 2500 supplied 80% of the increase.
  • Region – In 2017 All groups spent more. In 2018 all but the Northeast spent more.
    • Winner – Midwest – Pet Supplies Spending: $4.27B; Up $0.67B (+18.6%)
      • 2017: Northeast
    • Loser – Northeast – Pet Supplies Spending: $3.35B; Down $0.40B (-10.7%)
      • 2017: Midwest
    • Comment – A dual flip. The Midwest flipped from last to first, but they now have 2 consecutive years of increases. They narrowly edged out the South for the win. The “score” was +$0.67B to +$0.64B.
  • Income – Last year all groups spent more. This year it was truly a mixed bag with a new winner and loser.
    • Winner – $200K > – Pet Supplies Spending: $2.95B; Up $0.61B (+26.2%)
      • 2017: $150 to $199K
    • Loser – $70 > 99K – Pet Supplies Spending: $2.88B; Down $0.16B (-5.2%)
      • 2017: <$30K
    • Comment – The Mixed Bag: <$40K and $70>99K groups spent less. $40>69K and Over $100K groups spent more.
  • Age – Last year all groups spent more. This year the 65>74 yr olds were the only group to spend less.
    • Winner – 35>44 yrs – Pet Supplies Spending: $4.05B; Up $0.56B (+16.0%)
      • 2017: 55>64 yrs
    • Loser – 65>74 yrs – Pet Supplies Spending: $2.36B; Down $0.09B (-3.8%)
      • 2017: <25 yrs
    • Comment: There were no repeats or flips and a very simple result with only 65>74 year olds spending less. The 35>44 year olds led the way but they had some help. In fact, the 25>54 year old range spent $1.13B more and accounted for 93% of the increase.
  • CU Composition – Married Couples Only had a bad year in Food but again had the biggest increase in supplies $.
    • Winner – Married, Couple Only – Supplies: $6.05B; Up $0.47B (+8.5%)
      • 2017: Married, Couple Only
    • Loser – Single Parents – Supplies: $0.63B; Down $0.19B (-23.4%)
      • 2017: Unmarried, 2+ Adults
    • Comment – The increases were small but widespread. All CUs but Single Parents and Married Couples with no children, but at least one other adult living with them spent more.
  • # in CU – For the second consecutive year, all groups registered an increase.
    • Winner – 4 People – Pet Supplies Spending: $3.11B; Up $0.34B (+12.3%)
      • 2017: 2 People
    • Loser – 5+ People – Pet Supplies Spending: $1.92B; Up $0.16B (+9.2%)
      • 2017: 3 People
    • Comment: The increases were very balanced across all sizes. 4 person CUs were up $0.34B. 5+ person CUs were up $0.16B. The smaller CUs, 1-3 people were all up from $0.22 to $0.28B.

We’ve now seen the winners and losers in terms of increase/decrease in Pet Supplies Spending $ for 12 Demographic Categories. In 2018, 24 months of strong growth slowed. 3 of 12 categories had no segments that spent less on Supplies but that was down from 10 in 2017. We saw many of the traditionally strong performers on the top again. There were 3 somewhat surprising winners, 4 Person CU’s, Tech/Sls/Clerical and Millennials, which all skew younger in age. However, not every good performer can be “the” winner and some of these “hidden” segments should be recognized for their outstanding performance. They don’t win an award, but they deserve…

HONORABLE MENTION

The numbers from these segments certainly merit their recognition for Honorable Mention. They also reinforce the gains in importance of Education, Income, Youth and Population density to increased Supplies spending. Adv. Degrees were the best performers and BA/BS had the biggest increase, but Assoc. Degree spent 20% more on Supplies. $100>149K finished 2nd but reinforces the importance of Income. Over $100K: +$1.31B. Under $100K: -$0.09B. The 25>34 yr olds had the second biggest increase, but the 25>44 yr olds provided 70% of the total lift. The South was within 5% of the winning Midwest region. Having “kids” was important as 3 people CUs was second only to 4 people CUs. Population mattered as Center City was second to Suburbs >2500. 2018 was not as great as 2017 but it was still pretty good as 72 of 92 Demographic Segments 78.3% spent more on Supplies.

Summary

While Pet Food spending has shown a definite pattern, Pet Supplies have been on a roller coaster ride since 2009. Many Supplies categories have become commoditized and react strongly to changes in the CPI. Prices go up and spending goes down…and vice versa. Supplies spending has also been reactive to big spending changes in Food. Consumers spend more to upgrade their Food, so they spend less on Supplies – trading dollars. We saw this in 2015. Then in 2016 the situation reversed. Consumers value shopped for Food, so they spent some of the “saved” money to increase their spending on Supplies.

That brought us to 2017. Both Supplies and Food prices deflated while the inflation rate in both of the Services segments dropped to lows not seen in recent years. Value was the “word” and it was available across the market. Perhaps the biggest impact was that the upgrade to super premium Food significantly penetrated the market. This could have negatively impacted Supplies Spending, but it didn’t. Supplies’ spending increased in 93% of 92 demographic segments.

2018 started out as expected with a $1B increase in Supplies and a small lift in Food. Then the government got involved. In July the FDA issued a warning on grain free dog food and spending dropped over $2B. New tariffs were implemented on Supplies and spending flattened out then turned down $0.01B in the 2nd half. Because of shipping timing, the retail impact of Tariffs is delayed. However, in the 2nd half of 2018 they seem to have started to affect Supplies spending.

Among the demographic categories in which a consumer has some control, Higher Income, Marriage, Homeownership and Higher Education are still the biggest factors in increased Supplies spending. In 2018 Income stayed on top but some categories directly associated with income, Occupation, # of Earners and Higher Education also increased in importance.

Increased Tariffs mean increased prices which negatively impacts Supplies Spending. Let’s take a demographic look. The 12 best performing segments were all 1st or 2nd in income. The 12 worst performers were all at or near the bottom in income. 8 of the 12 groups with the biggest increase were also in the top 2 in income. Half of the losers were in the income basement. There were 20 segments with decreased Supplies Spending. Half had very low income.

It appears that 2018 increased the overall importance and reach of income in Supplies Spending. The one exception was the Millennial Movement. They rank only 3rd in income but the older ones are at or above the national average.

It will be interesting to see how the tariffs affect 2019 Supplies Spending.

Finally – The “Ultimate” Pet Supplies Spending CU consists of 4 people – a married couple, with 2 children, the oldest is over 18. They are in the 45 to 54 age range. They are White, but not of Hispanic origin. At least one of them has an advanced College Degree. Both of them work, running their own business and their oldest child just started a part time, after school job. They’re doing well with an income over $200K. They live in a small suburb, adjacent to a big city in the Western U.S. and are still paying off the mortgage.


Attending Global Pet Expo 2020? – The Showcase of the U.S. Pet Industry – You Definitely Need a Plan!

The first Global Pet Expo (APPMA) occurred 62 years ago with 17 exhibitors in 30 booths. The industry and the show have both come a long way since then.  In 2020 attendees will see and experience:

  • 1072 separate exhibitor booths – with companies from the U.S. and 26 other countries – a Global experience!
  • Over 350,000 square feet of booths (Plus 30,000 sq ft for the New Product Showcase) Global Pet Expo 2020 actually occupies more than 18 acres of prime Florida “real estate”.
  • 1000 new items in the New Product Showcase plus 3000 more launched on the exhibit floor
  • Sharing the aisles with 16,000+ attendees, more than 6000 “buyers”.
  • The opportunity to choose from 50 different educational seminars – 57 hours of classes
  • 5 miles of aisles – just to walk the exhibit floor

The show floor is open for 26 hours so let’s put this in perspective and… “Do the Math!”

 If you don’t attend any seminars, visit the New Product Showcase, stop to chat with anyone in the aisles or for food, a drink or to go to the bathroom and maintain a walking speed of 2.5 mph, you can spend about 1 minute and 21 seconds with each exhibitor…You definitely need a plan!

Global Pet Expo definitely has it all… and more. Attendees will find the broadest selection of products and services while Exhibitors have the opportunity to reach a wide range of buyers across all retail channels.

First and foremost, Global is about Pet Products – Food, treats and a vast array of Supply categories. A regular flow of New Products is always critical to keep businesses and the whole industry strong and growing. Obviously, you must take the time to visit the New Product Showcase. You should also sign up for any relevant classes, network with other industry professionals and…walk the whole show.  There are 3 times as many new products being “launched” on the show floor as there are on display in the New Product Showcase. Plus, 30% of the exhibitors were not at Global 2019. Global is about gathering information and making decisions to improve your business – whether they are made on the spot or put on your “must do” list.

Every business can improve in terms of products. If you are a retailer, what sections of your store are not doing as well as you hoped and need a “facelift” or conversely, what areas are growing and need products to fill additional space? Category managers for distributors and retail chains may only be interested in targeted visits to exhibitors relevant to their “categories”. Representatives may be looking for new manufacturers…in specific product categories. Manufacturers could be looking to find distributors to handle their products or just looking to “check out” the competition. In regard to products, there is always something to see…for everyone!

And Global is the place to see it. It’s all there! With so much to see and do, Time is perhaps the most valuable commodity at the show. How do you make the most of your time on the show floor? Here’s an idea.

In 2014 I first designed a tool in Excel, the Super Search Exhibitor Visit Planner to make “working Global & SuperZoo easier and more productive for ALL attendees – retailers, distributors, reps, groomers, vets…even exhibitors. I have updated the data and produced a tool for every GPE and SuperZoo since then…including GPE 2020.

The “update” is not just exhibitor lists but also to the product category offerings for every exhibitor. I reviewed every exhibitor profile on the show site, but I also visited over 1100 websites and conducted separate internet searches to “validate” the product offerings. It is not 100% accurate, but it is close.

What does the SuperSearch do?… It searches for and produces a list of Exhibitors by product categories.

  • From the simplest – “give me a list that I can look at on my phone or tablet in either Booth # order or alphabetically”
  • To the most complex…”can do a simultaneous search for multiple specific product categories, allowing you to personally narrow down the initial results and see the “final” alphabetically or by booth number. The GPE Super Search Exhibitor Visit Planner does both…and more…and does it quickly! Take a look at the Quick Start Guide. You will see that it looks complex but is really quite simple.

GPE 2020 Super Search Exhibitor Visit Planner – Quick Start Guide

First: When you download the Excel file, Remember to Enable Saving, Editing & Macros!

The GPE Super Search Exhibitor visit planner is designed to make your time on the show floor more efficient and more productive. With the Super Search you can conduct up to 5 separate and distinct product category searches simultaneously with consolidated results produced in booth # order to facilitate your “journey”. There are detailed instructions for reference and to help you understand the nuances of the tool. However, it is really very simple so let’s get started. (Note: No changes in instructions from 2019) Here is the Dashboard where you set up your searches.

On the dashboard, the first things to note are the numerous category columns. There are 5 different floor sections, 11 different Exhibitor or Animal Types and 33 Dog and/or Cat Product categories. You can search exhibitors for any combination of these.

Let’s take a specific example running 3 simultaneous searches for several Dog/Cat categories:

  • Toys
  • Treats
  • Catnip & Litter (Must sell both)

Now referring to the Dashboard, let’s take it by the numbers:

  1. This column is where you activate each search. Type in a “Y” (Cells C3>C7 will auto-capitalize) This search “line” becomes active.(cell turns green) In our example we are running 3 searches, so we have 3 “Y”s.
  2. Now we enter a 1 in the correct column for each search line. Search Line 1: Toys; Search Line 2: Treats.
  3. In Search Line 3 we want exhibitors that sell both Catnip and Litter, so we put a 1 in both of these columns.
  4. Now we just “click” the Execute Search Button. The searches are done simultaneously, and the results combined into a single list in alphabetical order.
  5. If you would like to view the list in Booth # order, just click the Booth # Sort.
  6. You can switch the list back to an alpha view by clicking the Alpha Sort Button.
  7. To Clear all your search categories and start a new search, Click the Clear Criteria Button. Then click Execute (#4) again and you will be back to the full list

Note: Any Search Line with a Y and no 1’s in any column will always deliver the entire list regardless of what is selected in other lines. Change the Y back to an N in unused search lines. Now a sample of the results:

Company A – Has Toys Only; Company B has Dog Treats Only and is also a 1st Time Exhibitor at GPE; Company C is on the list for Treats and also has Catnip, but no Litter. This is not unusual as Catnip is often a Treat; Company D has Treats & Toys. Company E has both Catnip and Litter and in fact, actually has it all!

Note: The Super Search highlights your search categories, so you know “why you are there”. However, it also shows all categories that are available. Some might “pique” your interest while you are visiting the booth.

You can review the exhibitors alphabetically then put the list in Booth # order to make it easier to “work”. The Super Search also allows you to “cut down” the list during your review. (Pg 2; Point #11 – “U Pick ‘em” in Detailed Instructions) But First, I suggest that you “play” with the Super Search to get a “feel” for the tool, then review the Detailed Instructions. With your “play” experience, the detailed instructions will become a “quick read” and a valuable reference. You will soon be “up to speed” on the full capabilities of Super Search. Good Luck and Good “Hunting” at GPE 2020!

Ready to Start Planning?

Use the links below to download the Super Search Tool (Be Sure to Enable Editing/Macros/Content if asked by your computer), the Quick Start Guide and the Detailed Instructions. Then GET STARTED!

NOW DOWNLOAD THE SEARCH TOOL

(For the Excel file to work on your computer, be sure to enable saving/macros/editing/content if asked.)


NOTE:Each Super Search will have a date in the file name. The file has been updated with changes since 2/15. The new exhibitors and booth changes are highlighted in yellow. The changes that occurred from 2/8 to 2/15 are highlighted in blue and the changes from 2/4 to 2/8 are still highlighted in pink.

SPECIAL NOTE!!: Due to the recent travel restrictions from mainland China to the U.S. because of the coronavirus, over 100 Chinese exhibitors have cancelled. Always check the date to be sure that you’re using the most up-to-date version.