2015 U.S. Pet Spending by Racial/Ethnic Groups
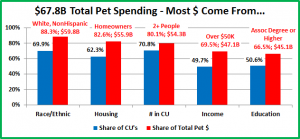
Over 88% of the $67.75B that we spent on our companion animals in 2015 was done by 69.9% of the 128.4 million financially independent Consumer Units. These “majority” CU’s are White, Not Hispanic. That means that the 38.4 million CU’s – 30.1%, which are Racial or Ethnic minorities, generated less than 12% of Total Pet Spending.
In our earlier demographic analyses, we noted specific instances of minority “under performance”. In this report, we will drill deeper to get more specifics on the Pet Spending by Minority Groups – Hispanics (All Races), African Americans and Asians. The U.S. is growing more ethnically diverse every day so this is a situation and an opportunity which needs to be investigated.
Note: All the numbers are calculated from or taken directly from the Annual US BLS Consumer Expenditure Survey.
Let’s get started by looking at the Racial/Ethnic make-up of the U.S.
- The White, Not Hispanic group also includes Native Americans and Pacific Islanders.
- 2015 is the first year that the White, Not Hispanic group fell below 70% of the total CU’s
- Asian share of CU’s was down slightly.
- The biggest growth in number of CU’s came from Whites, although it was only 4K more than Total Minorities.
- African Americans are increasing at a rate more than double the White Population.
- The Hispanic growth is spectacular. Hispanic CU’s are increasing 3½ times faster than Whites.
Now let’s take a look at some of the characteristics that we have found to be important in pet spending behavior.
- CU Size – Hispanics have by far the largest CU’s, 30+% higher than average. However, in 2015, smaller CU’s, 2-3 people, generated the most spending and had the biggest increase largely due to the Food Upgrade by the Boomers.
- # Children under 18 – In 2014, CU’s with more than 1 child bought the most pet products. In 2015, it was the older age groups with a child over 18. Note: With twice as many children per CU than Whites, the Hispanics are sure to gain in share of CU’s, even without immigration.
- # Earners– It is more likely that all the adults work in a Hispanic family. With twice as many kids, this could be tough.
- Homeownership – Homeowners account for 80+% of all Pet Spending. The percentage of Hispanics and African Americans that own homes is 40% less than Whites. Both groups are also twice as likely to live in a Center City than in the suburbs. Asians are also likely to be Center City dwellers. The rate of pet ownership is lower in Center Cities.
- Education was also an important factor in 2015 spending, especially regarding the Food Upgrade and the Veterinary segment. The Asians are the leaders, while Hispanics have the lowest percentage of after High School education.
Next, we’ll compare each to the National Avg in Income, Spending, Pet Spending and Pet Share of Total $pending.
CU National Averages: Income – $69,627; Total Spending – $55,978;
Pet Spending – $528.17; Pet Share – 0.944%
- Asian Americans make and spend the most money…but not on their pets. This may be due to cultural differences.
- African Americans and Hispanics have lower incomes and their overall spending is relatively in line. However, they spend significantly less on their pets. This is especially true of African Americans and indicates a significantly lower rate of pet ownership. A consumer survey from HUD on emergency disaster planning found this number to be 24%.
- The spending of White Americans is very much tied to income, except where their pets are concerned, then…$$$.
It’s time to look at actual Dollars Spent. We’ll review the spending on Total Pet and each industry segment in terms of share of sales as well as a 3 year history of each of the Racial/Ethnic Minority segments.
In the graph showing market share of Total Pet, as well as those that follow, the overwhelming dominance of White Americans in terms of spending on their pets is all too apparent.
- Performance = Share of Spending/Share CU’s: Hispanic – 47%; Asians – 45%; African Americans – 29%
- This reinforces the probable low level of Pet ownership among African Americans.
- With the exception of a big drop in Total Pet Spending by African Americans, all other groups showed an increase.
- While the $ amount is small, the 18.7% increase by Asians could be significant. We’ll see where it comes from.
- Spending History – From 2013 to 2015, U.S. Total Pet Spending increased $10.0B (+ 17.3%). During the same period, Minority Spending fell $0.75B (-8.6%).
- Overall, Total Minority groups showed a decline each year.
- African Americans had a big increase in 2014, but then “gave it back” in 2015. They are basically even with 2013.
- Hispanics had a huge decline in 2014, but made a partial comeback in 2015. However, it was not enough. They are $0.89B (17.7%) down from 2013 spending.
- Asian spending dipped in 2014 but bounced back in 2015. They are 10% “ahead” of their 2013 total.
- Without the two massive drops, Hispanic in 2014 and African Americans in 2015, the numbers would be positive.
Bottom Line: Pet Spending is not making progress with Minority Groups. Now, the individual segments…First Food.
- Performance = Share of Spending/Share CU’s: Hispanics – 49.0%; Asians – 46.1%; African Americans – 27.0%.
- All groups had an increase in Pet Food Spending in 2015. The increases by Asians and African Americans were especially significant. The Asians increase may be a food upgrade, but both are maintaining and possibly adding pets.
- Spending History – From 2013 to 2015, U.S. Pet Food Spending increased $6.54B (+ 28.5%). During the same period, Minority Spending increased $0.13B (+3.9%)
- Asians are the only group with an increase in both years.
- This “need” segment doesn’t reflect the overall U.S. growth but it is at least relatively stable. Now, Supplies.
- Performance = Share of Spending/Share CU’s: Hispanics – 69.4%; Asians – 38.0%; African Americans – 28.0%.
- Hispanics were one of the few Demographic segments in any category to have an increase in Supplies spending.
- The decreases from Asians and African Americans were small in $, but a 20% decrease is still significant.
- Spending History – From 2013 to 2015, U.S. Pet Supplies Spending fell $0.07B (- 0.5%) – Essentially Flat. During the same period, Minority Spending increased $0.16B (+8.2%)
- Hispanics’ consistent growth in Supplies in conjunction with stable Food Spending is a good Pet Parenting sign.
- The Supplies Segment is largely “discretionary” so spending is often impacted in groups with financial pressures.
- Asians have the least income pressure so it makes a small spending cut due to a Food Upgrade more plausible.
Now, we will turn to the Service Segments. We’ll begin Non-Vet Pet Services.
- Performance = Share of Spending/Share CU’s: Hispanics – 49.3%; Asians – 45.3%; African Americans – 26.7%.
- This segment is generally discretionary spending so income and convenience generally matter.
- For the Hispanics, with big families and everyone working, the convenience of services becomes a real “need”.
- Spending History – From 2013 to 2015, U.S. Pet Services Spending increased $0.98B (+ 18.6%). During the same period, Minority Spending increased $0.03B (+4.2%)
- Growth is minimal and considering the increase in CU’s, all groups are losing market share. Now, Veterinary.
- Performance = Share of Spending/Share CU’s: Asians – 50.9%; African Americans – 32.2%; Hispanics – 23.4%.
- Income and education are big factors in Veterinary Spending. Whites and Asians had the only increases.
- Spending History – From 2013 to 2015, U.S. Veterinary Spending rose $2.56B (+17.6%). During the same period, Minority Spending decreased $1.05B (-39.6%).
- This Demographic category illustrates the impact of the ongoing high inflation in this segment, especially among the Hispanic group. Financial pressures forced them to make a choice. They chose to spend their Pet $ on Food, Supplies and even Services at the expense of Veterinary.
Comments
One thing that we should always keep in mind is that all these numbers are averages. These Racial/Ethnic Groups are made up of individuals and are represented in virtually all Demographic Category Segments. Examples: 9% of all people with a Master’s Degree or higher are African Americans. 5% of the CU’s with an income above $200K are Hispanic.
However, overall, these rapidly growing racial/ethnic groups are not keeping pace with U.S. Pet Spending. In fact, they are losing ground…at an alarming rate. Consider this: Minority spending on Pet Products, just Food & Supplies, went from $5.3B in 2013 to $5.6B in 2015 – a $0.3B (5.0%) increase. At the same time, the number of minority CU’s increased 4.9%. So, all of this increase essentially came just from having more CU’s. At the same time, the White segment had a $6.2B (19.0%) spending increase with only a 1.1% increase in CU’s. The Result: The Total Minority Group’s market share of Pet Products spending fell 10% in just two years, even with a 5% increase in spending.
Asian Americans come from a variety of cultures, each with their own history regarding Pet Ownership. They certainly have the income and recent increases in Pet Food spending indicate the number of Asian Pet Parents may be growing.
Hispanics and African Americans are the two fastest growing groups and they share certain key characteristics. Their income is 20-30% below the National Average. Homeownership is 25-33% less. They are more likely to live in Center City areas. All these factors tend to reduce Pet Spending and ownership. The African American group has the lowest numbers in these measurements and a low percentage of Pet Households. The Hispanic group has another characteristic which is relevant to spending – kids. Having twice as many children under 18 per CU can only add to their financial pressures.
Most of the factors reducing Pet Spending are societal rather than just industry issues. However, the Pet Parenting desire still appears to be strong in these groups. We see it in Hispanic Spending on Food and especially Supplies. Also, despite having the lowest average income, African Americans still spend more on Veterinary than any other minority. The Pet Industry should recognize the situation as both a challenge and an opportunity. We need to do what we can to encourage and facilitate Pet Parenting in these groups. It will pay “dividends” to everyone.


