Petflation Update: August 2015 – The Good, the Bad and the…???

There was pricing turmoil early in the year. However, things calmed down in May and June with the Prices in all segments showing moderate increases. That set the stage for July…with a record 1.95% drop in Food prices bringing the CPI for the total industry down. What would August bring? Remember, it’s the Pet Industry. It’s always interesting.

In August Supply prices turned up and now seem to be on a positive path for the year. This was welcome news. The Service Segments are usually quiet in the Summer Months with little or no movement in prices…not this year. They both moved sharply upward. This actually mitigated another drop in Pet Food prices and prevented the prices in the Total Industry from falling for a second consecutive month.

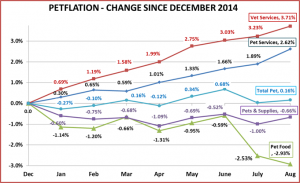
Here’s what 2015 looks like so far…

AugCPI-15-1

SPECIFICS ON CPI CHANGES

Veterinary Services

  • August – Up ↑ 0.46% (Last year August went Down ↓ -0.05% – basically flat)
  • Year To Date: Up ↑3.71%

NonVet Services

  • August – Up ↑ 0.71% (Last year August went Up 0.06% – basically flat)
  • Year To Date: Up ↑2.62%

Pet Food

  • August- Down ↓-0.41%% (Last year August went Up ↑0.28% a bad change)
  • Year To Date: Down ↓-2.93%…Huge!

Pets & Pet Supplies

  • August- Up ↑0.34% (Last year August went Down ↓-0.89%…A Big PLUS!)
  • Year To Date:↓-0.66%…coming back!

Total Pet

  • August- Up ↑ 0.13% (Last year August went Down ↓-0.11% – All segments but Food are up.)
  • Year To Date: Up ↑0.16% – Looks to stay positive.

OBSERVATIONS

  • Food prices turned down in January but looked to be making a comeback in May & June… then the bottom dropped out of prices over the last 2 months.
  • Supply prices turned up – over a 1.2 % turnaround versus last year.
  • Veterinary and Non-Veterinary services are generally flat this time of the year. They were actually down in August of 2014. That makes this year’s increase even more significant.
  • The Total Pet Market Prices turned positive and should stay there. The unexpected increase in the Service prices…and Supplies counteracted the continuing drop in Food. The biggest concerns..Deflation in Food…Inflation in Veterinary Services.

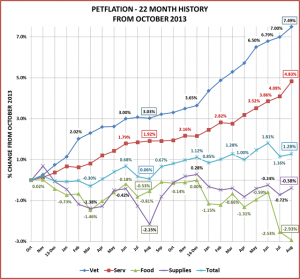
Next, let’s look at the monthly history over the last 22 months to put this month’s data into perspective. August of 2015 and August of 2014 are outlined so you can see the journey over the last 12 months.

AugCPI-15-2

COMMENTS

August is usually flat except for Supplies. This year it was very volatile. Service Prices had a big increase and Food continued down. This graph makes it easy to see how 2 negatives can create a seemingly positive situation as overall Total Pet prices are up 1.2% versus a year ago.

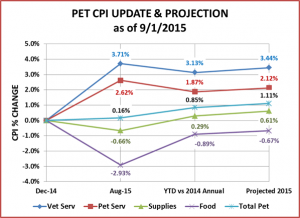
The chart below consolidates key data and compares the 2015 YTD CPI to the 2014 annual CPI. It also includes an updated projection of the annual CPI change for 2015. September and/or December could produce a drop in Food and/or Supplies but October & November are generally up…across the board.

AugCPI-15-3

COMMENTS – BY INDUSTRY SEGMENT

Pet Food – What can you say? The price deflation in this largest segment is the biggest news and the biggest concern in the industry. July saw the biggest single month price drop in history…-1.95%. One could expect a rebound in August which is generally the start of the “normal” Fall rise in Food prices, but food prices continued to fall. Prices are now down -2.93% since December. Right now Pet Food prices are basically equal to 2012 – three years ago. There is simply not enough time left for a recovery, so 2015 is projected to be the second consecutive year of deflation in Pet Food…down -0.67%.

In some segments, like Supplies, where much of the spending is discretionary, deflation can spur increased spending. However, buying Pet Food is not discretionary it’s a necessity which is purchased on a regular basis. Therefore, the consumer is much more likely to be influenced by retail price. Unfortunately, lower prices don’t result in an overall increase in sales. They just increase the competitive pressure on Manufacturers and retailers as the consumer searches for value.

Pets and Pet Supplies – Although prices are down 0.66% since December, we need to remember that 2014 was unusual. December was the pricing peak for the year. That usually occurs in November. We are 0.29% ahead of last year’s overall pricing and that should improve. We may still see price drops in September and even December but we’re looking at a projected increase of 0.61%

Perhaps the deflation caused by commoditization has “bottomed out”. Let’s hope so. Long term deflation is a tougher problem to solve than excessive price inflation. It’s also not solved in just one year. The segment will need moderate increases for several consecutive years.

NonVet Services – Prices have been growing steadily since April. They usually flatten out in the Summer months but not this year. In July prices went up and then August brought an even bigger jump of 0.71%. We now expect prices to increase 2.12% in 2015 but they could go higher. In 2014 they increased 2.9%. This can slow the segment’s overall growth and limit it to higher income households.

Veterinary Services – The Veterinary Services Segment is projected to be Up 3.44% in 2015. Last year prices increased 3.5%. The segment continues to grow but the increases are coming from the high income Pet Parents – $120K and above.

Total Pet Market – (The Good) Supplies appear to be turning around the deflation pattern that has persisted since the recession. (The Bad) The huge Food segment is now the biggest concern. With prices continuing a precipitous drop in August, a second consecutive year of deflation is virtually a sure thing. Deflation puts tremendous pressure on manufacturers and retailers and there is no easy fix. The Service Segments – Veterinary and Non-Vet have the opposite problem… as prices continue to spiral upward. The price deflation in the Food segment will not produce increased overall purchases because of the nature of the products but the high inflation rate in services can result in decreases in the amount of services or limiting their market appeal to higher income groups.

(The ???) The Total Pet Market is now projected to have a 1.11 increase in prices in 2015. This looks pretty good, even healthy and would indicate that the bulk of the Industry’s growth this year will be a “real” increase. However, as we have seen, it is being generated by 2 big negative, but opposite situations in Pet Food and Veterinary Services. Supplies and hopefully Non-Vet Services seem to be “coming around” to more acceptable levels but we need the other two to change their current courses.

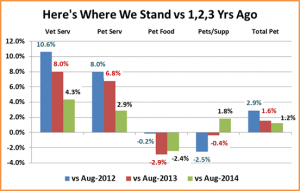
This last chart should make it easier to compare the up/down performance of each segment:

AugCPI-15-4

The turnaround for Supplies is readily apparent. You can also see the big deflation problem in Food over the last 2 years but especially in 2015. Of course, the sharply rising prices in the Service Segments are a big contrast to the Product Segments. In terms of pricing, the Pet Industry has been in turmoil for the last 2 years…but you would never know it if you just looked at Total Pet numbers.

U.S. Retail Market – 2015 Midyear Update: The Race for the Consumers’ $$$?

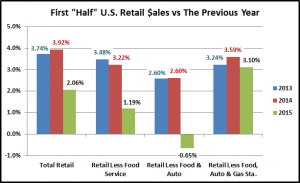
How much is the U.S. Retail business up through June? Yes, the question is not if…but how much? Since 1992 only 2009 generated a decline over the previous year in the first half and in the annual numbers. Here is another question…which part of the Retail Market is most relevant to our industry?  Take a look:

15-JulRtl1

  • Restaurants (Food Service) – are having a good year, up↑8.97%. However, they are not really relevant. They are 12% of the Total and removing them lowers the increase to 1.2%, almost half.
  • Automobile Sales – are also doing well, up↑7.43%. These big ticket items are also not very relevant in the Consumer Packaged Goods business and they are 21% of the total. When you remove Auto and Food…the numbers go negative! Down ↓0.65%. What is driving this Drop?
  • Gas Stations – ↓Down 20.7% from a year ago. Motor Fuels account for over 80% of the total revenue of gas stations. Gas prices are down 29% from the first half. The oversupply is a conscious effort to reduce competition from alternate sources. Gas Stations are also not really relevant to our industry. That leaves us with…
  • Retail, Less Food, Auto and Gas – Up 3.1% to $1.5 Trillion in the first half of 2015. This is 58.4% of the total U.S. Retail market and it is growing 50% faster than the Total…and Very Relevant!

Before we look at individual channels, let’s look at recent overall 1st half performance:

15-JulRtl2

Regardless of how you look at it, the first half of 2015 was not as robust as the past two years. In the “best” case in the graph, the rate of relevant U.S. Retail growth is 14% less than in 2014. However, the graph does give us a benchmark to measure the performance of specific retail segments. If their growth exceeds 3.1%, then they are gaining market share. If it is less than 3.1%, they are losing market share…even if sales are up! Let’s look at how the major retail segments are doing.

15-JulRtl3

These are large slices of the U.S. Retail pie. Three divisions – General Merchandise Stores, Food and Beverage and Non-Store account for 58.3% of the total market. If you look back at our post on the channel migration of Pet Products Sales, you will see that in the 2012 these divisions produced 59.7% of total Pet Products sales. Consumers spend a lot of money in Pet Specialty Stores but Pet Products are also “on the shopping list” in the outlets where they spend most of their money.

Major Divisions of the market generally don’t show much movement in market share in just one year so the change in the General Merchandise Stores and Non-Store “Divisions” is very significant. Each of the major divisions includes a number of subsegments. General Merchandise includes Traditional Department Stores, Discount Department Stores, Supercenters and Clubs as well as $ and Value Stores. These specific retail channels often have far greater movement in share because this is the level that the consumer “views” in making their initial shopping choice.

Enough “overview”! Let’s look at the first half performance of some of the specifically “Pet Relevant” Channels to see which are doing the best…and worst in gaining consumer spending. We will use 2 separate graphs to illustrate the situation in these 12 Channels. The first will show the % change in sales in 2015 vs 2014. The next will “show us the money” by translating the % into $ gained or lost.

Then we will wrap it up with some observations by channel.

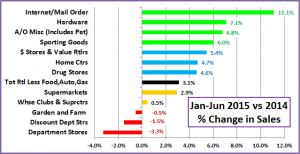
This first graph shows the percentage change in the first 6 months sales of 2015 versus the same period in 2014. Remember, we determined the “norm” to be an increase of 3.1%

15-JulRtl-4

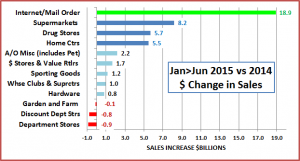
The leader is no surprise. It just reinforces what we all “thought”. Now, as promised, I’ll “show you the money!” For a reference, the Total increase from all Retail Channels –Food, Auto & Gas was $45B

15-JulRtl-5

The growth in the Internet is even more pronounced when you look at the change in $ spent!

 OBSERVATIONS

  • Internet/Mailorder – $188.8B, Up $18.9B (+11.1%). 42% of the total increase for the $1.5T Retail Market (1st Half Total) came from Internet/Mailorder. The Consumer Migration to this channel noted in a post documented earlier this year…is accelerating – gaining 0.9% in Total Market Share in just a year.
  • Super Markets – $287.2B, Up $8.2B (+2.9%) This largest subsegment is barely holding its own as it lost 0.1% in Market Share. Right now the major competition is from SuperCenters/Clubs. We’ll see if the Internet becomes a factor.
  • Department Stores – $25.7B, Down $0.5B (-3.3%). This segment is not particularly relevant to Pet but I included them as they are part of the best “visual” example of the channel migration of the U.S. consumer. 50 years ago they “ruled” the GM category. Then they started to slide as they failed to adapt to the changing wants and needs of the consumer. One small example of this is their failure to address America’s growing relationship with our companion animals.
  • Discount Department Stores – $48.4B, Down $0.8B (-1.5%). The rise of this segment started the downhill slide of Department Stores but their tenure at the top was brief as the SuperCenters/Clubs offered true 1 stop shopping.
  • SuperCenter/Club Stores – $208.4B, Up $1B, (+0.5%). These outlets with their broad mixture of grocery and general merchandise…at great prices quickly became a dominant force in the retail market. They are second only to Supermarkets in Retail Market Share. However, they “needed” to be up $6B in the first half of 2015. They lost 0.37% in Market Share, one of the biggest drops of all the U.S. Retail Channels.
  • $ & Value Stores – $32.4B, Up $1.7B, (+5.4%). – A Great Value and easy to shop. The growth in this segment is visible proof that American consumers want Value AND Convenience.
  • Drug Stores – $128.4B, Up $5.7B, (+4.6%). 60+% of revenue comes from Rx Drugs. The growth in this segment is largely due to a 5.4% Increase in Rx Prices over the same period in 2014.
  • Sporting Goods – $20.7B, Up $2.3B, (+6.2%). A minor player in Pet, this segment enjoyed a strong first half in 2015.
  • Home Centers – $122.5B, Up $5.5B, (+4.0%). These “project driven” outlets have never done a significant Pet Business. Their growth is tangible evidence of the recovery from the recession.
  • Hardware – $12.0B, Up $0.8B, (+7.1%). Exceptional strength in this minor Pet segment. Once again evidence of ongoing economic recovery.
  • Farm and Garden Stores – $25.2B, Down-0.1B, (-0.5%). This segment had been showing growing strength in both Pet and Total sales. Spring is their largest “lift” season. We’ll have to wait until yearend to see if this year’s drop was an anomaly or reflective of an overall trend.
  • A/O Miscellaneous Stores $34.0B, Up $2.2B, (+6.6%). Florists, Pet Stores, Art Dealers…there are several segments bundled into this group. Based upon detailed data from the 2012 Economic Census, Pet Stores probably account for about 25% of this segment. With few large “chains”, this growth speaks well for “smaller” U.S. Retail Businesses…at least in the first half of 2015.

Now let’s wrap it up with a brief summary…and provide you with the detailed data for future reference.

SUMMARY 

There is no change at the top. Supermarkets remain the largest Retail Channel, followed by SuperCenters & Club Stores. The Internet/Mailorder segment is growing even faster than anticipated. Gaining 0.9% in Market Share in a $3T annual market in 1 year is definitely fast. However, this is just the first half. We’ll see if this Channel can maintain this pace for the whole year. If the current trends do continue, Internet/Mailorder could take over the #2 position in the U.S. Retail economy in as little as 2 years. You also have to wonder what will happen when the internet turns its attention to grocery items.

There are other notable points that relate to the Pet Industry  – the continued growth of the $/Value Stores and the unexpected strength in the A/O Miscellaneous Channel.

Bottom Line: The U.S. Retail Market is evolving as the consumer migrates to the channels which best fulfill their current wants and needs. To survive and prosper, you must identify those needs and adapt.

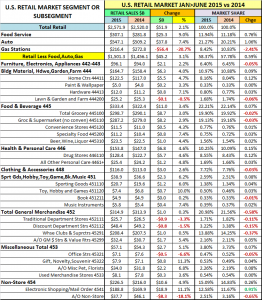
Here are the details:

2015-JulRtl-6

Contact me if you would like an Excel version of this detailed data!