Petflation Update – CPI in July

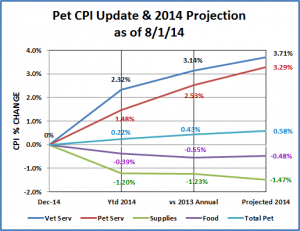
The latest CPI data for July is out. Services prices are up. Food and Supplies prices are down. This is pretty normal for July. The details are:

    • Vet Service CPI – up 0.1% over June – no surprise.
      • Up 2.3% since Dec
      • Projected – Up 3.71% for year. (last month’s projection was 3.73%)
    • Pet Services – up 0.1% over June – as expected
      • Up 1,5% since Dec
      • Projected – up 2.39% for the year (last month’s projection was 2.23%)
    • Pet Supplies – down -0.9% from June – Normal to drop in July
      • Down -1.2% since Dec
      • Projected – down -1.47% for the year (last month’s projection was -1.55%)
    • Pet Food – down -0.6% from June – Normal for prices to drop in July but this is greater than usual.
      • Down -0.4% since December
      • Projected – down -0.48% for the year (note: last month projection was -0.39%)
    • Total Pet – down -0.5% from June – Not normal – If dip occurs, it usually comes in June
      • Up 0.2% since Dec
      • Projection – up 0.58% for the year (down about 0.2% from last month)

Here’s what it looks like along with updated annual projections:

Cpi-Update8-1-14

For the balance of the year:

  • All Service prices usually drop in August then turn upward for the balance of the year…with 1 slight dip in Veterinary prices, usually occurring in November.
  • Food prices should start back up every month until the annual December drop
  • Supplies should start a “roller coaster” ride. Prices should go up in August, then fall to the lowest level of the year in September. October and November should bring rising prices…with a big drop in December.

However, it’s not a normal year. As you can see August should be a pivotal month. That CPI will be issued when we’re at the Total Pet Expo. I’ll do an update shortly after that.

My biggest concern is what’s happening in supplies. It appears that the consumer may have significantly changed their buying view on supplies during and since the recession. Prices have fallen since late in 2009 and this may be an indication that the segment is being systematically commoditized – a category at a time.

The chart below shows the CPI history for human apparel and toys – two categories that have largely become commodities and have parallels to a lot of the Pet Supply categories.
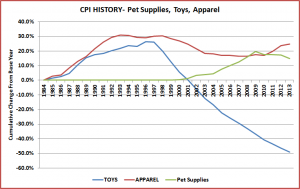
SuppliesApparelToys-Graph
The Human Toy segment has truly become a commodity. Prices have dropped precipitously since 1997…over 60%. In terms of National Pet Toy Specialty retailers, only Toys R Us still exists. The vast majority of the business is now in discount stores and the internet. Wal-Mart is the largest toy retailer, with a 30+% market share.

The CPI period from 2009 to 2013 in Pet Supplies closely resembles the period from 1992 to 2000 in Apparel. This Human category has been commoditized in the clothing segment. The effect on the overall Apparel CPI has been mitigated because pricing in the shoe segment held its ground through 1998. However, the pricing in the overall Apparel market is now still 4% below what it was in 1997.

I don’t know how you feel, but neither of these other category “models” seems very appealing to me.

In my next post,
we’ll take a look at the overall consumer buying behavior today and how that relates to the Pet Supplies segment.

Pet Supplies – What is driving the consumer – now?

By late 2010, surveys indicated that 93% of consumers had changed their shopping habits because of the economic downturn. (Time 11/1/12)

  • After the recession, 64% of consumers now agree with the statement “Brand names are not better quality.” And it follows that if brand names do not represent better quality, why would it be worth paying more for them? (Time 11/1/12).
  • Only 25% of Americans say that brand loyalty impacts their buying behavior. (Forbes 3/26/12)
  • Price (89%) and quality (82%) are the highest factors in buying decisions. (Forbes 3/26/12)
  • 65% of shoppers note that a high level of variety is an important buying factor.(IRI 8/25/09)

The behavior of a customer/consumer has indeed changed beyond all recognition which means forget what you think you know, forget the past. That’s all gone for good. (Forbes 3/26/12)

In the “prolonged new normal”, “value – encompassing attributes such as convenience, price, health and quality – will win.” Products and brands that deliver a strong value proposition have a better chance for success. (A.C. Nielsen 8/6/14)

The Pet Industry has achieved spectacular growth by building on – not exploiting, America’s growing commitment to our companion animals. In 1989 when I came into the industry, dogs and cats were pets. That is no longer true. Now they are valued members of the family.

We achieved growth through the expanding consumer base, but also by producing ever better products and services – time after time, year after year – New products and improvements that helped enhance the lives of animals and their people “parents”. Healthier, safer, easier…and yes, more fun, these were the driving forces in the industry. It was all about recognizing and fulfilling the consumer’s needs through thought, timely innovation and a concerted effort.

What is the current situation? Since an American household is now twice as likely to have a pet than a child under 18, Pet Supplies are found in virtually every retail channel – Food, Drug, Discount, Club, Sporting Goods, $ Stores, discount clothing outlets…you name it, they’ve got Pet. Not only that, but the major retailers have pet products with their own private label and/or a non-pet related licensed names.

What about private label? This concept first gained real traction in the late 70’s. It started as generic but soon morphed into “store brands” – private label. The appeal was higher margins for the retailers and lower prices for the consumers in products that are bought on a regular basis (commodities). At first, there were quality issues but the consumers taught the retailers quickly. Value = price + quality. The retailers improved the quality and started to expand their private label offerings to a multitude of categories. Remember, they make more money!

How did Pet Supplies get into this private label situation? Consider this:

In 2009, IRI noted that Private label growth is best in commodity-driven categories without a dominant national brand and with relatively low innovation. A specific target category noted in their report was – PET SUPPLIES (IRI 8/25/09)

A variety of research sources have found that consumer buying behavior has changed during and after the recession. I would say that a more accurate way to put it is, “After 40 years of lessons, consumers finally get what we have been teaching them.” Brand does not matter in commodity items.

How did sub-categories in the Pet Supplies segment become commodities? We did it. “Me too” companies marketing products pulled from the same showrooms in China flood the market. Don’t get me wrong. Most are quality products. That’s a major factor. To the average consumer, there is no difference in quality or function between products sold at a pet chain and products sold at a discount department store. If this is the case, then the best price is the best value…and the best choice.

At the same time, true functional innovation has slowed as noted by IRI. If manufacturers must focus on price in an attempt to maintain their current market share, then innovation must take a back seat. It’s also hard for small entrepreneurial creators to get noticed in a flood of products in every category. Policies such as “vendor consolidation” make it even more difficult for unique, new ideas to get to market.

Vendor consolidation is my favorite commoditizing policy. You absolutely can’t argue with it from an accounting viewpoint. It is cheaper to do business with fewer companies! However, you must also believe that all important innovation comes from larger companies. If you look at the history of American business, nothing could be further from the truth. Based upon that, Bill Gates and Steve Jobs should have stayed in their garages. After all, we had IBM for all our computing needs!

Vendor Consolidation is “short term”  thinking which can affect the whole industry. Companies would be better served, long term, with creating a “new vendor days” program which makes it easier for inventors to showcase new ideas.

Let’s sum it up:

American Consumers are looking for:

  1. Value (Value=Price + Quality)
  2. Convenience (Anything that makes the pet parenting experience easier)
  3. Selection (Americans need variety, choice)

What do we need to do?

Manufacturers must provide products that meet these requirements and focus on innovation in function and design, Got great products? Don’t rest on your laurels. Make them better – demonstrably. Identify a consumer need and find a way to fill it. Innovation is the only pathway that leads away from “commodity”….However, innovation is not the end of your journey. To reach the consumer, you still need to market your products properly, in today’s environment…

This is definitely easier said than done. I guess we’ll see what “we’re made of”.

What’s the “best” month to buy Pet Products?

What’s the best month or worst month to buy Pet Products and Services…in terms of price?

In consumer product categories, prices often go up and down from month to month. On a graph, it looks a lot like a roller coaster. The USBLS has been tracking the monthly CPI for the Pet Market and its segments since 1997. I decided to take a look and see if any patterns emerged…

There was a lot of detail…to say the least – 198 months of data for 4 segments, 2 combined groups and the total market. When you take a step back, the whole record seems to basically be divided into 3 eras:

  1. From 1998 to 2006 – This was a strong growth era of our industry and a gentle roller coaster of gradually rising prices. Prices went up a total of 29.5% in 9 years. An average year had 9 months with increases and 3 months with drops.
  2. From 2007 to 2009 – This was a time of steeply rising prices. There was an overall increase of 19.5 % in prices in just 35 months – without a single monthly drop. Coinciding with an economic recession, we saw the consumer impact of this. Our retail sales still went up – but consumers bought less and less in terms of the amount of goods and services.
  3. From 2010 to 2013 – In general, we have moved back to the gentle rollercoaster with overall prices moving up slowly again – 6.5% in 4 years – with an average year having 9 months with increases and 3 months with drops. However, there may be lingering effects in this recovery as supply prices continue to drop in a roller coaster ride which is generally headed downhill.

Based upon this overview, I decided to take a detailed look at the years from 2010 to 2013. This seems to provide the most relevant period to answer the current question, “Which is the best or worst month to buy Pet Products?”

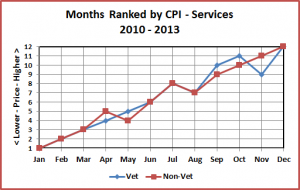
As you might imagine, the “right” month to buy depends on what you are in the market for. Let’s take a look first at Services – Veterinary and Non-Veterinary. Here’s how the months ranked:

MonthRankGraph-Serv

Service Segments – The prices in both these segments have gone up unchecked at a high rate since they were first measured in 1997. Veterinary Services have actually had only 13 monthly CPI decreases in 198 months of measurement. With only dips in 2 months during the year, the flippant answer to “When is the best month to buy any Pet Services?.. is…last month.” The actual answer is… January has the lowest prices and December has the highest in an average calendar year.

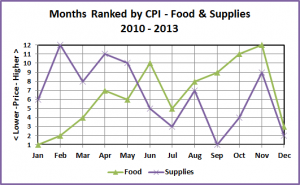
Now let’s take a look at the product segments – Pet Food and Pet Supplies. Here’s how the months ranked:

MonthRank-Graph-Prod

Pet Food and Pets & Supplies – This is a bit more interesting.

Pet Food prices generally rise through the first half of the year, drop in July, start to rise again, peaking in November…then fall radically in December. Of course, Food is an absolute necessity so the consumer must buy according to need. However, prices are lowest in the winter months – December through February. Officially, the cheapest month in the calendar year is January and the priciest is November.

Pets and Supplies – Now you can see a “roller coaster. In general, prices are higher from February through May. They generally are lowest in the late Spring through the Summer months, hitting bottom in September. They start to build again as the Holiday season approaches, peaking in November. Then like food prices, they drop like a rock in December. So much for “black Friday”. Consumers should hang on. The odds are that the prices will drop as Christmas nears. The most expensive month is February and the cheapest is September…followed closely by December. The Holiday lift is of paramount importance in this segment. From the consumer’s view, they should buy early or buy late.

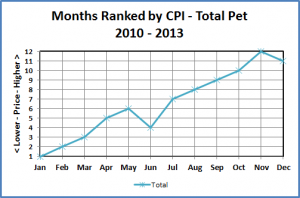
Here’s what the Total Pet Market looks like:

MonthRank-Graph-Totl

Total Pet Market – This looks pretty boring and there is no “roller coaster”! How come?

The 4 year average gets flattened out by several factors. Three of the 4 segments, all but supplies, are generally moving upward in price as the calendar year progresses. While the years all have an average of 3 months with price dips they are almost always in different months. The Total CPI increase in 4 years was only 6.5% so the monthly changes are usually small. In general, the Total Pet market is similar in pattern to the largest segment – Pet Food.

The overall best (cheapest) month to buy Pet Goods and Services in our analysis is the first month of the year – January. The worst is November – not December, thanks to annual price drops in both Food and Supplies. The Supply segment has the biggest monthly variation and the highest percentage of discretionary spending. It also traditionally has a large Fall/Holiday lift. The most important consumer “take away” from this analysis is probably – “Buy early (September) or buy late (December)”.

Will prices peak again in November? It seems likely as a December drop in Food & Supplies prices has occurred 5 years in a row. November has also been the priciest month 4 years in a row and finished no worse than second in this dubious contest for 14 out of 16 years. However, it is an unusual year as both Food and Supply Prices are down for the YTD for the first time since 2010 and…prices in the Total Pet Market actually dropped in January for the first time ever.

Pet CPI Update – Eh, What’s up Doc?…or down?

The U.S. Bureau of Labor and Statistics released their June CPI numbers while most of us were off at SuperZoo. In my recent posts we have seen that changes in the CPI can affect consumer behavior when they are outside “expectations”.

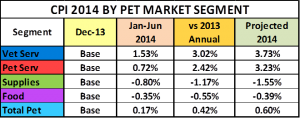
Let’s take a look at the 2014 first half CPI numbers by market segment and compare them with:

  • Year end 2013 (Dec) – What’s happened this year to date
  • vs 2013 Annual numbers (Note: The CPI is measured every month. The annual number is simply the average over the 12 month period)

Then I’ll look in my crystal ball (and at history) and take a shot at predicting the annual change for 2014.

Here is the math:

CPIUpdate-14-Chart

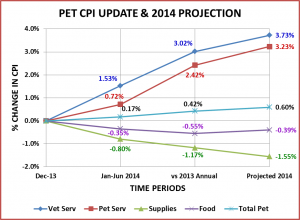
Here is the visual representation:

CPIUPDATE-14graph

OBSERVATIONS & RECAP BY MARKET SEGMENT

Veterinary Services – Prices UP 1.53% since December; UP 3.02% over the 2013 average number.

  • Veterinary prices go up every month like clockwork. The USBLS has measured the Vet Services for 198 consecutive months and prices have dropped in only 13 individual months over that whole period – almost all were less than 0.1%.
  • Based upon history, I project that prices in this segment will be up 3.73% in 2014 over the 2013 annual number. In my initial projection from my blog on the period from 2009-2014, I used a CPI increase of 2.6% which was equal to the previous year. This year’s increase is now projecting to be 43.5% GREATER than expected.
  • Even if this segment hits the projected retail number of $15.25B, over 60% will come as a result of price increases. Moreover, the adjusted growth (factoring out price increases) for the period from 2010 > 2014 will be a total of 2.0%…or 0.5% per year.
  • Rising prices have basically stagnated the Veterinary Segment in terms of growth in the amount of services sold. It appears that this trend is continuing.

Non-Veterinary Pet Services – Prices UP 0.72% since December; UP 2.42% over the 2013 average number.

  • Prices have also consistently gone up month after month in this segment, although not as fast as the Veterinary Segment.
  • Based upon recent history, I project that prices in this Service segment will be up 3.23% in 2014 over the 2013 annual number. The previous year’s increase was 2.1% which was used to estimate the 2014 adjusted growth numbers. This increase is 53.8% GREATER than last year’s.
  • Over 44% of this year’s growth will come from price increases…if they can hit the projected number.
  • Unlike the other segments, Pet Services has not yet hit a “price wall” triggering reduced use by consumers. We’ll see how long that this continues.

Pets and Pet Supplies – Prices DOWN -0.8% since December; DOWN -1.17% from the 2013 average number.

  • Totally opposite from Services but equally concerning. This “deflation” began in 2010 and continues.
  • Based upon recent history, I project that prices in this Supplies segment will FALL 1.55% in 2014 from the 2013 annual number. The previous year’s decrease was -2.1% so it is a little better than last year. However, I used a decrease of -0.8% in my previous estimates. I had hoped that the ongoing deflation would flatten out. It is slowing but not to the extent we would hope.
  • Prices on Pets and Supplies have now dropped 5.5% since reaching their historical peak in 2009. That is an average annual deflation rate of 1.1%.
  • As long as the consumer keeps increasing the amount of purchases the segment is fine. The concern is the increasing pressure on the manufacturers and the distribution channel due to deflating prices.

Pet Food – Prices DOWN -0.35% since December; DOWN -0.55% from the 2013 average number.

  • This is a bit of a surprise – to me, at least. After the unique price drop in 2010, this segment had been operating with a regular CPI increase of about 2.3%.
  • Based upon the YTD numbers and history, I project that Food prices will FALL -0.39% in 2014 from the 2013 annual number. If Food hits the retail number of $22.62B the adjusted growth rate will be 5.3% – over twice the 2.5% adjusted growth that was expected with increasing prices.
  • Pet Food prices have fallen in only 1 other year (2010) since the CPI was first measured in 1998.
  • The prices in all segments rose strongly up through the recession in 2008-2009. The consumer reacted by buying less (amounts). A Drop in both Food and Supply prices in 2010 spurred a rebound in consumer activity. There is really no parallel in the current situation. The economy is not great but we are not in a recession. Prices in food have been growing at a manageable rate and consumer purchases were increasing at a regular rate. We’ll see if this is a short term anomaly or if Food prices have reached a price ceiling of some kind.

TOTAL PET – Prices UP 0.17% since December; UP 0.42% over the 2013 average number.

  • All Services are up more than expected and both Food and Supplies are down, basically flattening the pricing in the total Pet Market.
  • Based upon the performance in the individual segments, I project that prices in the Total Pet Industry will be up 0.6% in 2014 over the 2013 annual number. This is equal to the smallest increase of all time which occurred in 2010 and is only 35% of the average annual increase in the years since then. If the increases in the services weren’t greater than expected, we would be projecting a CPI increase of only 0.4% for the total industry – the lowest in history.
  • How does the YTD Pet performance compare to other Categories? Two that we relate to are:
    • The Overall CPI – which is up 1.4% since December
    • Food & Beverages – which is up 1.2% since December
    • Our overall increase of 0.6% is less than half that of these key indicators.
  • The last time we had this low of an increase in the CPI the price drops in Food and Products helped boost us out of declining consumer activity in a recession. There is no recession now. Consumers were accepting moderate prices increases in Food and the segment was growing. The continued low prices for supplies was actually still generating consumer purchases in increased amounts. The pricing in both of the Service segments is still growing at a concerning rate – with seemingly no impact on the Pet Services segment but a stagnation in the quantity of Veterinary Services. Prices always go up for both of these segments in the second half so the increases will continue. The big concern now is the continuing deflation in the supplies segment and the sudden drop in food prices which is contrary to the activity in the overall CPI and the corresponding “human” food & beverage category.

Many of you responded very positively regarding the info from my earlier CPI blogs. So when I got the USBLS info for June, I wanted to do a quick update. I assumed that it would be a simple checkpoint -“we’re halfway through”. It ended up being a bit more complicated.

We are into the second half of the year with anticipated strong holiday and fall/winter lifts in many categories. The pricing situation in all Segments is not as positive as we expected. Everyone in the industry needs to focus on efficiently maximizing their efforts in this critical time of the year. Then, we will just have to wait and see how it plays out in terms of the impact on the consumer and whether we meet or beat our forecasted numbers.

In my next Post, we’ll try to answer the consumer question, “What is the best (cheapest) and worst (most expensive) month to buy…?”