U.S. Retail Trade – 2017 $ales Update by Channel – Going for the Gold
The Total U.S. Retail Market in 2017 reached $5.75 Trillion dollars – up $235B (+4.3%). This is significantly better than last year’s (+3.2%). For this report, we will focus on the “Relevant Retail” Total – removing Restaurants, Auto and Gas Stations from the data. This segment totals $3.4 Trillion. We should also note that in 2017, Gas prices increased. As a result, for the first time since 2012, there was an increase in revenue in all these major segments
In a recent report we reviewed the 2017 sales performance of the Top 100 U.S. Retailers. That covered the “Headliners” but everyone can’t be a headliner. How are specific Retail Channels performing? We’ll start with a market overview and then work our way down. (Base Data is from the U.S. Census Bureau Retail Trade Report)
Remember: This data is very relevant to the Pet Industry. According to the last Economic Census:
- Retailers other than Pet Stores generated 66.5% of all the Pet Products revenue in the U.S.
- Pet Products, on average, generated 1.94% of the total revenue of all non-pet stores that chose to stock them.
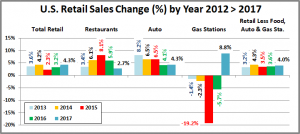
- Restaurants (Food Service) – 11.8% of Total Retail – Up 2.7%, which was less than half of last year’s (+5.9%).
- Automobile Sales – 20.7% of the Total – Revenue grew +4.3%, about the same as 2016 (+4.1%).
- Gas Stations – 7.9% of the Total – Up 8.8% from 2016. Gas prices turned up in March of 2016 and in 2017 showed their first annual increase since 2012. The result was a sharp increase in revenue.
- Retail, Less Food, Auto and Gas – Up 4.0% to $3.4 Trillion, better than last year’s +3.6% but less than the total market. This segment is 59.6% of the Total U.S. Retail market.
To put this year into perspective, let’s look at the overall performance in recent years.
The U.S. retail market has grown each year since 2012 but each segment has a different pattern. The low point for the total came in 2015 due to a precipitous drop in gas prices. However, with a big turnaround in gas prices the growth rate of the overall market has returned to more normal levels. Restaurant sales growth is an almost perfect pyramid. I wonder what 2018 will bring. Auto sales are still strong but the growth is definitely slowing. Our “Relevant Retail” Segment has been the most consistent. As expected, its 4.0% growth is below the 4.5% increase of the Top 100 Retailers. However, for the first time since 2012 it is lower than the total market. It will still serve as a benchmark as we review the individual channels. Above 4.0%, a channel is gaining market share. Below 4.0%, they are losing ground.
Now, we’ll slice up the U.S. “Relevant Retail” Channel “Pie”.
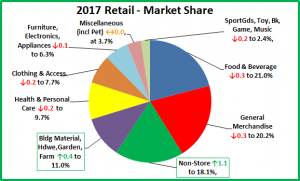
These are large slices of the U.S. Relevant Retail pie. Three divisions – General Merchandise Stores, Food and Beverage and Non-Store account for 59.3% of the total. This is up slightly from 58.8% in 2016. Once again, the increase is all due to Non-Store Retailers. The other two major segments continue to lose market share. All three are very important to the Pet Industry. Based upon the last U.S. Economic Census, these three major divisions produced 59.7% of total Pet Products sales. Consumers spend a lot of money in Pet Specialty Stores – 33.1% of their Pet Products $. However, they spend over 60% more in these 3 major retail channels. Pet products are “on the list” wherever the consumer shops.
Because they are so huge, major Divisions of the market generally don’t show much movement in market share in just one year so the changes in General Merchandise, Food & Beverage, Non-Store and Bldg Material are very significant. Each of the major divisions includes a number of sub segments. For example, General Merchandise includes Traditional Department Stores, Discount Department Stores, Supercenters and Clubs as well as $ and Value Stores. These specific retail channels can have even greater movement in share because this is the level that the consumer “views” when making their initial shopping choice. Change at this level is where any ongoing consumer shopping migration first becomes apparent.
Here is the Market Share change “Rule” for 2017: To gain 0.1% in Market Share your $ increase must exceed the amount generated by a 4.0% sales increase PLUS an additional $3.4B. Example: If a channel did $100B in 2016, they need to do $100 +$4.0 + $3.4 = $107.4B to gain just 0.1% in 2017 share. You will see channels with revenue increases that still lose share because the increase was less than 4.0%. It shows that even small changes in share are significant.
With that overview, we’re ready to drill deeper into the data. Let’s look at the 2017 performance of some of the specifically “Pet Relevant” Channels to see which are doing the best…and worst in gaining consumer spending. Eleven of the twelve were chosen because they generated at least 1% of the Total Pet Products (food & supplies) spending in the last Economic Census – 2012. I have also included Traditional Department stores on the list. Even though they have never truly embraced Pet Products, they have long been a fixture in the U.S. Retail Marketplace. Their continued decline, as consumers migrate to outlets which better fit their needs, has profoundly affected U.S. retail shopping as generally they were the “anchor” stores for the Shopping Malls across America.
We will use 2 separate graphs to illustrate the situation in these Pet Relevant Channels. The first will show the % change in sales in 2017 vs 2016. The next will “show us the money” by translating the percentages into $ gained or lost. Then we will have observations on each segment.
Remember, you must be up at least 4.0% or you’re losing market share!
The leader and #3 are big surprises. 9 of these pet relevant channels are showing increased sales. However, regarding market share, they are evenly split – 6 gaining, 6 losing. The market share losers include the traditionally largest channels. In the next chart, we’ll “show you the money!” Remember, the Total increase for the “Relevant Retail” Market was $132B and you must be up 4.0% PLUS $3.4B just to gain just 0.1% in Market Share.
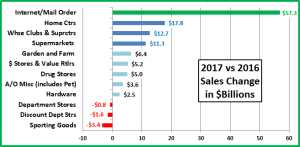
The growth of the Internet is obvious. However, 3 channels are a bit of a surprise. The revenue from Home Centers has been growing in recent years, but Hardware and Garden/Farm Stores have been flat. What happened in 2017 to spur this growth? The answer is… bad weather. In 2017 we set a record for weather related property damage – over $300B. This “smashed” the old record of $200B set back in 2005. Consumers turned their time and resources to repairing their homes. The trend may be continuing into 2018 and even showed up online. Recently, Amazon Prime Day registered a 200% increase in sales of products in the Home Improvement category. We have seen that changes in the retail environment affect businesses. It turns out that changes in the actual environment can also have a major impact.
OBSERVATIONS BY CHANNEL
(Note: % of Total Business from Pet Products for stores that stock Pet)
- Internet/Mail Order – $545.0B, Up $57.3B (+11.7%) – 43.5% of the total increase for the $3.4T Relevant Retail Market came from Internet/Mail Order. The Consumer Migration to this channel continues – gaining 1.1% in Market Share. They passed SuperCtrs/Clubs in 2016. Now, they have set their sights on Supermarkets. (1.2% Pet)
- Super Markets – $609.6B, Up $11.3B (+1.9%) This largest sub-segment continues to lose ground as it is down 0.4% in Market Share in 2017 and 0.6% since 2015. The Internet/Mail order channel has recently put increased focus on grocery products and is pushing very hard to become the leading retail channel. (1.6% Pet)
- Department Stores – $54.1B, Down $0.8B (-1.5%). Their decline is slowing but 50 years ago they “ruled” the GM category. However, they failed to adapt to the changing wants and needs of the consumer. One small example of this is their failure to address America’s growing relationship with our companion animals. (N/A Pet)
- Discount Department Stores – $96.2B, Down $1.6B (-1.7%). The rise of this segment started the downhill slide of Department Stores but their tenure at the top of GM was relatively brief as the SuperCenters/Clubs offered true 1 stop shopping. Now, they have the Internet to contend with – not a good outlook. (2.3% Pet)
- SuperCenter/Club Stores – $463.0B, Up $12.7B, (+2.8%). These outlets, with their broad mixture of grocery and general merchandise…at great prices, quickly became a dominant force in the retail market – second only to Supermarkets in Market Share for many years. In 2016 they were passed by the internet. Consumers still like them as their sales are still growing, but not enough. They continue to lose market share – Down 0.15% (2.4% Pet)
- $ & Value Stores – $78.6B, Up $5.2B, (+7.1%). – A Great Value and easy to shop – 2 of U.S. Consumers’ major “wants”. This segment has shown steady growth in recent years and got even stronger in 2017. (4.3% Pet)
- Drug Stores – $276.9B, Up $5.0B, (+1.9%). There is a lot of turmoil in this segment. Intense competition has led to large mergers and acquisitions which have slowed growth. (0.3% Pet)
- Sporting Goods – $44.7B, Down -$2.8B, (-5.9%). A Minor player in Pet. The turmoil in the category continues with mergers and store closings. (N/A Pet)
- Home Centers – $287.3B, Up $17.8B, (+6.6%). These large, “project driven” outlets have never done a significant Pet Business. The top 2 retailers – Home Depot and Lowes, continue to drive the growth. (0.6% Pet)
- Hardware – $26.1B, Up $2.5B, (+10.7%). Consumers seeking to repair weather damage had a huge impact on this channel, turning sales sharply upward after years of slow or even flat growth. (2.6% Pet)
- Farm and Garden Stores – $51.0B, Up 6.4B, (+14.2%). This segment has been growing in recent years in both overall sales and in Pet but it was largely driven by Tractor Supply. The landscape weather damage that occurred in 2017 brought Garden Centers to the forefront of the increase in sales. (8.9% Pet)
- A/O Miscellaneous Stores $78.1B, Up $3.6B, (+4.8%). Florists, Pet Stores, Art Dealers…are typical of the segments bundled into this group. Pet Stores probably account for over 20% of the $ in this segment. These stores, whether chain or independent, tend to be small to medium in size. Their increase slightly exceeded the market so these stores, which focus on another consumer trend – a more personalized shopping experience, are “holding their ground” against the large format retailers and the internet. (Pet Stores 91%)
The chart below puts the Market Share of each of these segments for 2017, 2016 & 2015 in a visual format so that it is easier to appreciate the relative sizes. Growth in share since 2015 is indicated by a green box, a decline is boxed in red.
Now we’ll wrap it up with a brief summary and a detailed chart for future reference.
SUMMARY
Pet Stores remain the #1 channel for Pet Products. However, in the Overall Market, there are 3 Olympic Medalists. SuperCenters & Clubs are firmly entrenched with the Bronze medal. The big race is for the Gold. Two years ago in 2015 SuperMarkets led the Internet/Mail Order Channel by 4.83% in market share. In 2017 the lead was down to 1.89%. Barring a major turnaround, Internet/Mail Order should become the #1 retail channel in the U.S. no later than 2019 but perhaps as soon as 2018. One factor that could speed up the Internet/Mail Order victory is that Amazon, the largest retailer in the segment, has firmly set their sights on the fresh grocery business. They demonstrated this commitment very dramatically by their purchase of Whole Foods Market in 2017.
2017 had similarities, but also some distinct differences from 2016. The increase was 4%, up slightly from 3.6%. However, for the first time since 2012 the increase in the “Relevant Retail” market was less than the increase in the Total Retail Market. Once again the Internet/Mail Order Channel provided much of the excitement and 43.5% of the growth, but we also saw the effect of the physical environment, as record weather related property damage drove sales in all the Building Materials channels. Traditional and Discount Department stores continued their decline while sales in the easy to shop and save, $ Stores grew. The small to medium Miscellaneous Stores (Includes Pet) maintained their place in the market by appealing to consumers desiring a more personalized shopping experience.
The U.S. Retail Market continues to grow and evolve as the consumer migrates to the channels which best fulfill their current wants and needs. This is not a new phenomenon. It has always been that way. Currently, the “Channel of Choice” is Internet/Mail Order and their victory appears to be inevitable and may occur even sooner than expected. Traditional Brick ‘n Mortar stores will not go away but they must adapt to the new “electronic” environment.
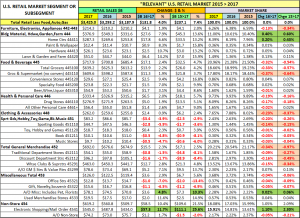
Finally, the Chart below contains Detailed 2015 > 2017 Sales Performance Data for over 30 U.S. Retail Channels.


