U.S. PET SUPPLIES SPENDING $17.71B (↓$2.10B): MID-YR 2019 UPDATE
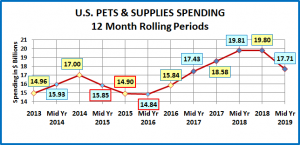
In our mid-year analysis of Pet Food spending, we saw that the spending plummeted in the 2nd half of 2018 then flattened out at the beginning of 2019. Pet Supplies spending took the exact opposite path. Mid-Year 2019 Pet Supplies spending was $17.71B, down $2.1B (-10.6%). The first half spending drop in 2019 effectively puts spending in this segment back to the level of 2 years ago in Mid-Yr 2017. The following chart should put the recent spending history of this segment into better perspective.
Here are this year’s specifics:
- Mid Yr 2019: $17.71B; ↓$2.10B (-10.6%) from Mid Yr 2018. The -$2.10B came from:
- Jul > Dec 2018: ↓$0.01B
- Jan > Jun 2019: ↓$2.09B
Like Pet Food, Pet Supplies spending has been on a roller coaster ride. However, the driving force is much different. Pet Food is “need” spending and has been powered by a succession of “must have” trends. Pet Supplies spending is largely discretionary, so it has been impacted by 2 primary factors. The first is spending in other major segments. When consumers ramp up their spending in Pet Food, like upgrading to Super Premium, they often cut back on Supplies. However, it can go both ways. When they value shop for Premium Pet Food, they take some of the saved money and spend it on Supplies. The other factor is price. Pet Supplies prices reached their peak in September of 2009. Then they began generally deflating and in March 2018 were down -6.7% from 2009. Although it is not a hard and fast rule, Price inflation in this largely discretionary segment can retard sales, usually by reducing the frequency of purchase. On the other hand, price deflation generally drives Supplies spending up. Innovation can “trump” both of these influencers. If a new “must have” product is created, something that significantly improves the pet parenting experience, then consumers will spend their money. The perfect example of this is the successive waves of new food trends. Unfortunately, we haven’t seen much significant innovation in the Supplies segment recently.
Recent history gives a perfect example of the Supplies roller coaster. In 2014 Supplies prices dropped sharply, while the movement to Super Premium Food was barely getting started – Supplies spending went up $2B. In 2015, consumers spent $5.4B more on Pet Food. At the same time, Pet Supplies prices went up 0.5%. This was a “killer” combination as Supplies spending fell $2.1B. In 2016 consumers value shopped for Food, saving $2.99B. Supplies spending stabilized by mid-year then increased by $1B in the second half when prices fell sharply. Consumers spent some of their “saved” money on Supplies. Supplies prices continued to deflate throughout 2017. Food spending increased $4.61B in 2017 but this came from a limited group, generally older CUs, less focused on Supplies. The result was a $2.74B increase in Supplies spending. This appeared to be somewhat of a break with the overall pattern of trading $ between segments.
In the first half of 2018 Pet Food spending slowed to +$0.25B. Supplies’ prices switched from deflation to inflation but were only up 0.1% versus the first half of 2017. During this period Supplies Spending increased by $1.23B. With new Tariffs scheduled to start in September, prices began to climb in the second half of 2018. They were up 1.7% in the second half and with implementation of the tariffs, grew an additional 1.7% in the first half of 2019. Halfway through 2019 Supplies prices were a full 3.4% higher than they were a year earlier. The impact of the tariffs on the Supplies segment is very clear. Spending became flat in the second half of 2018, then took a nosedive in the 1st half of 2019 – down -$2.1B. In one 6 month period Supplies gave back 40% of the $5B it had gained from July 2016 to June 2018.
Let’s take a closer look at the data, starting with the two most popular demographic measures – age and income. In the graphs that follow we will compare spending for the Mid-year 12 months ending 6/30/19 to the previous period ending 6/30/18. In our graphs we will also include the 2018 yearend $pending. This will also allow you to see the spending changes in the 2nd half of 2018 and the 1st half of 2019.
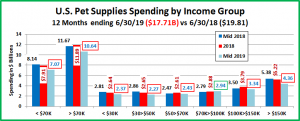
The first graph is for Income, which has been shown to be the single most important factor in increased Pet Spending, especially in Pet Supplies and both of the Service segments.
Here’s how you get the change for each half using the $50>70K group as an example:
Mid-yr Total Spending Change: $2.43B – $2.47B = Down $0.04B (Note: green outline = increase; red outline = decrease)
- 2nd half of 2018: Subtract Mid-18 ($2.47B) from Total 2018 ($2.61B) = Spending was up $0.14B in 2nd half of 2018.
- 1st half of 2019: Subtract Total 2018 ($2.61B) from Mid-19 ($2.43) = Spending was down $0.18B in 1st half of 2019.
- In an exact reversal of the Mid-yr 2018 pattern, the decrease in Supplies Spending was widespread across income groups. The only yearly increase came from the $70>100K group. They were up in both halves. They did have a $2B decrease in Food spending during this time so they may have spent a small amount of those $ on Supplies.
- In another reversal, the biggest decrease came from the over $150K group. Their $1.02B drop accounted for 49% of the segment’s total decrease while they only have 13.1% of the CU’s. They gave back most of last year’s $1.5B gain but the drop was mitigated because this group is gaining members faster than any other income segment, +11.4%.
- The pattern of the under $50K groups matches the $150K+ segment with drops in both halves. Their combined $1.03B drop also accounted for 49% of the total decrease. However, they account for 46.0% of all CUs and their numbers are shrinking, down 1.6 million, -2.7% in the last year.
- The upper and lower middle income groups, $50>70K and $100>150K, had their own pattern with a lift in the second half of 2018 and a drop at the start of 2019. The $ changes were larger for the higher income group.
- Did tariffs have an impact? Income groups totaling 113M CU’s (86%) spent less on Supplies in the 1st half of 2019.
Now let’s look at Pet Supplies spending by Age Group.
- Every Age group had an overall annual decrease and only the under 25 group had an increase in the 1st half of 2019.
- The 25>44 year olds were the only ones to spend more in the second half of 2018, +$0.32B. However, they gave it all back and more, down -$0.94B in the 1st half of 2019.
- The two smallest spending groups, <25 and 75+ had only small decreases, under -5%. However, the Supplies spending in each of the other groups fell at least -9%. Obviously, the inflation from tariffs affected all ages.
Now let’s look at what is happening in Supplies spending at the start of 2019 across the whole range of demographics. In our final chart we will list the biggest $ moves, up and down by individual segments in 11 demographic categories. Remember, the drop in the 1st half of 2019 was -$2.09B, a big change from the -$0.01B decrease in the 2nd half of 2018.
- The first thing that you notice is that the biggest decreases are radically larger than the biggest increases.
- The downturn is also very widespread as in 5 of the 11 categories all segments decreased Supplies Spending. This is a radical turnaround from last year when 4 categories had increased supplies spending in all segments. The “flip” from last year is even more evident in the details. In the 1st half of 2018, 89% of all segments spent more on Supplies. In 2019, only 8 segments spent more. That means 90% spent less – a total reversal.
- The list of losers is a veritable roster of the usual Supplies spending winners – Gen X, White, not Hispanic, Homeowners w/Mtge, $150K+, BA/BS, Suburban, 2 Earners… The answer is that the groups who buy the most Supplies were the groups most impacted by the price increases.
- There are a couple of minor bright spots. Like the Food segment, Singles were the unexpected winners in 3 categories. This reflects their increasing focus on their pets. It also can be seen beneath the surface in the <25 and 75+ age groups. They had by far the smallest decreases and are also the most likely to be in a 1 person CU.
- The other positive is that both African Americans and Hispanics increased their spending overall and in both halves.
The 24 month Spending winning streak for Supplies which began in the second half of 2016 came to an end in the second half of 2018. During that time spending on Pet Supplies increased $4.97B (+33.5%). It was also widespread across America. Of 82 separate demographic segments, only 1 spent less on Supplies in that period – the Greatest Generation. This 91+ year old group has now become too small to be accurately measured.
What are the market conditions that affect Supplies spending? We have to first note that the world changed for Supplies because of the great recession. Prices have generally deflated since then and spending in the segment became more sensitive to changes in price. Prices go up…spending drops, usually due to reduced purchase frequency. Prices go down… spending turns up. This situation did not exist prior to the recession.
The other factor is spending in other segments, especially Food. Pet spending comes out of “one bucket”. A big increase in one segment can result in a cut back in others and big savings can generate more spending. The recent upgrade to Super Premium Food was such a big $ commitment that it magnified this effect.
In 2018, something new was added – outside influence. The FDA warning on grain free dog food had an immediate and negative impact on the Food segment. For Supplies, it was the implementation of added tariffs. Although the tariffs were not official until September, prices in the Supplies segment began to turn up in the Spring. In the 2nd half they were 1.9% above 2017 and kept increasing. The 1st half 2019 CPI was 3.4% above the 1st half of 2018. The result was that Supplies spending flattened out then plummeted in the first half of 2019, down -$2.1B. Inflation has now come to the forefront in Supplies Spending. It continued to increase. By the 2nd half of 2019 prices had increased 4.0% in 18 months. Unless consumers adjust their behavior, this does not bode well for the 2nd half of 2019. We’ll get that data in September.


