U.S. Pet Supplies Spending $14.84B (↓$1.01B): Mid-Year 2016 Update
2015 was quite a year for Pet Food but not so good for Pets & Supplies. Now it’s time to see what the beginning of 2016 brought to Supplies Spending. In the US BLS Mid-Year Update of their Consumer Expenditure Survey covering the 12 month period ending 6/30/16, Supplies Spending was $14.84B, down $1.01B from a year ago and even slightly less than 2013. The following chart should put the recent history into perspective.
- 2015 ($14.9B) vs 2014 ($17.0B)
- ↓$2.1B (-12.4%)
- 1st Half ↓$1.15B
- 2nd Half ↓$0.95B
- ↓$2.1B (-12.4%)
- Mid-16 ($14.84B) vs Mid-15 ($15.85B)
- ↓$1.01B (-6.4%)
- Jul>Dec 2015 ↓$0.95B
- Jan>Jun 2016 ↓$0.06B – Flat
- ↓$1.01B (-6.4%)
- 2015 vs 2013 – Spending Flat:↓$0.06B
- Mid-16 vs Mid-14 – Spending ↓$1.09B
The Chart clearly shows the Spending ride that Supplies has taken since 2013, climbing to the summit in 2014 then descending into the valley in 2015. Supplies is a diverse and complex segment so there are a number of factors behind these changes in Spending. For this report we will focus on 2 which seem particularly relevant.
The first is pricing – inflation/deflation. Many Supplies Categories are commoditized so spending is impacted by the rise and fall of prices. 2014 was a “deflation” year. Prices were down so the largely discretionary Supplies spending was up, way up. During the Holiday season of 2014, prices turned upward. Spending was not significantly slowed…but the prices stayed up into the new year. This would have a negative impact.
At the same time in 2015, another trend was starting in another segment. A large group of consumers, mostly Baby Boomers was choosing to upgrade their Food to Super Premium. This upgrade was significantly more expensive so this group immediately began looking for ways to save on discretionary spending. Basically, everyone was looking for savings and Supplies prices were going up. The result was a $2B drop in Supplies spending primarily from only a 10% decrease in purchase frequency. In Nov-Dec 2015, the Consumer Price Index for Pet Supplies dropped by a record 2% – but it wasn’t enough to turn the year around. Prices stayed down for the first half of 2016 and Spending stabilized at the level of the same period in 2015, which is not good, but at least it stopped falling.
Now let’s look at the 2016 Mid-year Supplies Spending versus previous year by Age Group
At the end of 2015, every age group was showing decreased spending on Supplies vs 2014. At the Mid-Year update in 2016 we are starting to see evidence of at least a pause in the decline if not the beginning of a turnaround.
- The biggest drop in Supplies is still occurring in the age groups which have Baby Boomers who range in age from 52 to 70 at the time of this report. In 2015 the Boomers opted to upgrade to Super Premium Foods and reduced spending in other areas, especially Supplies. We’re still seeing the residual effect of that choice.
- Supplies have always been an important portion of overall Pet Spending for the younger groups so it’s fitting that the Under 35 group is showing an increase. Perhaps the turnaround will start with the Millennials.
- Another point to note is the increase, although slight, at both ends of the age spectrum. The individuals in age groups are always changing. This increase indicates that new pet households are being added and that existing pet households are being maintained.
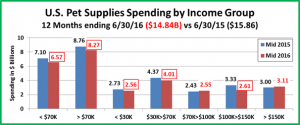
Now let’s look at Supplies Spending by Income Group to see if Money Matters.
Just like the Age Groups, every Income group showed decreased spending in 2015. At the 2016 Mid-Year update, the decline is still pretty pervasive but there are a couple of positives.
- The $1B decrease is almost equally split between the Over $70K and Under $70K groups.
- All the Income Levels under $70K are also showing a drop in Supplies Spending.
- The $100>$150K group is still reflecting the cut back in Supplies Spending which was driven by the Food Upgrade and value shopping. Their income is $120K but this group is at the peak of family responsibilities & children <18.
- There is a slight increase of $0.12B in the above average income group $70>$100K. There is probably a strong correlation between this group and the lift in the 25>34 age group, especially married couples only.
- The Over $150K group is also showing an increase of $0.11B. With an average income of $259K, discretionary spending is just that…at their discretion.
Comments
2015 was not a good year for Supplies. It was a year of price inflation. While not strictly tied to the CPI, many of the commoditized Supply Categories are strongly influenced by price. With inflation, Spending fell $2.1B in 2015. Prices had a record drop in November-December. This may have mitigated the decline but it was not enough to turn the second half around. The lower prices continued for the first half of 2016 and Spending stopped falling and flattened out at a level equal to the first half of 2015. What will happen in the second half? We’ll just have to wait and see. The Segment could certainly use a turnaround. Here are some large Demographic segments that are showing an increase in Supplies Spending for the first Half of 2016 and might lead the way.
- <$100K ↑$0.36B
- 35>44 yrs ↑$0.19B
- 3 Person or less CU’s ↑$0.5B
- College Grads ↑$0.14B
- White, Not Hispanic ↑$0.14B
- Northeast & Western Regions ↑$0.3B


