U.S. PET SPENDING: Does the buyer’s “age” matter?
In our recent post on Pet Spending in the U.S. during 2014 we reported a 11.4% increase from 2013 to 2014 – $6.6B. The numbers were based upon the Consumer Expenditure Survey conducted in a cooperative effort by the USBLS and the Census Department. Here are the summary numbers:
The obvious question was, “Where did the $6+ Billion dollars come from?” Are there demographic groups that are buying more…and conversely, are there groups that are underperforming? The best way to maintain and increase growth is by targeting your efforts to build on strengths and to correct weaknesses.
Since we were looking at Pet Spending, the first thing to do is “follow the money”. The first demographic that we looked at was income level. As expected, it was a complex answer but there were 2 household income levels driving overall Pet Spending: $120K and above….and $30 > $70K
The $120K+ was no surprise but the $30>$70K group raised questions. An initial review showed a connection with another demographic…age. Two age groups, 25 to 34 and 65+ were showing exceptional increases in Pet spending. It’s worth a closer look at the consumer’s age in relation to Pet Spending.
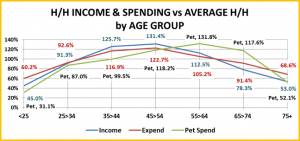
First, let’s get an overview of the various age groups. The chart below shows how each age group compares to the U.S. average in terms of gross income, annual expenditures and pet spending.
Observations
- Income: Gross Income increases rapidly up to the 35>44 age group and peaks at 45>54. Then comes a gradual decline until age 75+, where it is about 19% higher than the under 25 group.
- Expenditures: The “under 25” group actually spends more than their gross income. Expenditures rise in a pattern which closely follows Income, peaking at age 45>54. The ensuing decline is not as steep as income. However, at age 75+ expenditures once again exceed income.
- Pet Expenditures: At age 25>34 Pet Expenditures “take off”, more than doubling. Pet Parents are “born”. Pet Expenditures begin 30 years of increases but peak at 55>64. This peak occurs when both income and total expenditures have started to decline. Pet Parents spend at a rate equal to or greater than the national average for 40 years. The big drop comes at 75+.
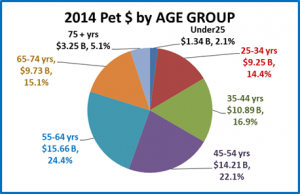
Let’s translate this into total $. Here’s how much each age group spent on their Pets in 2014.
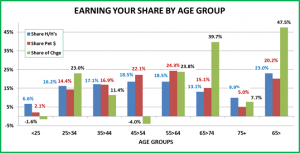
Now, let’s put each group’s spending into perspective with their…
- Share of Households
- Share of Pet Spending
- Share of the $6B increase
Observations
- Age does matter as 71.3% of the increase is coming from consumers over 55 years of age. The 65>74 group is especially strong accounting for almost 40% of the growth.
- The 25>34 age group is generating 23% of the increase. Young people are including Pets as a part of their “startup” households which is important for the future of the industry.
- The largest pet spending group, 55>64 is showing a strong increase, accounting for 23.8% of the total increase. The second largest group, 45>54 is showing a decline largely due to 945K less H/H’s.
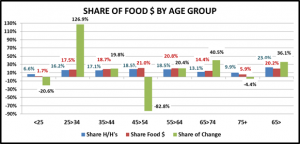
Let’s take a look at spending by Industry Segment:
Observations
- Since Food spending is an absolute necessity for Pet ownership, it is obvious that the young people are “adopting” pets. It may also be an indication of their feelings in regard to higher quality brands.
- The drop in the 45>54 age group is huge. The reason is basically twofold – 945K fewer H/H’s combined with a drop in actual household food expenditures – probably due to value shopping.
- At age 55+ as their children start to “leave the nest”, older adults may turn their focus more to their Pets…spending more and even “adopting new family members”…up to age 75.
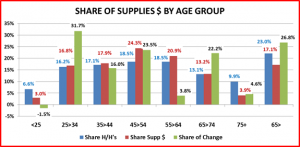
Next…Supplies
Observations
- The increase in supplies spending is almost universal across age groups, except for “under 25”.
- The 25>34 group is the leader again, but the over 65 consumers are not far behind.
- Significantly, the 45>54 group is showing a strong increase which is counter to their trend in Food.
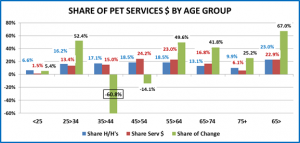
On to Non-Vet Services…
Observations
- The Service segment appears to be driven by a combination of “need” and finances.
- The 35>54 group certainly can afford Pet Services but they are choosing to “do it themselves”.
- As consumer’s age, the need for Pet Services increases. In fact, 114.6% of the increase came from consumers 55 years old and older. Even the over 75 group had a significant increase despite their reduced resources.
- The “startup” Pet Parents, 25>34 also had a huge increase. Their “need” may not be “physical” but could come from a lack of time due to a more active lifestyle.
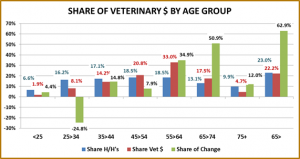
Finally, Veterinary Services…
Observations
- The largest share of Vet Spending comes from the 55>64 age group. Through personal experience, as consumers age they become even more “aware” of the medical necessities of life. This carries over to their pets. This group has the greatest resources and they spend whatever is needed on Veterinary Care for their pets.
- Almost all (97.8%) of the increase in Veterinary Spending comes from the over 55 group. The 65>74 group is the leader by far, accounting for 50.9% of the $3B increase.
- The 45>54 age group accounts for 20.8% of Veterinary spending but only 7.9% of the increase. They spent slightly more per H/H but the drop in the number of H/H’s minimized the increase.
- In a big change, the 25>34 group accounts for a relatively small share of Vet spending and it is decreasing. These new Pet Parents may not yet be aware of the value of regular Veterinary care.
Overview By Age Group
- Under 25 – Not yet a significant factor with only 6% of households and 2% of Pet Spending.
- 25>34 – This group, with 16% of the households and increasing income, is the future of the Pet Industry. Right now the future looks bright as they are showing significant increases in all Pet Segments except Veterinary.
- 35>44 – With 17.1% of Households and 16.9% of Pet Expenditures, this is the point where Pet Parents start “earning their share” of the Pet Business. Only the Service segment is “soft” in spending. Perhaps this healthy, active group is the least likely to need “help” with their Pet.
- 45>54 – This group is #2 in Pet Spending at 22.1% but they are actually showing a decrease. Their Pet Spending per Household actually increased slightly but there are 1,000,000 fewer households in this group. This is evidence of the “slump” after the “baby boom”. At this point, their income is high but so are their expenses, especially in regard to their human children. As a result, this group can be very value conscious in terms of Food and selective in their need for Non-Vet Services.
- 55>64 – At this age, income and total expenditures start to decline, but Pet Spending reaches its peak as consumers focus on their “pet children”. Both Service Segments become big factors in spending. Supplies are just “holding their own”, but Food spending significantly increased in a tough market.
- 65>74 – The average Pet Spending per household drops about 10% from the 55>64 group. However, they still spend 1.19% of all their expenditures on their Pets. Also, the number of households in this group increased 624,000 in 1 year. That produced a $2.6B jump in Pet Spending – 39.7% of the industry’s $6.6B total increase. This group is a major driving factor in the growth all segments of the industry.
- 75+ – With 541,000 more households, this is also a rapidly growing age group. Although their Pet Expenditures per household are only about 50% of the national average, the growth in the number of households produced significant increases in spending for all segments other than Food. Actually, 25.2% of the increase in Non-Vet Services came from the 75+ group, which represents only 9.9% of all U.S. households.
- 65+ – 23% of U.S. H/H’s; 1.1M more in 1 yr; Produced 47.5% of the total increase in Pet Spending.
A couple of Final Thoughts
- The over 65 group is a fast growing segment and dedicated to their pets. Develop products and programs to make “continuing” their pet experience easier and more affordable.
- There are a lot of “new” Pet Parents in the 25>34 age group. They need education and quality, affordable products to insure that their pet experience is rewarding…for a lifetime.
A 2 page detailed Appendix on Pet Spending by Age Group is available through the link below. Just click on the button to download and save the file as a PDF. If you would like this in Excel format, send me an e-mail request.
[button link=”https://petbusinessprofessor.com/wp-content/uploads/2015/11/Pet-Spending-by-Age-Group.pdf” type=”icon” newwindow=”yes”] Download Data (PDF)[/button]


