U.S. Pet Services Spending (Non-Vet) $6.56B (↓$0.26B): 2017 Mid-Year Update
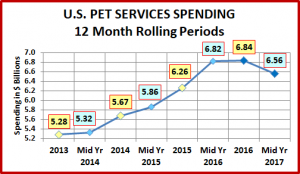
The US BLS recently released their Mid-Year Update of the Consumer Expenditure Survey covering the period 7/1/2016 to 6/30/2017. In our analysis of Pet Supplies Spending we saw that everything had turned “gold”. Spending was up across virtually every demographic segment. On the other hand, Pet Food Spending was down slightly. However, a deeper “dive” into the data showed evidence of a strong increase in the first half of 2017. Now we turn our attention to Pet Services. The Mid-year numbers show that spending in this segment was $6.56B, down $0.26B (-3.8%) from the previous year. This segment is known for consistent, albeit small increments of growth. This is the first decline in any 12 month period in 4 years. Let’s look at recent Services spending history:
Here are the Mid-Year 2017 Specifics:
- Mid-Year 2017: $6.56B vs Mid-Year 2016: $6.82B
- ↓$0.26B (-3.8%)
- Jul > Dec 2016: ↑$0.02B
- Jan > Jun 2017: ↓$0.28B
- ↓$0.26B (-3.8%)
Pet Services is by far the smallest industry segment. However, except for 2010 and 2011, the period immediately following the Great Recession, it has shown consistent annual growth since 2000. Spending in Food and Supplies have been on a roller coaster ride during that period. Service Spending has more than tripled since 2000 with an average annual growth rate of 7.6%. Spending in the Services Segment is the most discretionary in the industry. Over all these years the inflation rate has averaged over 3.2%, with little or no negative impact on spending. The primary reason is that Service Spending is very strongly skewed towards high income households. After the recession inflation has been slowing, down to the 2+% range. In mid 2016 inflation dropped below 2% and continued down to 1.1% by the end of 2017. This is primarily due to increased competition from free standing businesses but also an increase in the number of Pet Stores and Veterinary Clinics offering pet services. While prices still went up slightly, a big factor in the flat then declining sales during this mid-year report is today’s consumers’ value shopping for the best price.
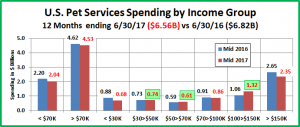
Let’s take a look at some demographics. First, Pet Services Spending by Income Group.
- There is no regular income spending pattern. The biggest decreases come at the high and low end of income.
- There is a miniscule lift in the $30>$70K range but the only significant increase (+$.26B) is in the $100>$150K group.
Now, Services’ Spending by Age Group.
- Unlike Income, the spending pattern is very clear for age groups. 55>74 spent more. Under 55 & over 75 spent less.
- The biggest changes came right at the “dividing line”. 55>64 was ↑$.38B but this was negated by 45>54, ↓$.41B.
In Pet Services the big news is the negative downturn in spending in the first half of 2017. The following chart will show the segments with the biggest drops in Services Spending during that time period across key demographic categories.
Once again the group consists of many of the traditionally biggest spending demographic segments in the industry. We know that there is growing competitive pressure in the marketplace in this segment and in today’s world, virtually everyone shops for the best price. This could be a reason behind some of the decline. There is another likely situation. Every one of these groups had a significant increase in Pet Products (Food & Supplies) spending in the first half of 2017. They may be making up for the increased Products spending by cutting back on their spending in other segments. Pet Services is probably the most discretionary spending segment in the industry so it is a prime candidate for trading Pet $. In this situation, consumers may not be foregoing services entirely, just slightly dialing back the frequency.
The odds are that Services spending will rebound in the second half. 2016 was the first year since 2012 in which the increase in the second half was lower than the first half. In 2013 Services overcame a $0.44B spending drop in the first half with a $0.53B increase in the second half and had another annual spending increase. We’ll have to wait and see.
Although 75% of the demographic segments had decreased spending in the first half, there were some positives.
- $100>149K: +$.19B
- Mgrs & Profess: +$.15B
- 2+ Single Adults: +$.10B
- Married, Oldest Child 6>17: +$.08B


