U.S. PET FOOD SPENDING $28.44B (↓$0.18B): MID-YEAR 2017 UPDATE
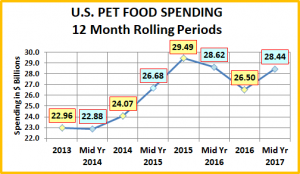
The US BLS just released their Mid-Year Update of the Consumer Expenditure Survey covering the period 7/1/2016 to 6/30/2017. The report shows Pet Food Annual Spending at $28.44B (Food & Treats). The following charts and observations were prepared from calculations based upon data from that report and earlier ones. The first chart will help put the $28.44B into perspective with recent history.
Here are the current numbers:
- Mid 2017: $28.44B; ↓$0.18B (-0.6%) from 2016
The net –$0.18B in Mid 2017 came from:
- Jul>Dec 2016: Down $2.12B from 2015.
- Jan>Jun 2017: Up $1.94B from 2016
Spending turned sharply upward in the first half of 2017. This probably should have been expected. We have noted in previous reports that Pet Food spending has been on a roller coaster since 2000, with 2 years up, followed by a flat or even declining year. This chart perfectly reflects this pattern. This up and down “ride” has been driven by a succession of Food trends. 2013 was a down year. It was followed by 2 up years as an increasing number of consumers opted to upgrade to Super Premium Foods. Spending peaked in 2015 then fell sharply as consumers began value shopping for food, at retail outlets and on the internet. With the big lift in the first half of 2017, it looks like we’re right “on track” for a spending increase in 2017. In fact, in the second half of 2017, if we recover only half of the $2.12B drop that we had in the second half of 2016, 2017 will set a new record high for pet food spending.
There is another factor at work in the market. From 2014 to 2017, the Pet Food segment experienced a period of record deflation. Normally, in a need based category, this would drive spending down. That has not been the case. In fact prices edged up 0.2% in 2016 when sales were plummeting. What it does indicate is that we are in an incredibly competitive market. This is great for today’s value driven shoppers but it is tough on manufacturers, distributors and retailers.
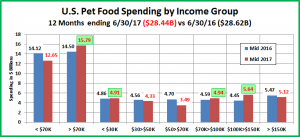
Now, let’s see where the $26.44B came from – First by Income Group (Increases highlighted in green)
- When you look at the over/under $70K groups it looks normal. Higher incomes: ↑$1.29B; Lower incomes: ↓$1.47B.
- However, increases are not directly tied to income. The upper middle class bought more. The big earners spent less.
- The <$30K group also had a small increase. This group is made up of those just getting started and older Americans.
That brings up a good question. Let’s look at Pet Food Spending by Age Group. (Increases highlighted in green.)
- This demographic measure certainly tells a different story than household income. All but 2 groups are up.
- The <25 group is down slightly so that probably answers our income question. Older, low income H/H’s spent more.
- The 55>64 yr olds are dragging down the entire food segment. They had the biggest increase in 2015 but they also had a huge spending drop in the second half of 2016. That is reflected in these numbers.
- Besides the widespread increase there is also some other “hidden” good news. The 35>54 age group led the way with a $2B increase. Why lump them together? Because 80% of them are Gen Xers. In this case, they are the heroes.
One of the primary purposes of the Mid Yr Update is to see how the latest year is starting. Considering the differences between the income and age reports, it makes sense to compare the most recent Jul>Dec and Jan>Jun numbers to the previous period. Spending is flat but seems to be turning up in 2017. These charts will show us when the change started.
- In terms of Income groups, virtually everyone had a bad second half of 2016. The 2017 “bounce back” is coming from 2 sources – the over $100K and the under $50K groups. The $50>$100K middleclass is left out – so far.
- The $70>$100K group started out 2017 “flat” but they were the only group with a positive 2016 second half. Hmm?
- In terms of age groups, the second half of 2016 was basically neutral, with the exception of the big drop by 55>64.
- In regard to our earlier “Hmm” remark, look at the 25>34 group. Their spending pattern correlates with the $70>$100K income group. In fact these 2 groups were the only ones to significantly increase food spending in their categories in 2016. Perhaps, the Millennials started a trend in 2016 that was picked up on by “others” in 2017.
- The “others” that radically increased Food spending in the first half of 2017 were Gen Xers and the oldest Boomers.
If the newest trend is focused on high nutrition, with clean labels and transparency, it may have “struck a chord” with Gen Xers. Here are some more demographic segments with a strong start to 2017, which support the assertions above.
- Homeowners, No Mtge: +$1.23B
- Suburban: +$1.15B
- College Grads: +$1.13B
- Mgrs & Professionals: +$.92B
- 2+ Singles H/H’s: +$.84B
- 1 Person H/H’s: +$.75B
- 5+ Person H/H’s: +$.72B
- Center City: +$.50B
- Retired: +$.44
These groups suggest that the new trend could have an even broader appeal. We’ll see what happens in the second half.


