U.S. PET SUPPLIES SPENDING $23.59B (↓$0.79B): MID-YR 2023 UPDATE
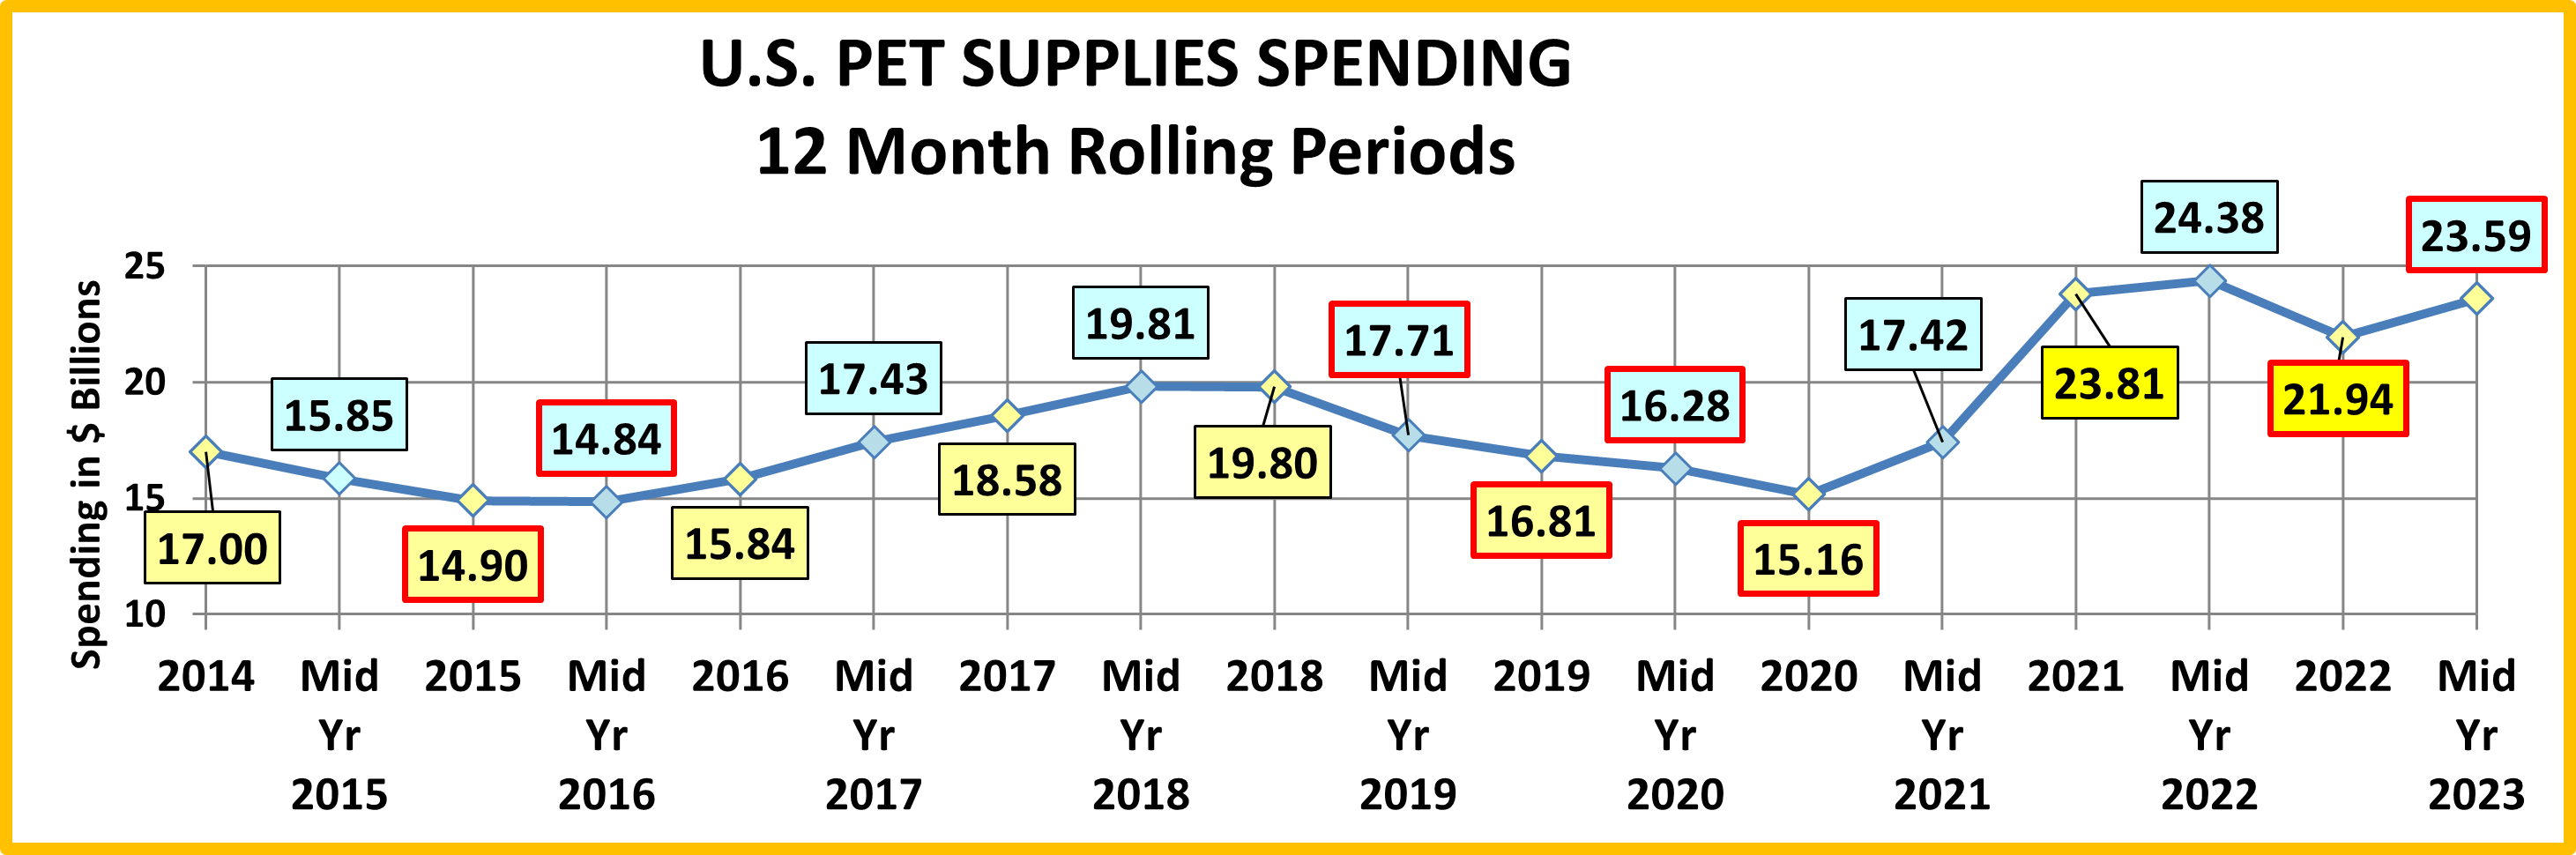
In our analysis of Pet Food spending, we saw that spending had continued strong growth after the up & down due to the pandemic. Supplies had a different pattern. At the beginning of 2020, Supplies Spending was down due to Tarifflation. The pandemic caused consumers to focus on needs so Supplies $ continued its steady decline from its 2018 peak reaching a low point below 2016. In 2021, that all changed. Supplies Prices had been steadily deflating and Consumers finally responded. In 2021 Pet Supplies spending took off, especially in the 2nd half. The increase slowed significantly in the 1st half of 2022 and fell in the 2nd half of 22 as inflation reached 8.0%. Inflation slowed to 5.2% in 23 and spending rebounded to $23.59B, only -3.2% below the record high in Mid-2022. The following chart should put the recent spending history of this segment into better perspective.
Here are this year’s specifics:
Mid 2023: $23.59B; ↓$0.79B, -3.2% from Mid 2022.
The -$0.79B came from:
Jul > Dec 2022: ↓$2.44B
Jan > Jun 2023: ↑$1.65B
The 2nd half 22 drop was big but not unexpected after the $6.39B increase in the 2nd half of 2021, by far the biggest YOY 6 month increase in history. Like Pet Food, Pet Supplies spending has been on a roller coaster ride, but the driving force is much different. Pet Food is “need” spending and has been powered by a succession of “must have” trends and the emotional response to the Pandemic. Supplies spending is largely discretionary, so it has been impacted by 2 primary factors. The first is spending in other major segments. When consumers ramp up their spending in Pet Food, like upgrading to Super Premium, they often cut back on Supplies. However, when they value shop for Premium Pet Food, they take some of the saved money and spend it on Supplies. The other factor is price. Before breaking the record in 2022, Pet Supplies prices reached their peak in September of 2009. Then they began deflating and in March 2018 were down -6.7% from 2009. Price inflation in this segment can retard sales, usually by reducing the frequency of purchase. While deflation generally drives Supplies spending up. A new “must have” product can “trump” both of these influencers. Unfortunately, we haven’t seen much significant innovation in the Supplies segment recently.
Recent history gives a perfect example of the Supplies roller coaster. In 2014 Supplies prices dropped sharply, while the movement to Super Premium Food was barely getting started – Supplies spending went up $2B. In 2015, consumers spent $5.4B more on Pet Food. At the same time, Pet Supplies prices went up 0.5%. This combination caused Supplies $ to fall $2.1B. In 2016 consumers value shopped for Food, saving $2.99B. Supplies spending stabilized then increased by $1B in the 2nd half when prices fell sharply. Consumers spent some of their “saved” money on Supplies. Supplies prices continued to deflate through 2017. Food spending increased $4.61B in 2017 but this generally came from older CUs, less focused on Supplies. The result was a $2.74B increase in Supplies spending.
In the 1st half of 2018 Pet Food spending slowed, +$0.25B. Supplies’ prices began inflating but were only +0.1% vs 2017. During this period Supplies Spending increased $1.23B. Inflation grew in the 2nd half of 2018 due to impending new tariffs in September. By June 2019 they were 3.4% higher than 2018. The impact of the tariffs on Supplies was very clear. Spending flattened in the 2nd half of 2018, then plummeted in the 1st half of 2019, -$2.09B. Prices stayed high for the rest of 2019 and spending fell an additional -$0.9B. In 2020 prices turned up again through March before plummeting, -3.8% by June, but due to the pandemic focus on “needs”, spending dropped an additional -$0.54B. The situation worsened in the 2nd half as the $ fell an additional -$1.12B. However, 2021 brought a record resurgence as consumers “caught up” on the Supplies purchases that had been delayed due to the pandemic. Supplies spending increased +$8.65B in 21 and passed $24B in Mid-yr 22. Inflation in Supplies took off at the beginning of 22 and spending dropped in the 2nd half. Inflation slowed a little in 23 as prices peaked and the $150K> income group drove most of a $1.65B lift.
Here’s what Pet Supplies inflation looked like in Mid-2023:
- Mid-Yr 23 vs 22: 6.6% • 2nd Half 22 vs 2021: 8.0% • 1st half 23 vs 22: 5.2%
You can see that the rate slowed in early 2023 but prices still reached a record high. The 6.6% rate is the 2nd highest in history. Surprisingly, Pet Parents continued to spend at a near record level. However, they bought -9.8% less product. Inflation slowed significantly in the 2nd half of 2023. We’ll see if that impacts spending.
Now, let’s take a closer look at the data, starting with two of the most popular demographic measures – income and age. The graphs that follow will show both the current and previous 12 months $ as well as 2022 yearend. This will allow you to track the spending changes between halves.
The first graph is for Income, which has been shown to be the single most important factor in increased Pet Spending, especially in Pet Supplies and both of the Service segments.
Here’s how you get the change for each half using the $70K> group as an example:
Mid-yr Spending Change: $17.12B – $17.26B = Down $0.14B (Note: green outline = increase; red outline = decrease)
- 2nd half of 2022: Subtract Mid-22 ($17.26B) from Total 2022 ($15.58B) = Spending was down $1.68B in 2nd half of 22.
- 1st half of 2023: Subtract Total 2022 ($15.58B) from Mid-23 ($17.12) = Spending was up $1.54B in 1st half of 23.
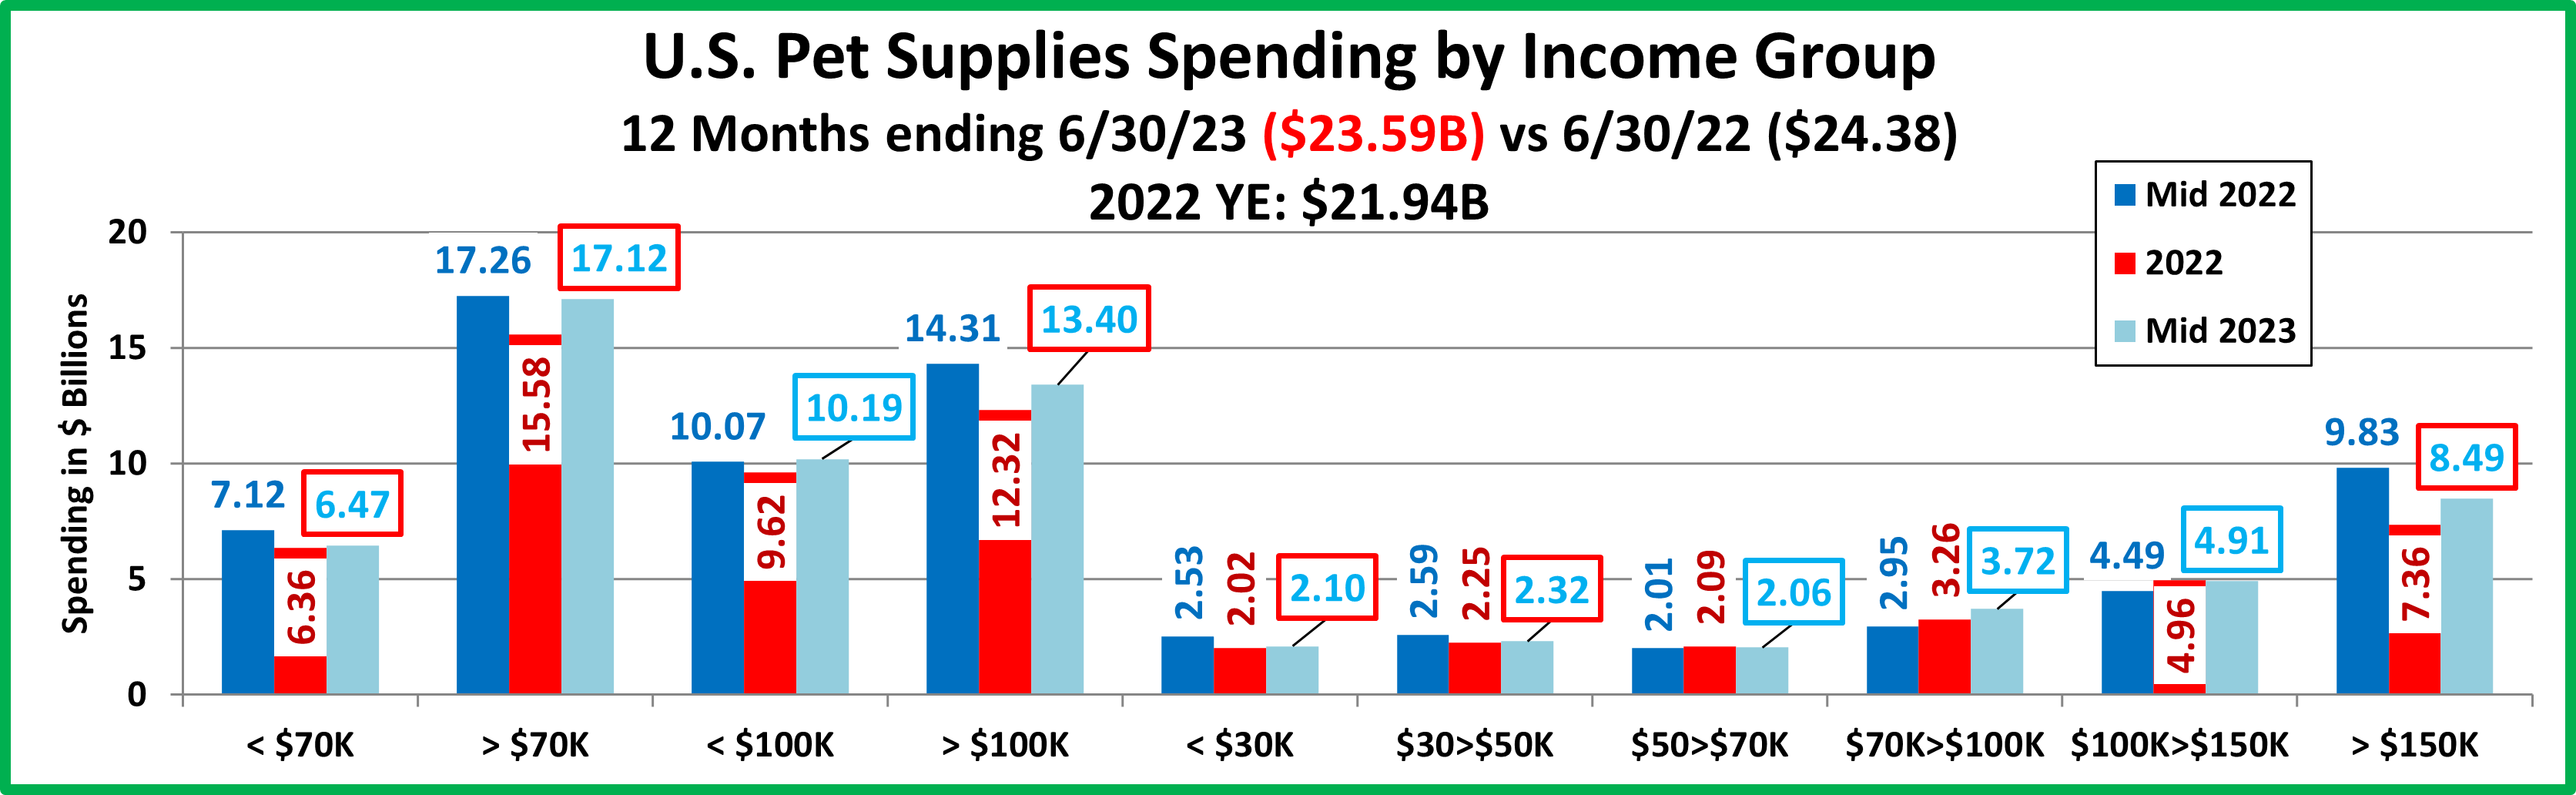
- There are a mixture of patterns. The groups <$50K and $150> had decreases in the 2nd half of 2022. They also had lifts in 2023 along with the $70>100K group. The biggest lift in 2023, +$1.13B came from $150K>. The other groups had only small changes. No group had a decrease in both halves and only $70>100K had increases in both. The net result was that sales for <$50K and $150K> were down vs 2022 while the middle income $50>150K groups were up.
- Supplies spending is a little more balanced but it still driven by the higher incomes, especially the $150K> group. Over $100K has 35.1% of CUs but accounts for 56.8% of Supplies $. That’s a performance level of 161.9%. However, the $150K> is even stronger with 18.7% of CUs generating 36.0% of Supplies spending – performance: 192.8%. The highest performance for any group under $100K is from $70>100K at 112.2% but the averages were: <$100K = 66.5%; <$70K = 53.9%. The halfway point in Supplies spending is an income of $116K, down from $124K in 2022 but still 17% higher than the new elevated level for Food. Pet Supplies spending is still very much driven by income.
Now let’s look at Pet Supplies spending by Age Group.
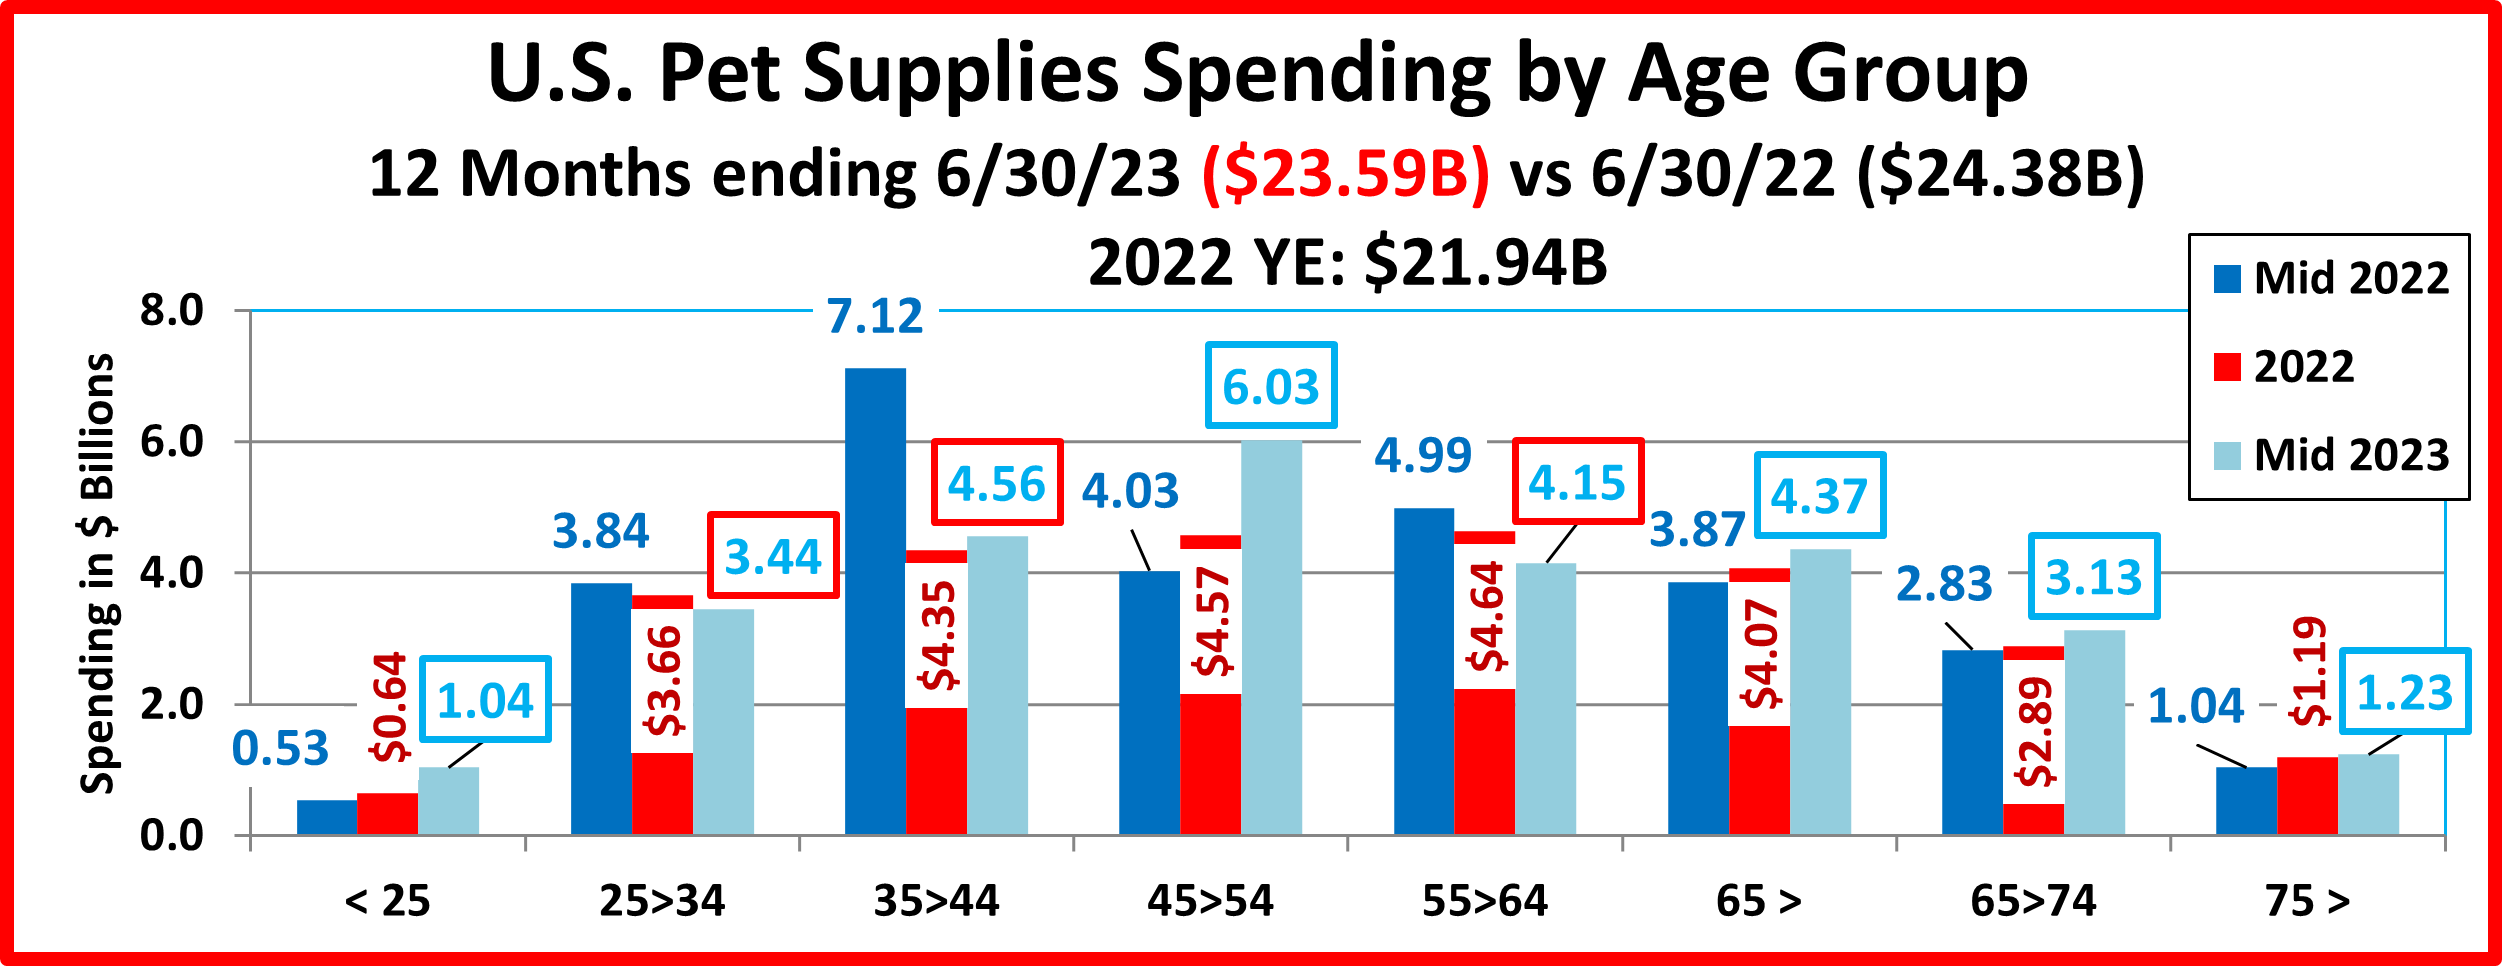
- Except for 35>44, which had a drop in 22 and a lift in 23, all groups were either up or down in both halves. All those with an annual increase spent more in the 1st half of 23 than they did in 22 – <25, 45>54 and 65>.
- The biggest lift came from 45>54, +$2.0B. Most of their increase came in the 1st half of 23.
- The biggest drop came from 35>44, -$2.56B. All of the decrease came in the 2nd half of 22 as they had a lift in 23.
- Supplies spending skews a little younger but it moved up in age in 2023. The halfway point is now 49 yrs old, a little younger than Food at 53 but in the middle of the highest income group. Income is still the biggest driver.
Now let’s look at what happened in Supplies spending at the start of 2023 across the whole range of demographics. In our final chart we will list the biggest $ moves, up and down by individual segments in 12 demographic categories.
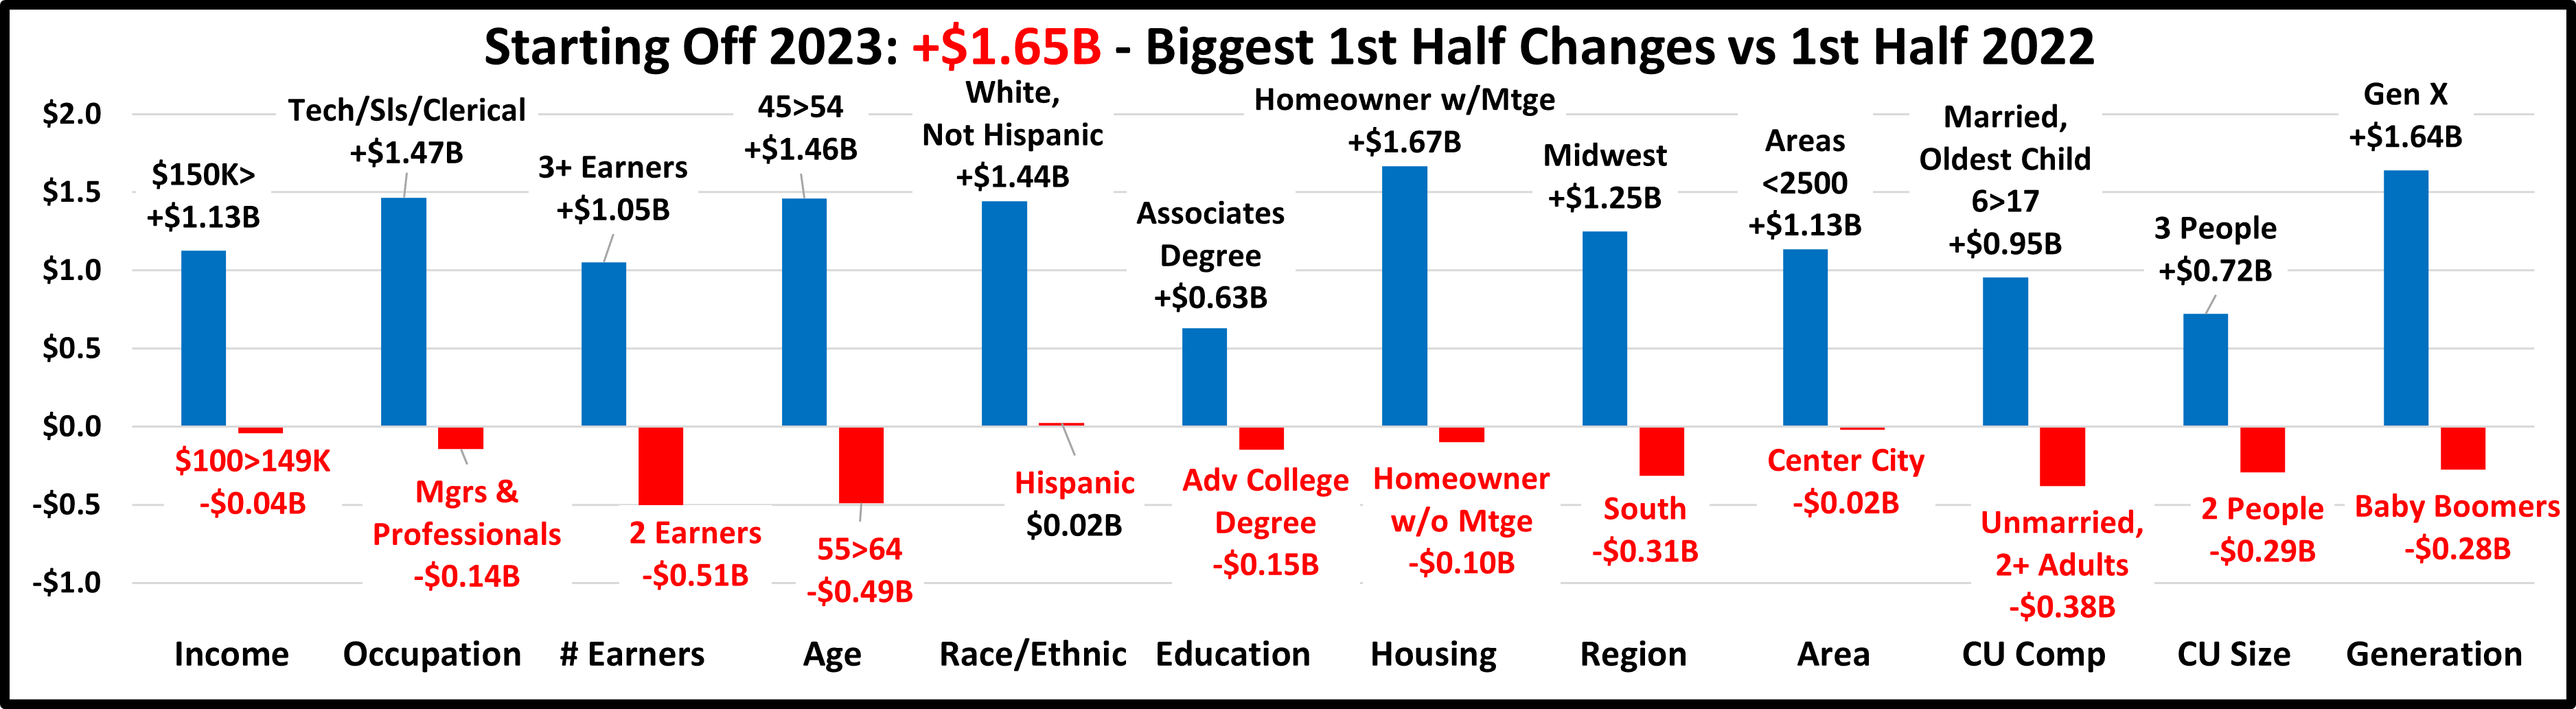
- The lift didn’t equal the 2nd half drop but the biggest increases are still radically larger than the biggest decreases.
- The increase was relatively widespread across the marketplace as 77% of segments spent more. There was 1 category in which all segments spent more – Race/Ethnic. Last year there were none.
- Many of the winners are the “usual suspects”, like $150K>, 3+ Earners, 45>54, White & Homeowners w/Mtge but there are a couple of surprises – Tech/Sls/Clerical & Associates degree.
- In regard to the losers, only a couple are expected – Center City & 2+ Adults. Most are surprising, especially $100>149K, Mgrs & Prof., 2 Earners and Adv. College Degree.
- One of the biggest trends is that Gen X returned to the top with a $1.64B lift. This highest income, family oriented group passed recent strong showings by Millennials & Boomers.
- While Supplies spending became slightly more balanced, income is still very important. 5 of the 12 “winners” have the highest income of any segment in their category.
Since the Great Recession the Supplies segment has become commoditized and very sensitive to inflation/deflation. Plus, since most categories are discretionary, Supplies spending can be affected by spending changes in other segments, as Pet Parents trade $. In 2018, the Pet Industry was introduced to a new “game changer” – outside influence. The FDA warning on grain free dog food caused a big decrease in food spending but the government also radically increased tariffs which drove Supplies prices up and spending down, a record $2.98B.
However, we weren’t done yet. That brought us to 2020 and a new, totally unexpected outside influence, the COVID pandemic. This affected all facets of society, including the Pet Industry. Consumers, including Pet Parents, focused on needs rather than wants. In the Pet Industry, this meant that their attention was drawn to Food and Veterinary Services. This led to a huge lift in Pet Food $ due to binge buying but also a big increase in Veterinary spending. The more discretionary segments, Supplies and Services, suffered. Services had an extra handicap. Many outlets were not considered essential, so they were subject to restrictions and closures. Supplies were still available, but many were considered optional by consumers so spending continued to decline throughout 2020. By yearend, $ had reached the lowest level since 2015. This all happened while prices continued to deflate. That brought us to 2021. The retail economy had largely recovered and spending patterns were returning to “normal”. This was also true in Pet Supplies. Pet Parents opened their wallets and bought the Pet Supplies that they had been holding back on for a year. The result was the biggest annual increase in history. At the end of 2021 and throughout 2022, inflation came back into the picture with the highest YOY increases in history. Supplies spending slowed in the 1st half of 22 then plummeted in the 2nd half but that spending was going against a record increase in 21. Despite record high prices, spending had a widespread sales rebound in 23 but the amount purchased fell by -9.8%. Prices remain high. We’ll see if that has an impact.

