U.S. Pet Services Spending (Non-Vet) $12.77B (↑$1.90B): 2023 Mid-Year Update
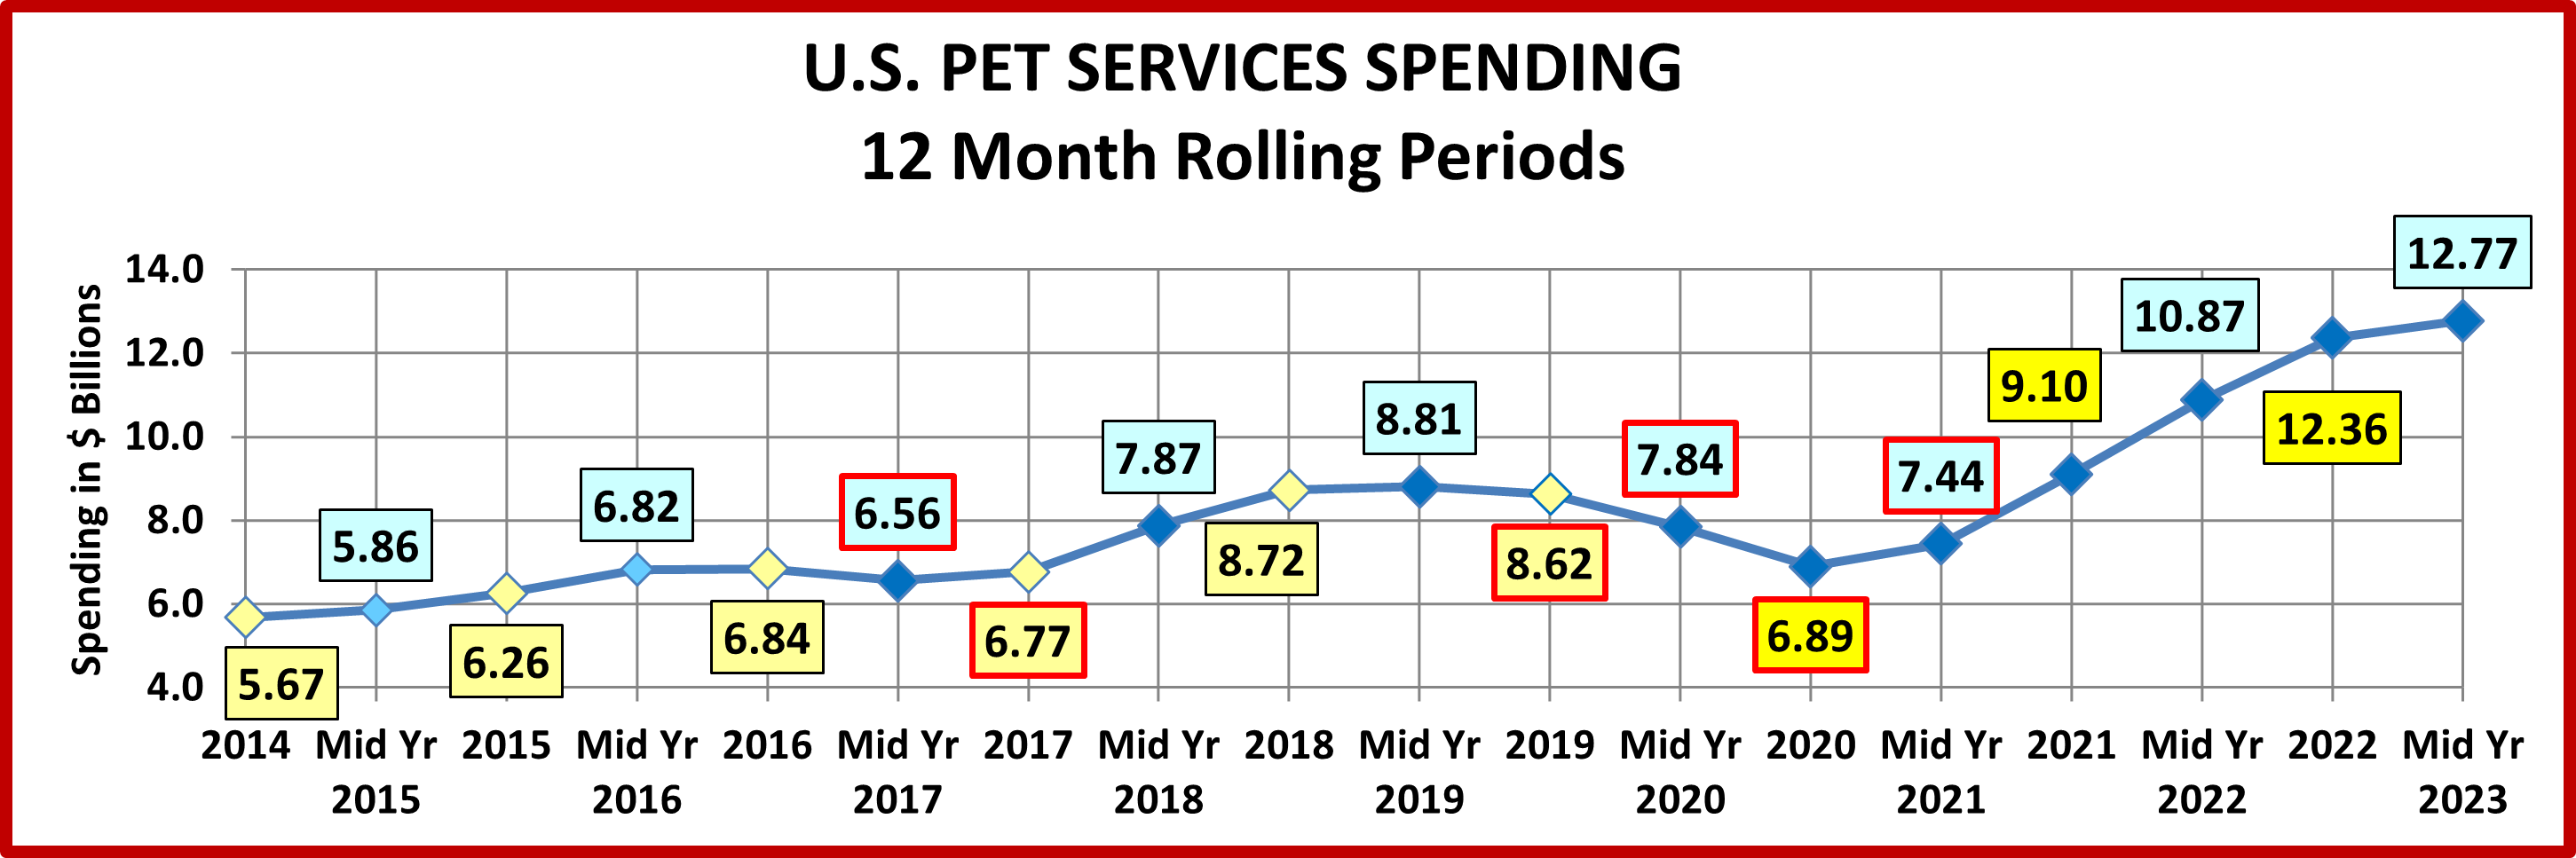
In our analysis of Supplies Spending, we saw a big drop in the 2nd half of 2022, but the $ mostly rebounded in 2023. Food was different. After the big drop in Mid-2021, following the 2020 binge, spending has had strong growth for 2 years. Strong inflation was a factor in both. Now we turn our attention to Pet Services. The Mid-year numbers show that spending in this segment was $12.77B, up $1.90B (+17.5%) from the previous year. Up until 2018, this segment was known for consistent, small growth. In 2018, increased outlets and competitive prices brought on a wave of new users and spending increased +$1.95B. Spending remained near this new high normal until 2020. Pandemic closures drove spending down $1.73B, essentially returning to the level of 2017. In 2021 things opened up and spending spiked until growth slowed in 2023. This deserves a closer look. First, we’ll look at Services spending history since 2014.
Here are the 2022 Mid-Yr Details:
Mid-Year 2023: $12.77B, ↑$1.90B (+17.5%) vs Mid-Yr 2022
The $190B Came From:
Jul > Dec 2022: ↑$1.49B; Jan > Jun 2023: ↑$0.41B
Pet Services is by far the smallest industry segment. However, except for 2010 and 2011, the period immediately following the Great Recession, it had consistent annual growth from 2000 through 2016. Spending in Food and Supplies have been on a roller coaster ride during that period. Services Spending more than tripled from 2000 to 2016, with an average annual growth rate of 7.6%. Spending in the Services Segment is the most discretionary in the industry and is more strongly skewed towards higher income households. Prior to the great recession, the inflation rate averaged 3.9% with no negative impact. The recession affected every industry segment, including Services. Consumers became more value conscious, especially in terms of discretionary spending. Services saw a slight drop in spending in both 2010 and 2011, but then the inflation rate fell to the 2+% range and the segment returned to more “normal” spending behavior. In mid-2016 inflation dropped below 2% and continued down to 1.1% by the end of 2017. This was primarily due to increased competition from free-standing businesses but also an increase in the number of Pet Stores and Veterinary Clinics offering pet services. While prices still went up slightly, there were deals to be had and consumers shopped for the best price. There was no decrease in purchase frequency. Consumers just paid less so spending fell slightly. In the 2nd half of 2017 spending turned up again. More Consumers began to take advantage of the value and convenience of the increased number of outlets offering Services. This deeper market penetration caused Services Spending to take off in 2018, up $1.95B, the biggest annual increase in history. Prices turned up again in the 1st half of 2019, +2.8% from 2018. However, Services spending inched up $0.09B. In the 2nd half of 2019 consumers Value Shopped again so spending fell -$0.19B. Then came 2020 and the pandemic. Many of these nonessential businesses were forced to close and spending fell precipitously, -$1.73B to $6.89B, about the same as yearend 2017. In 2021 things opened up again and spending bounced back, +$0.55B vs the 1st 6 months of 2020. Unlike Food and Supplies the increase continued to accelerate through 2022 with record increases until slowing in 2023. This lift happened despite an inflation rate of over 6% and sales reached a new record highof $12.77B in Mid-2023.
Let’s take a closer look at some key spending demographics – Age and Income.
In the graphs that follow we compare spending for the 12 months ending 6/30/23 to the previous 12 months. The graphs also include the 2022 yearend $, so you can see spending changes in the 2nd half of 2022 and the 1st half of 2023.
The first graph is for Income, the single most important factor in increased Pet Spending, especially in Services.
Here’s how you get the change for each half using the Over $70K group as an example:
Mid-yr Total Spending Change: $10.13B – $8.41B = Up $1.72B (Note green outline = increase; red outline = decrease)
- 2nd half of 2022: Subtract Mid-22 ($8.41B) from Total 2022 ($9.61B) = Spending was up $1.20B in 2nd half of 2022.
- 1st half of 2023: Subtract Total 2022 ($9.61B) from Mid-23 ($10.13B) = Spending was up +$0.52B in 1st half of 2023.
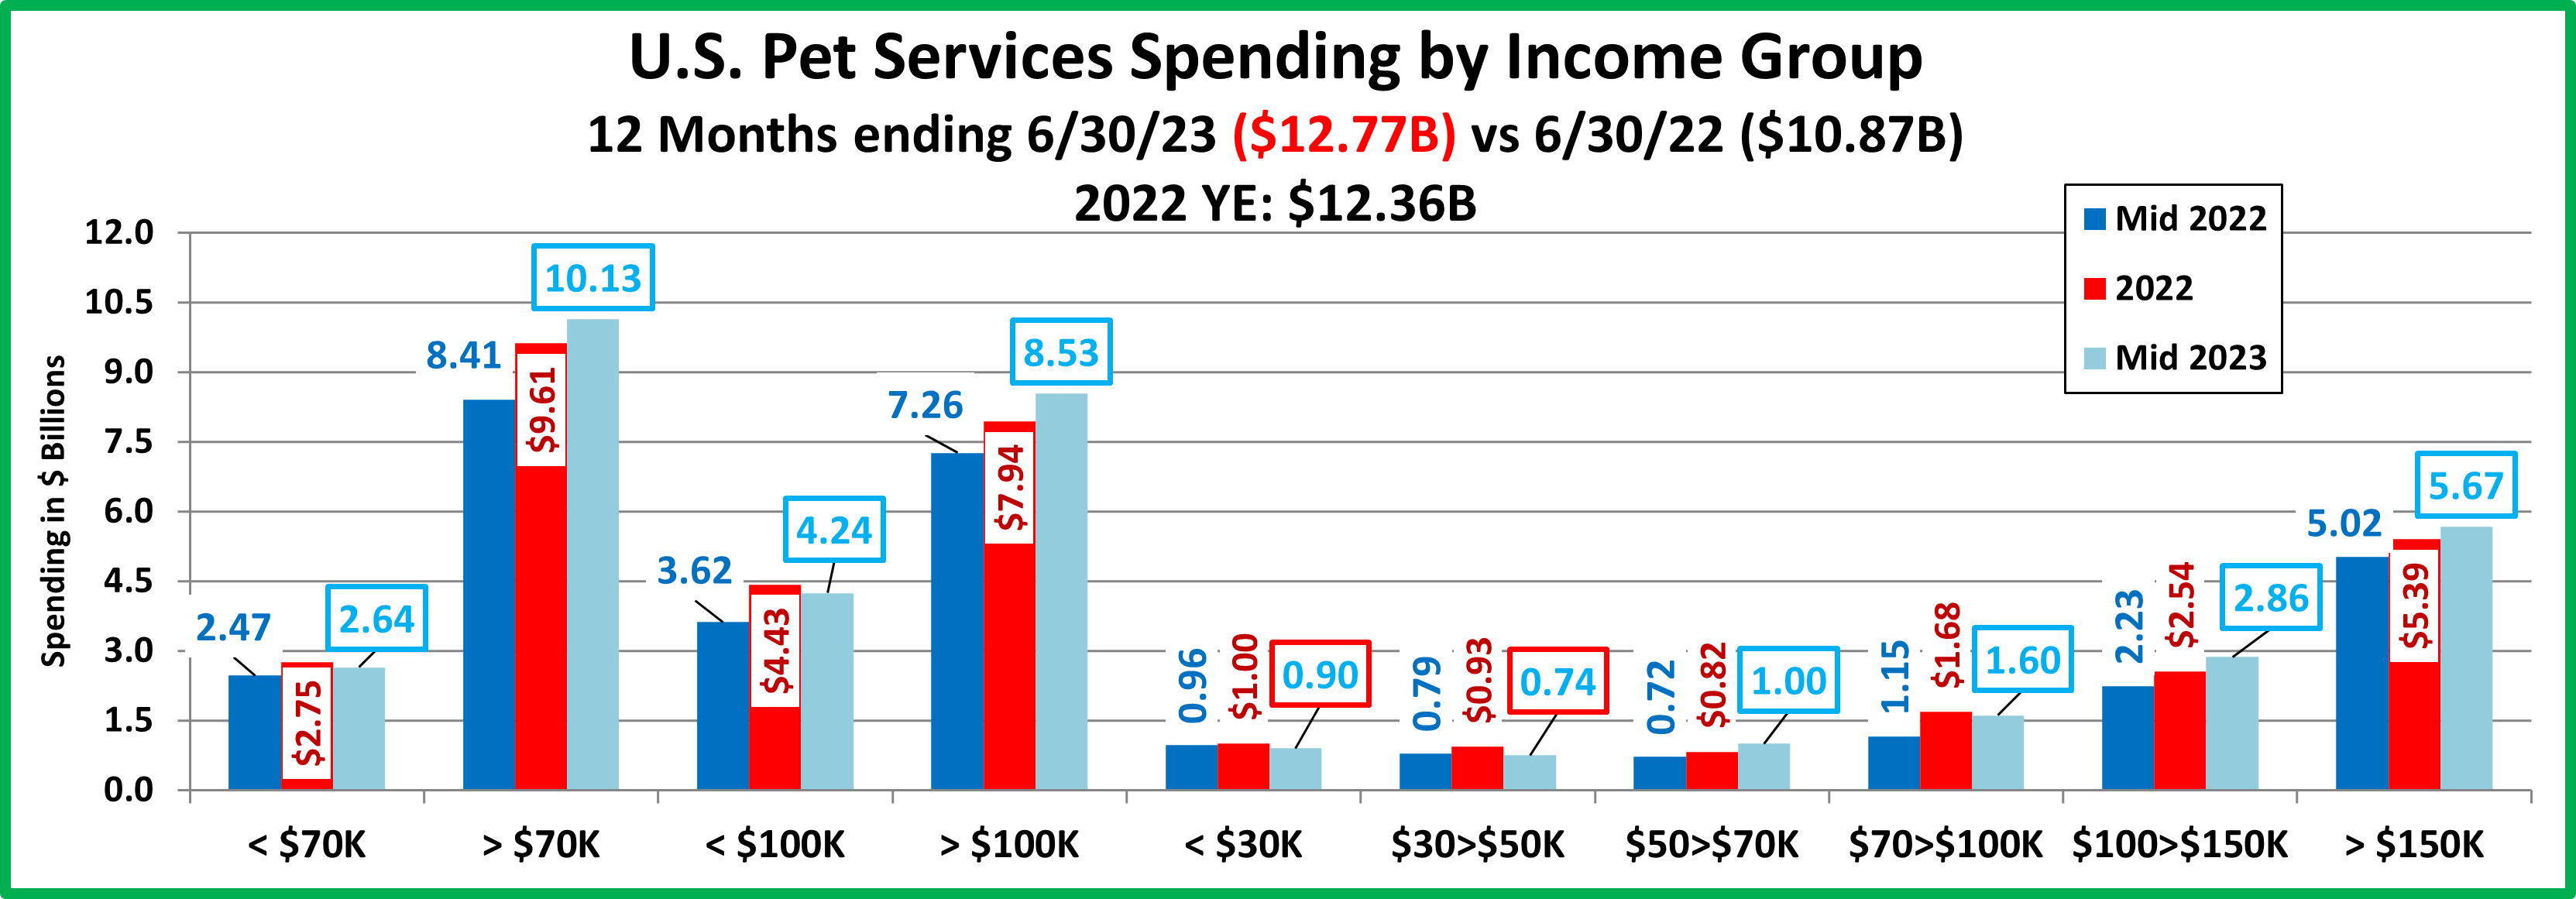
- Services Spending is definitely skewed towards higher incomes. The halfway spending point is about $137K so about 23% of CUs spend 50% of Services $.
- All groups $50K> increased spending while the $ dropped slightly for the <$50K but we should note that all groups had increases in the 2nd half of 2022. However, only $50>70K and $100K> had increases in both halves.
- All groups $50K> had double digit growth with those from $50>150K having spending increases of 28+%. Also, the 2 decreases were small, about -6%.
- The $50>70K group had the worst performance in 22, -20.9%. In 23, they were the best, +39.4%.
- The over $150K group has 18.7% of the CUs but accounts for 44.4% of Services $. This is actually a much larger share than the 37.6% that they had in pre-pandemic 2019. The pandemic has increased the importance of this group.
- Income, especially when it is over $150K, is still by far the biggest factor in the discretionary spending in the Services segment so Services spending is more unbalanced in regard to income. The highest income groups are more driven by convenience than value so high inflation rates are likely to actually increase spending because of higher prices.
Now, Services’ Spending by Age Group.
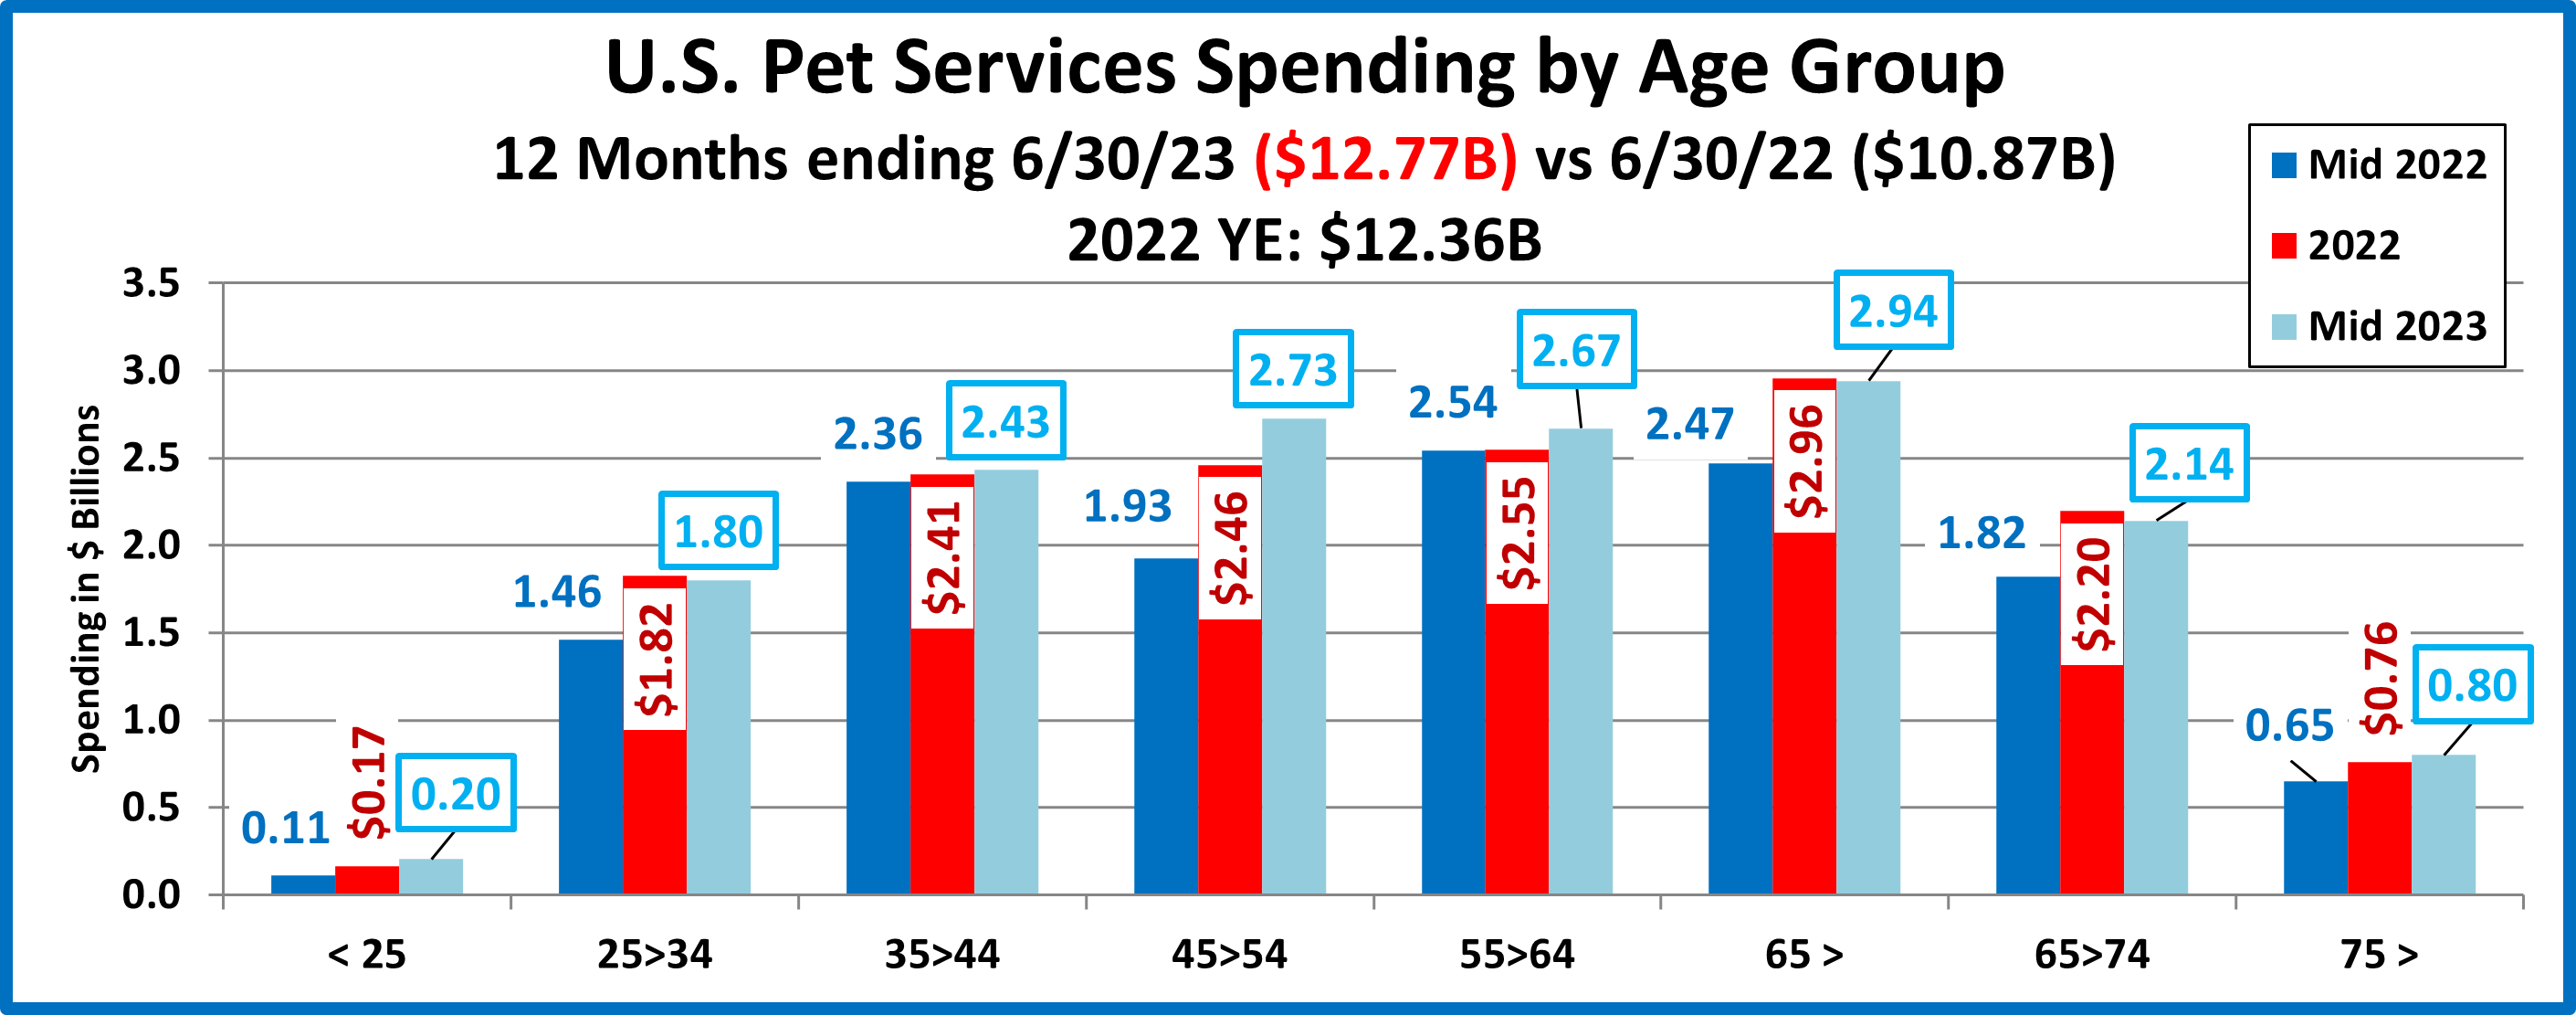
- All groups spent more. The only negatives were small 1st half 2023 drops by 25>34 & 65>74.
- The 45>54 group had the biggest increase, up +$0.8B (+41.5%) and moved from #3 to #1in Services spending.
- The 55>64 yr-olds spent only +$0.13B more (+5.1%) and fell from the top spot to 2nd in spending.
- The 35>44 yr olds had a small increase +$0.07B (+3.0%) and dropped to #3 from #2 in spending.
- Although spending dipped in 23, the 25>34 yr-olds are the only group with 3 consecutive mid-year increases.
- The 65> groups were up $0.47B (+19.0%), driven by a +$0.49B lift in the 2nd half of 2022. You see the importance of Services to older Pet Parents. They actually spend the most. The 65>74 Baby Boomers set the pattern – No Surprise.
- Although <25 spends very little, they had lifts in both halves and an 82% increase over 2022.
Now let’s look at what is happening in Pet Services spending at the start of 2023 across the whole range of demographics. In our final chart we will list the biggest $ moves, up and down by individual segments in 12 demographic categories. The lift in the 1st half of 2023 was +$0.41B vs 2022. Last year it was +$1.77B vs 2021.
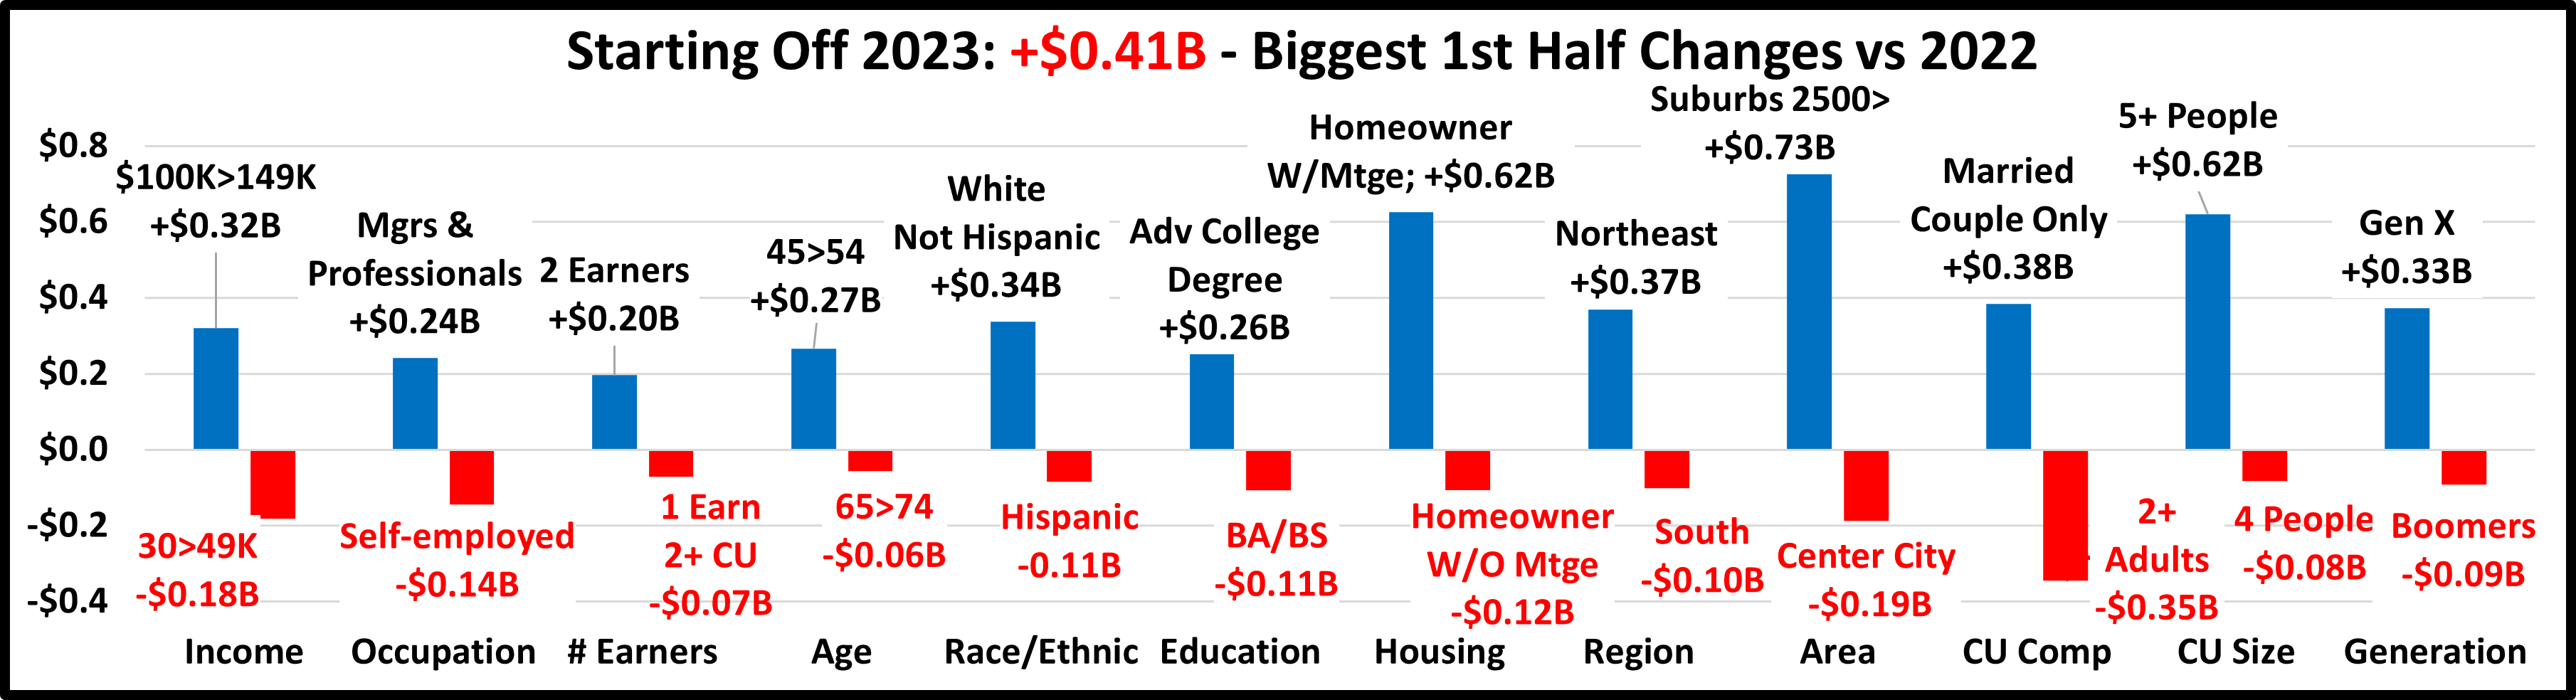
2023 has started slower than 2022 but spending continues to grow. There were no categories where all segments spent more. Last year, there were 5. Back in 2020, there were 4 categories in which all segments spent less. Also, except for CU Comp, the $ changes for the winners are still much larger than the negatives of the losers. The +$0.41B increase in Pet Services came from 52 of 82 demographic segments (63%) spending more. Last year it was 90% and in 2021, 78%. The strong recovery has slowed, but spending is still up +85% from 2020 and even +45% from 2019.
The usual winners have overwhelmingly returned with only 1 minor surprise – 5+ People
Virtually all of the Losers were also expected. Here are the surprises:
- Self-employed
- BA/BS Degree
- Boomers
The older Gen Xers are driving the 1st half lift, replacing the Baby Boomers. Gen X CUs have the largest number of people. Gen Xers have a high income and are educated. 70% own a home, usually in a larger suburb of a major metropolitan area. Also, 70% of Gen X homeowners still have a mortgage. They match most of the “winners”.
Services $ are at a record high and still growing. Let’s review how they got here and speculate on what comes next.
Except for the trauma caused by the Great Recession which hit Services in 2010>11, from 2000 to 2016 the Services segment had slow but consistent growth. The number of outlets also was increasing. Services were gaining in popularity and many retail pet stores were looking for a competitive edge over the growing pet product sales of online retailers. Afterall, you can buy product, but you can’t get your dog groomed on the internet. By 2017 the number of outlets offering Pet Services had radically increased. This created a highly competitive market and the inflation rate dropped to near record lows. Value conscious consumers saw that deals were available, and they took advantage of the situation. However, they didn’t increase the frequency of purchase. They just paid less. This drove overall Pet Services spending down in the 1st half of 2017. The segment started to recover in the 2nd half but not enough to prevent the first annual decrease in Pet Services spending since 2011. However, it was a start. In 2018, more consumers started to recognize the convenience offered by more outlets. The latest big food upgrade was also winding down. The result was that Services started a deeper penetration into the market, especially in the younger groups. The <45 groups spent $1.47B more on Services in 2018, 74% of the total $1.95B increase in the segment. After such a big lift, a slight downturn in 2019 was not unexpected and it happened, -$0.1B. Then came 2020 and COVID. Although the consumer use of Services was becoming increasingly widespread, many Services outlets were deemed nonessential and were subject to pandemic restrictions and closures. Services Spending fell -$1.73B (-20.1%) in 2020 and nearly wiped out the big gain made in 2018.
In 2021, things opened up and Services spending began to rebound with a +$0.55B lift in the 1st half. This lift accelerated in the 2nd half and continued through 2022. Spending slowed in the 1st half of 2023 but reached a new record high of $12.77B, with an annual growth rate of 9.7% since mid-yr 2019. That’s 90% higher than the 5.1% rate from 2009 to 2019. Pet Services have become an important option that is exercised by an increasing number of Pet Parents. However, much of the growth is increasingly being driven by higher incomes. There is some good news in this trend. Higher incomes are less negatively impacted by strong inflation. They buy the same amount, just pay more. This means that Services Spending growth will probably slow but the $ are likely to continue to increase.

