U.S. PET FOOD SPENDING $40.86B (↑$4.51B): MID-YEAR 2023 UPDATE
The pandemic had a huge impact on Pet Food spending and the binge/bust was very visible. Recent strong inflation is also very impactful but is less visible. At Mid-year 2023, the strong $ growth that began in the 2nd half of 2021 continued. Pet Food Spending for the 12 months ending June 30, 2023 was $40.86B, up $4.51B (+12.4%) from a year ago. Let’s put that into proper perspective. In pre-pandemic, Mid-2019 Pet Food spending was $28.90B. That means that the average annual growth rate from 2019>23 is +9.1%. This is 62% higher than the average growth rate of +5.6% from 1984 to 2019. In the topline numbers, this industry segment is doing well. However, a new challenge began in 2022 – radically high inflation in Pet Food prices. Here’s what it was in mid-year 2023:
- Mid-yr 23 vs 22: +14.1%
- 2nd Half 22 vs 21: +14.0%
- 1st Half 23 vs 22: +14.2%
Strong inflation began in 2022. It hit 10+% in June 2022 and prices reached a record high in May 2023. Prices have stabilized but are still within 1% of the peak. Traditionally, “normal” inflation increases have had little impact on Pet Food spending. However, the current increases are historic. While the 2024 inflation rate is now very low, high prices can affect Pet Parents’ buying behavior. We’ll get more evidence of any ongoing cumulative impact when the 2023 yearend Pet Food spending numbers are released in early September.
If inflation was 14.1% for Mid-Yr 2023, then the 12.4% increase in Pet Food spending was really a -1.7% drop in sales. Consumers didn’t buy less. The drop came from a mixture of downgrading, moving to private label and value shopping.
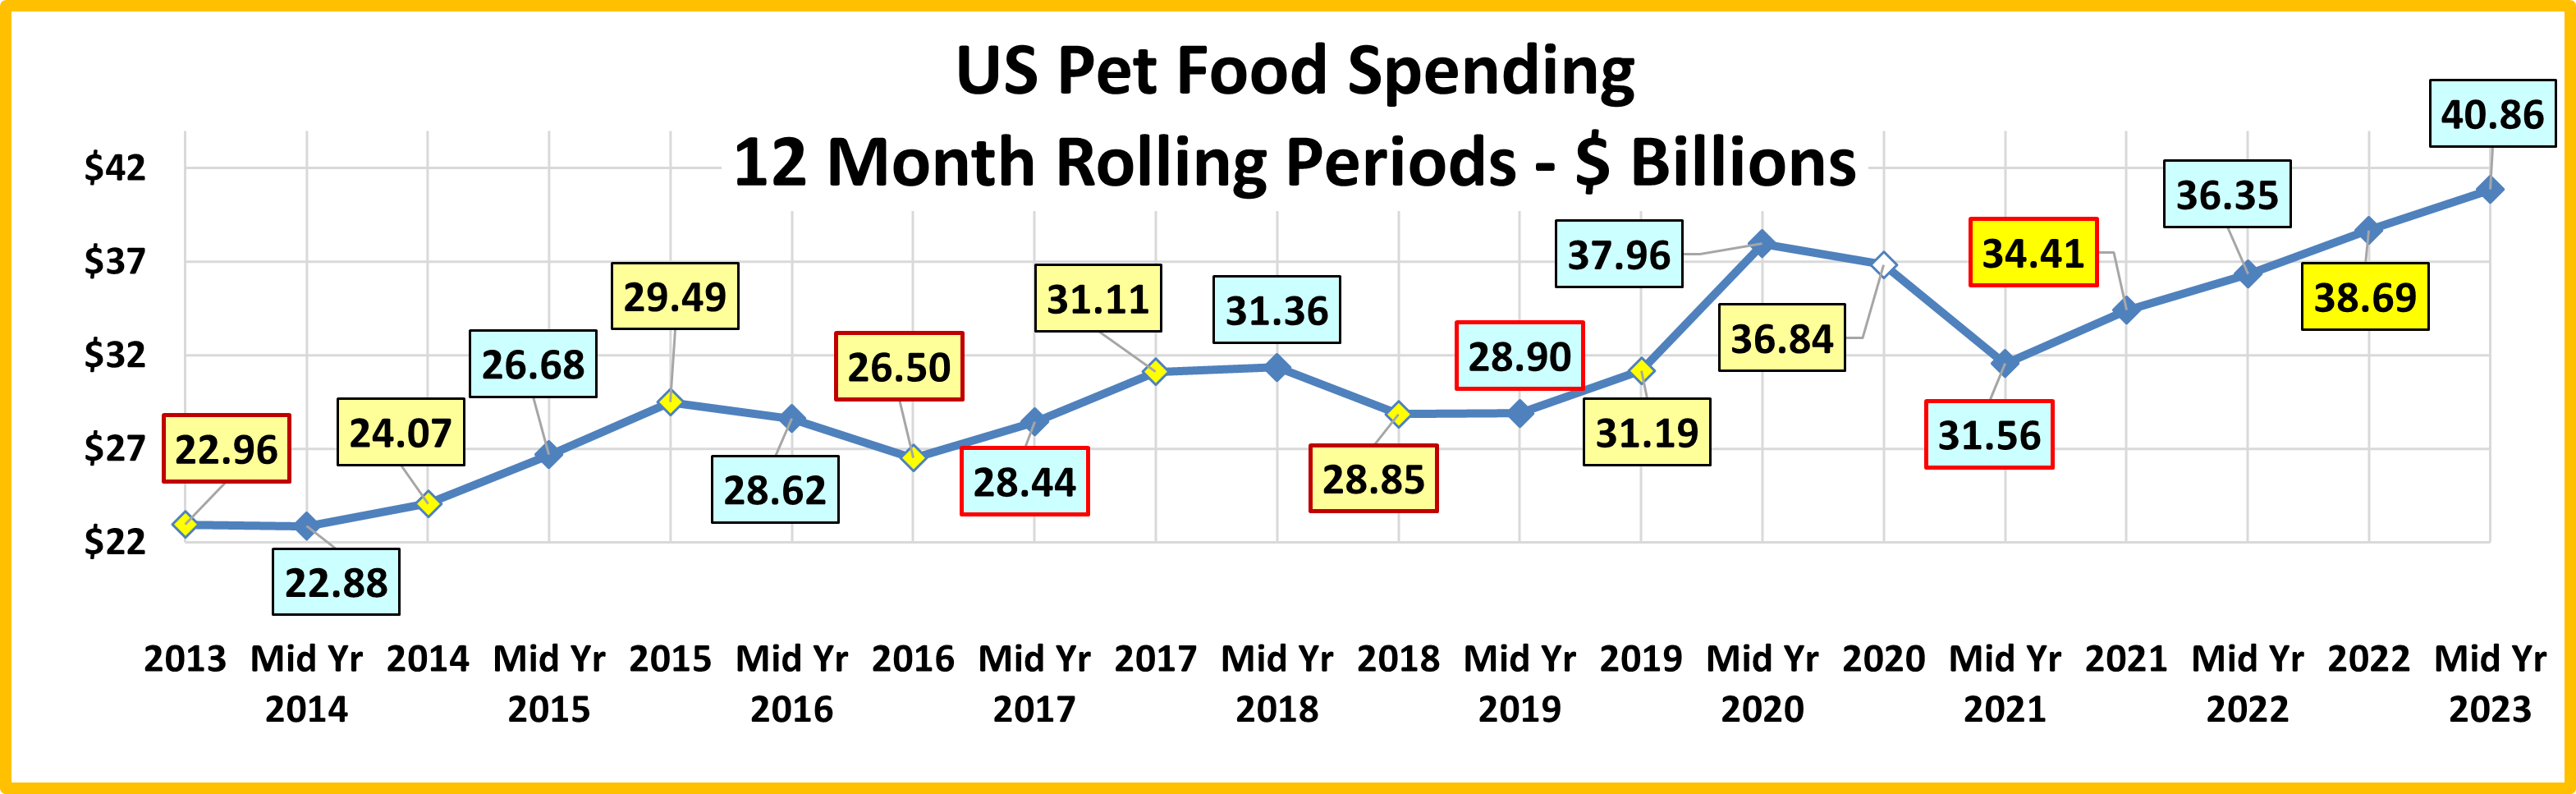
Now, let’s get started with our Pet Food spending update for Mid-Year 2023. Pet Food (& Treat) Spending for the 12 months ending 6/30/23 was $40.86B, up +$4.51B (+12.4%). The following charts and observations were prepared from calculations based upon data from the current CEX report and earlier ones. The first chart will help put the current numbers into historical perspective and truly show you the recent change in the roller coaster ride of Pet Food Spending.
Here are the current numbers:
Mid-Yr 2023: $40.86B; ↑$4.51B (+12.4%) from Mid-Yr 2022. The net gain of $4.51B came from:
◦ Jul>Dec 2022: Up $2.34B from 2021. ◦ Jan>Jun 2023: Up $2.17B from 2022.
Historical research has shown that Pet Food spending has been on a roller coaster since 2000, generally with 2 years up, followed by a flat or even declining year. This up and down “ride” was primarily driven by a succession of Food trends like Made in the USA, Natural and Super Premium”. The 2 yrs up then 1 yr flat/down pattern has been broken on a couple of occasions due to outside influences – the FDA grain free warning in 2018 and the COVID pandemic in 2020. We may see another major influence on spending – skyrocketing inflation. Right now, we’re seeing strong, consistent growth but it is primarily due to higher prices. We’ll see what happens, but the Pet Food spending rollercoaster ride is likely to continue in some form.
2013 was definitely a game changer for this segment as it began an extended period of deflation which continued through 2018. Midway through 2018, Pet Food prices were still 2.3% lower than in 2013. The spending drops in 2013 and 2016 were driven by pet parents value shopping for their recently upgraded pet food. As it turns out, 2014 brought out yet another new factor in Pet Food spending.
For over 30 years Baby Boomers were the leaders in Pet Food, both in spending and in adopting new products. Even in 2023, they still spend the most, but it turns out that the 25>34 yr-old Millennials led the movement to Super Premium in late 2014. The older groups, especially Boomers followed in 2015 and spending rose $5.4B. At the same time, the Pet Food spending of the 25>34 yr olds dropped. At first, we thought they had rolled back their upgrade. However, it turns out that they were leading the way in another element of the trend to Super Premium – value shopping. The Boomers once again followed their lead and spending fell -$2.99B in 2016. The Super Premium upgrade movement had 3 stages:
- Trial – The consumer considers the benefits vs the high price and decides to try it out. Usually from a retail outlet.
- Commitment – After a period of time, the consumer is satisfied and is committed to the food.
- Value Shop – After commitment, the “driver” is to find a cheaper price! – The Internet, Mass Market, Private label.
This brought us to 2017. Time for a new “must have” trend. That didn’t happen but competitive pricing brought about another change. Recent food trends have been driven by higher income and higher education groups. However, the “value” of Super Premium was established and now more “available”. Blue Collar workers led a new wave of spending, +$4.6B, as Super Premium penetrated the market more deeply. 2018 started off slowly, +$0.25B. Then came the FDA warning on grain free dog food. Many of the recent Super Premium converts rolled back their upgrade and spending fell -$2.51B. This decrease broke a 20 year spending pattern. In the 1st half of 2019, Pet Food spending remained stable at the new lower level. In the second half of 2019 we started to see a recovery from the overreaction to the FDA warning and spending increased by $2.3B. Then came 2020. The recovery was continuing but a new outside influence was added – the COVID-19 pandemic. In March nonessential businesses were closed. This also produced a wave of panic buying in some truly essential product categories. In the Pet Industry there is only 1 truly essential category – Pet Food. Coupled with the FDA “recovery” and the ongoing movement to Super Premium, this produced an incredible $6.76B lift in Pet Food Spending in the 1st half of 2020. Spending fell in the 2nd half of 2020 and plummeted in the 1st half of 2021. Pet Parents didn’t binge again, and some began using up the stockpile that they panic bought in the early days of COVID. In the 2nd half of 2021, the up/down impact of COVID was essentially over. Pet Parents were still committed to their children’s health which included Super Premium Foods and Medical Supplements, often in treat form. The internet also made this quality choice accessible to more households, so Pet Food spending increased both in the 2nd half of 21 and the 1st half of 22. In 2022, strong inflation began. Prices peaked in May 2023 but remained high. Sales had strong growth in both the 2nd half of 22 and the 1st half of 23. However, inflation drove 100+% of the lift as there was a “real” -1.4% drop in Pet Food Sales. Strong inflation has stopped but prices remain within 1% of the peak. We’ll see what happens.
Let’s look at Pet Food spending by the 2 most popular demographic measures – income & age group. They both show the current and previous 12 months $ as well as 2022 yearend. This will allow you to track the spending changes between halves. The first graph is Income, which has been shown to be the single most important factor in increased Pet Spending and its influence continues to grow.

Here’s how you get the change for each half of the 22>23 mid-yr numbers using the over $100K group as an example:
- $100K> Mid-yr Total Spending Change: $20.45B – $16.36B = Up $4.09B (green outline = increase; red outline = decrease)
- 2nd half of 2022: Subtract Mid-22 ($16.36) from Total 2022 ($17.60B) = Spending was up $1.24B in 2nd half of 2022.
- 1st half of 2022: Subtract Total 2022 ($17.60B) from Mid-23 ($20.45B) = Spending was up $2.85B in 1st half of 2023.
- Spending was mixed for the year in the smaller segments but there were basically 3 different patterns in the individual groups. #1. $150K>, $100>149K & <$30K spent more in both halves. #2. $30>49K & $50>69K spent less in the 1st half of 2023. #3. $70>99K spent less in both halves. Note: The very price sensitive groups from $30K to $99K all had spending drops when inflation peaked in the 1st half of 2023.
- Perhaps the most obvious fact is the continued spending disparity due to income. Back in 2014, prior to the big lift due to Super Premium, $70K was the “halfway point” in Pet Food spending. The under $70K group accounted for 66.7% of CUs and 51.1% of Pet Food spending. They lost the lead in 2015 as $70K> spent 50.8% of Pet Food $. In 2020, the binge buying of Pet Food by $100>150K pushed the $100K> group to the top at 55.1%. Then the big drop in 2021 flipped $70K> back into the lead at 60.8%. High inflation has caused another flip as $100K> is back on top with over 50.0%. The halfway point in Pet Food spending grew from $91K to $100K, the 2nd highest in history.
- < $70K > The Pet Food spending patterns of these big groups changed in 2023. The Fall 2022 lift is larger for <$70K. However, that changed in 2023 when their sales fell while $70K> $ spiked. The impact of Higher Inflation on most lower incomes is very apparent in this big group.
- < $100K > The spending patterns of these 2 groups closely mirrors the Under/Over $70K pattern except that the Fall 2022 spending lift for the $100K> group was slightly larger than for <$100K. The Total Spring 2023 lift came from the lowest and highest income groups, but with a $2.85B lift, $100K> was the primary driver.
- <$30K – With a lift in the Fall and an even bigger increase in the Spring, spending for this lowest income group grew 31.2%, over twice the inflation rate. They obviously have a strong commitment to the health of their pet children.
- $30>49K – This low-income group includes many Retirees. They are definitely committed to their pets, but their timing often lags behind other groups. The drop in 2023 was probably due to value shopping after their big 2022 lift.
- $50>69K – This low-income group was hit hard by the pandemic. With strong growth in the 2nd half of 2022 and only a minor drop in 2023, their Pet Food spending is again above pre-pandemic 2019.
- $70>99K –This middle-income group was the most negatively affected by the pandemic. However, they fully recovered in 2021. Spending flattened in early 2022, then dropped in the 2nd half and 1st half of 2023. They are very value conscious. The skyrocketing inflation in late 2022 and early 2023 obviously affected their Pet Food spending.
- $100K>149K – High income is increasingly becoming “where it’s at” in Pet Spending. This group led the way in Pet Food binge buying and the subsequent drop. Sales grew in both halves but 57% of the lift was due to inflation.
- $150K > Their Pet Food spending also fell in 2020, likely due to value shopping on the internet. They came back strong in 2021, Their pattern is similar to $100>149K but with a bigger lift in 2023. 53% of the lift was from inflation.
Now let’s look at Pet Food spending by Age Group.

- <25 & 75> yr olds had spending drops from 2022. All other groups spent more.
- <25 – After a huge increase in 2022, their spending fell -30%, but it’s still $1B. Most of the drop occurred in the 1st half of 2023 when prices peaked. It’s likely mostly due to downgrades, switching to private label & value shopping.
- 25>34 – Up $1.42B, a strong rebound from last year’s -$1.35B drop. This group, especially those with families, are under a lot of financial pressure. They ignored it and spent 34% more. Only 41% of the lift was from inflation.
- 35 > 44 – Spending grew overall but fell in 2023 likely because high prices intensified value shopping. They are 2nd in income and their spending has smaller fluctuations. They are again above $6B at mid-year but broke $7B in 2022.
- 45 > 54 and – They have the highest income, so an annual up/down spending pattern is not expected. Their Pet Food $ dropped throughout 2020 but it has increased in every half since then. In 2023, it is now above the previous peak of $7.09B in 2019. The money is definitely there but 54% of the lift came from inflation.
- 55>64 – This group is still mostly Boomers, the most emotional Pet Parents. In 2020 they led the way in Pet Food binge buying. They also had the biggest 2021 drop. With growth in both halves for 2 consecutive years, including a $1.5B lift in mid-2023 they are now 33% ahead of their pre-pandemic 2019 spending level.
- 65 > 74– This group is all Boomers but with lower income. Spending grew slightly in both halves. They are committed to their pets. Even though the members change, they are the only age group with steady annual growth since 2016.
- 75> – In 2021 they upgraded. Spending plummeted in the 2nd half of 22 then grew in 23 but was negative for mid-yr.
That gives us the “big picture” for our 2023 Mid-year update of Pet Food spending. Now we’ll take a closer look at the start of 2023. We’ll compare it to the 1st half of 2022 and document the biggest $ changes since then.
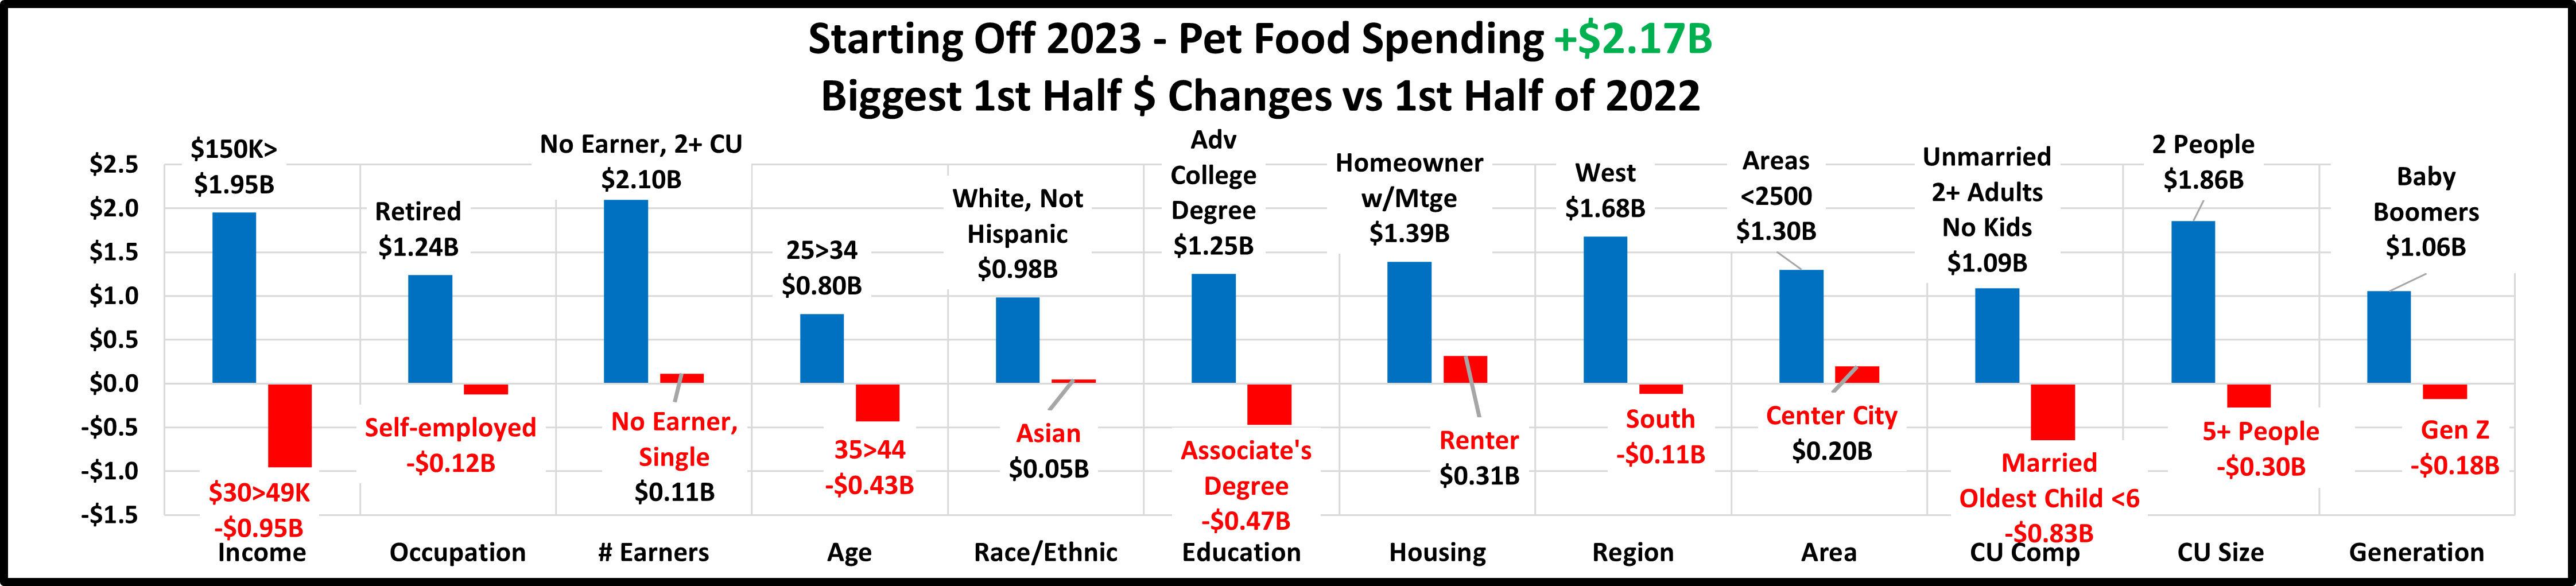
- The biggest increases are much larger than the biggest decreases in all categories. In 4 categories – # Earners, Race/Ethnic, Housing and Area, all segments spent more in 2023 than in 2022.
- There are a number of usual winners, $150K>, White, Not Hisp., Adv College Degrees, Boomers and Homeowners w/Mtges. There are also some surprises like Retirees, 2+ Unmarried Adults, No Earner in 2+CUs and 25>34 yr-olds.
- When we look at the losers, we also see some familiar names, $30>49K, Gen Z, No Earner Single and Center City. However, there are 2 big surprises – Self-employed and 35>44 yr olds.
- Pet Food spending in the 1st half of 2023 was $2.17B ahead of the 1st half of 2022 but $5.61B ahead of 2019. In fact, 66 of 82 demographic segments (80%) spent more in 2022 than in 2021. The widespread growth continues.
The spending lift was large in the 1st half, but not unexpected. After the huge drop in Pet Food $ in the 1st half of 2021 following the buying binge in 2020, we’ve had 4 consecutive halves with strong growth. The pandemic roller coaster ended in 2021 and we now appear to be on a path of consistent growth. Pet Food spending in mid-yr 2023 was $40.86B. This is $2.9B above the binge peak of $37.96B in mid-2020 and $11.96B more than the $28.90 in pre-pandemic mid-yr 2019. If we ignore the pandemic turmoil, then Pet Food spending has grown 41.5% in 4 years. That’s an annual growth rate of +9.1%, which is 62% higher than the +5.6% rate from 1984 to 2019. That’s real proof that the Pet Food segment is back and doing even better than usual. Unfortunately, a new challenge has risen and may have driven most of the strong growth – runaway inflation. It started slowly at the end of 2021, then continued to grow in 2022, hitting 10+% in June 2022. Prices peaked in May 2023 but are still high. Past periods of Pet Food inflation just caused Pet Parents to spend more. Pets must have food. However, this price increase is at record levels. We should note that the pandemic is also a factor in inflation because supply chain issues related to COVID had a big impact on prices. Overall inflation has lessened and dropped in Pet Food in 2024. All pet spending has been moving towards higher incomes. Households with a lot of financial pressure could cut back on more discretionary pet spending, reduce purchase frequency, and even downgrade their pet food. We see evidence of inflation’s negative impact on Pet Food in early 2023 as the 12.4% lift was really a -1.7% drop. We’ll see what happens in the 2nd half of 2023 when get the 2023 data in September

