
2021 Pet Services Spending was $9.10B – Where did it come from…?
Next, we will look at Pet Services. It is still by far the smallest Segment, but like Supplies and Veterinary, it too had a record increase in 2021, up $2.21B (+32.0%). After the great recession, Services’ annual spending slowly but steadily increased. During this time, the number of outlets offering Services strongly grew as brick ‘n mortar retailers looked for a way to combat the growing influence of online outlets. After all, you can certainly buy products, but you can’t get your dog groomed on the Internet. This created a highly price competitive market for Pet Services. In 2017 there was a slight increase in visit frequency, but Pet Parents just paid less. This resulted in a 1.0% decrease in Services spending. In 2018 consumer behavior changed as a significant number decided to take advantage of the increased availability and convenience of Pet Services and spending literally took off, +$1.95B (+28.9%), by far the biggest increase in history. In 2019 Pet Parents, especially the younger ones, value shopped, and spending turned down $0.10B. In the 2020 pandemic Services outlets were often deemed nonessential and were subject to restrictions and closures which drove a huge drop in $. In 2021 things opened up again and Pet Parents came back to Services generating the biggest $ increase ever.
The Pandemic had a radically different impact depending on whether a segment was necessary or discretionary. Services spending is arguably the most discretionary of any Pet Expenditure. Let’s look deeper into 2021 spending demographics.
Let’s start by identifying the groups most responsible for the bulk of Services spending in 2021 and the $2.21B increase. The first chart details the biggest Pet Services spenders for each of 10 demographic categories. It shows their share of CU’s, share of Services spending and their spending performance (Share of spending/share of CU’s). In order to better target the bulk of the spending we had to alter the groups in two categories – income and area. The performance level should also be noted as 7 of 10 groups have a performance level above 120%, equaling their previous high set in 2018. This is the most for any segment – 6 for Supplies and Veterinary and only 5 for Food and Total Pet. Last year they had only 5 over 120%. This indicates that the disparity between the best and worst performing segments grew in 2021. Income is still the biggest factor in Services Spending and its importance is growing. The categories are presented in the order that reflects their share of Total Pet $ which highlights the differences of the 8 matching groups. For Services, the share ranking differences from Total Pet are small. Married Couples replaced 35>64 at the bottom.
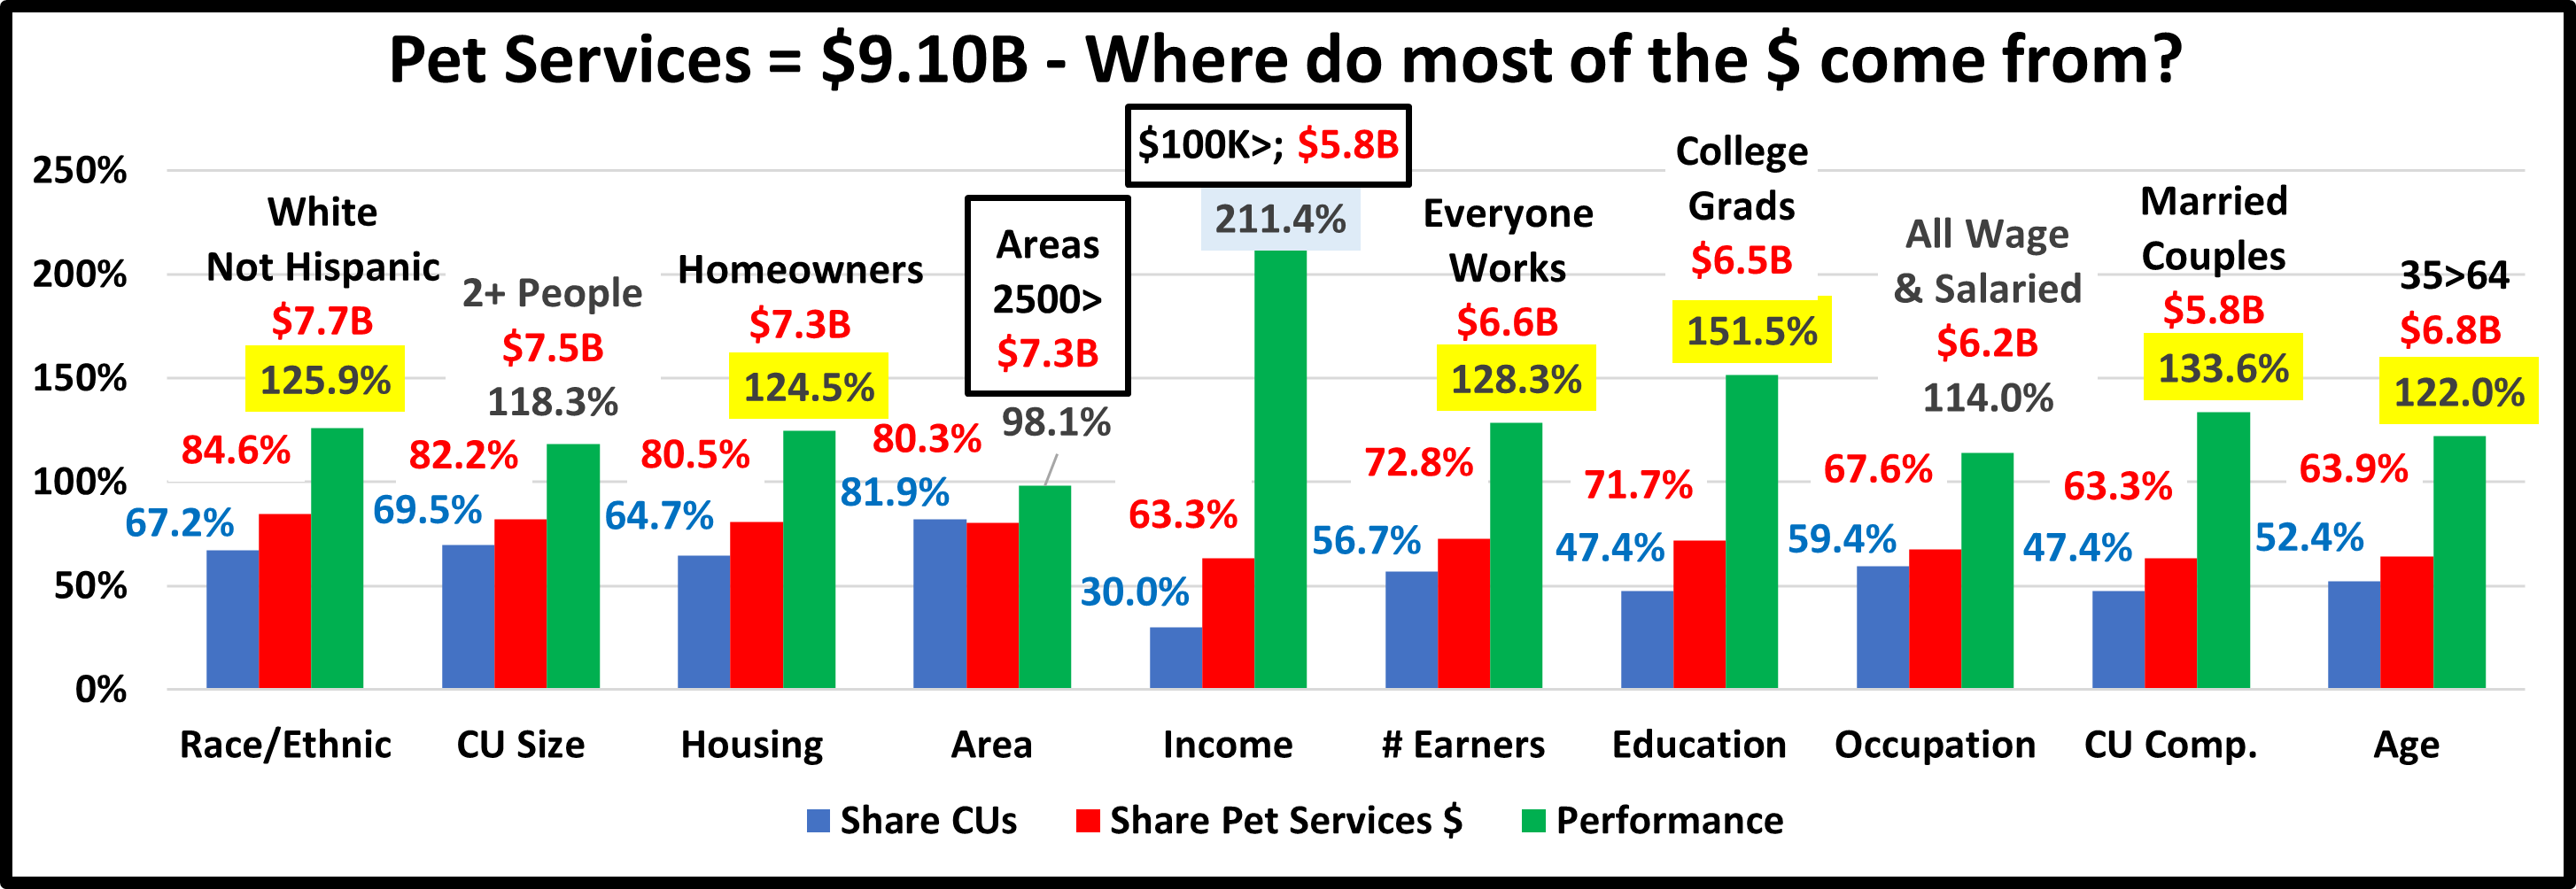
- Race/Ethnic – White, not Hispanic (84.6%) down from 87.9%. This big group accounts for the vast majority of spending in every segment. Services Spending became slightly more diverse in terms of race and ethnicity in 2021 as their performance decreased from 128.5% to 125.9% and they fell from 4th to 5th place in terms of importance.
- # in CU – 2+ people (82.2%) up from 78.3% The share for 2+ CU’s is over 79% for all segments and Services is 2nd to Supplies’ 83.3%. Their performance also increased from 111.6% to 118.3% but they stayed in 8th place in importance. All sizes spent more, with the biggest lift, +$1.3B from 2 Person CUs. Singles were only up $0.12B, +28%.
- Housing – Homeowners (80.5%) up from 78.3%. Homeownership is a big factor in spending in all industry segments. The Homeowners’ share of Services grew and Supplies replaced them at the bottom. Their performance grew from 119.3% to 124.5% and they rejoined the 120+% club at #6. Those w/Mtges led the way, up $1.4B, +36.4%.
- Area – City/Suburbs >2500 (80.3%) down from 83.3% in share, and performance fell from 102.7% to 98.1%, the only big group not earning its share of $pending. Services is an Urban Segment. All Areas spent more but Center City had only a small increase which drove down the group’s share and performance.
- Income – $100K> (63.3%) up from 57.2% This group’s performance rating is 211.4%, up from 201.0%. CU income is still by far the most important factor in increased Pet Services Spending. Only the $40>49K income group spent less, -$0.14B. However, the spending increase was strongly skewed towards higher incomes. The over $100K group has 30.0% of all CUs but generated 82.4% of the $2.21B lift in $pending.
- # Earners – “Everyone Works” (72.8%) up from (69.9%) All adults in the CU are employed. Income is important so a high market share is expected. Their performance grew to 128.3% from 122.0% and they moved up to #4 from #5 in importance. Only No Earner, Single CUs spent less. Households with 2+ Earners account for 39.3% of all CUs but they generated 73.8% of the increase. Retirees are important to Services but overall, more workers = more $.
- Education – College Grads (71.7%) up from 68.5%. Income generally increases with education so Services spending grows with increasing education. College Grads spend the most so they were hit hardest by the pandemic and then had the strongest recovery. Performance grew from 146.6% to 151.5% and education stayed #2 in importance.
- Occupation– All Wage & Salaried (67.6%) up from 66.8% and their performance rating increased from 108.7% to 114.0%. – Only Operators/Fabricators/Laborers spent less on Services. Managers & Professionals had the biggest increase, +$1.02B (+36.5%). Most Occupational segments had an increase in the 25>40% range. The exception was Self-Employed, only +12%. This drove the increase in share and performance for the big group. Services spending became a little more balanced among Salaried/Wage Workers but a little less balanced in terms of Occupation.
- CU Composition – Married Couples (63.3%) up from 62.8%. Married couples are a big share of $ and have 128+% performance in all segments. Their performance increased to 133.6% from 129.4% and they stayed in 3rd place in terms of importance to Services spending. Only Married, Oldest Child <6 spent less. The biggest $ increase came from Married Couple Only, +$0.81B but the biggest % lift was in Unmarried, 2+ Person, All Adult CUs, +66.7%.
- Age – 35>64 (63.9%) up from 62.5%. Their performance grew from 117.1% to 122.0% and they entered the 120+% club at #7. Only 45>54 spent less, -$0.02B. All other groups had double digit % increases. The 35>44 group led the way, up $0.78B (+61.3%) but they were closely followed by 55>64, +$0.75B (+56.3%).
We changed 2 of the groups for Services – Income and Area, to better target the biggest spenders. We should also note that Income is still more important to spending in Services than in any other segment. Except for Race/Ethnic and Area, the big groups gained in share and performance. Also, Services now has 7 groups performing at 120+%, the most of any segment. Overall, in 2021 Services spending became slightly less demographically balanced.
Now, we’ll look at 2021’s best and worst performing Pet Services spending segments in each category.
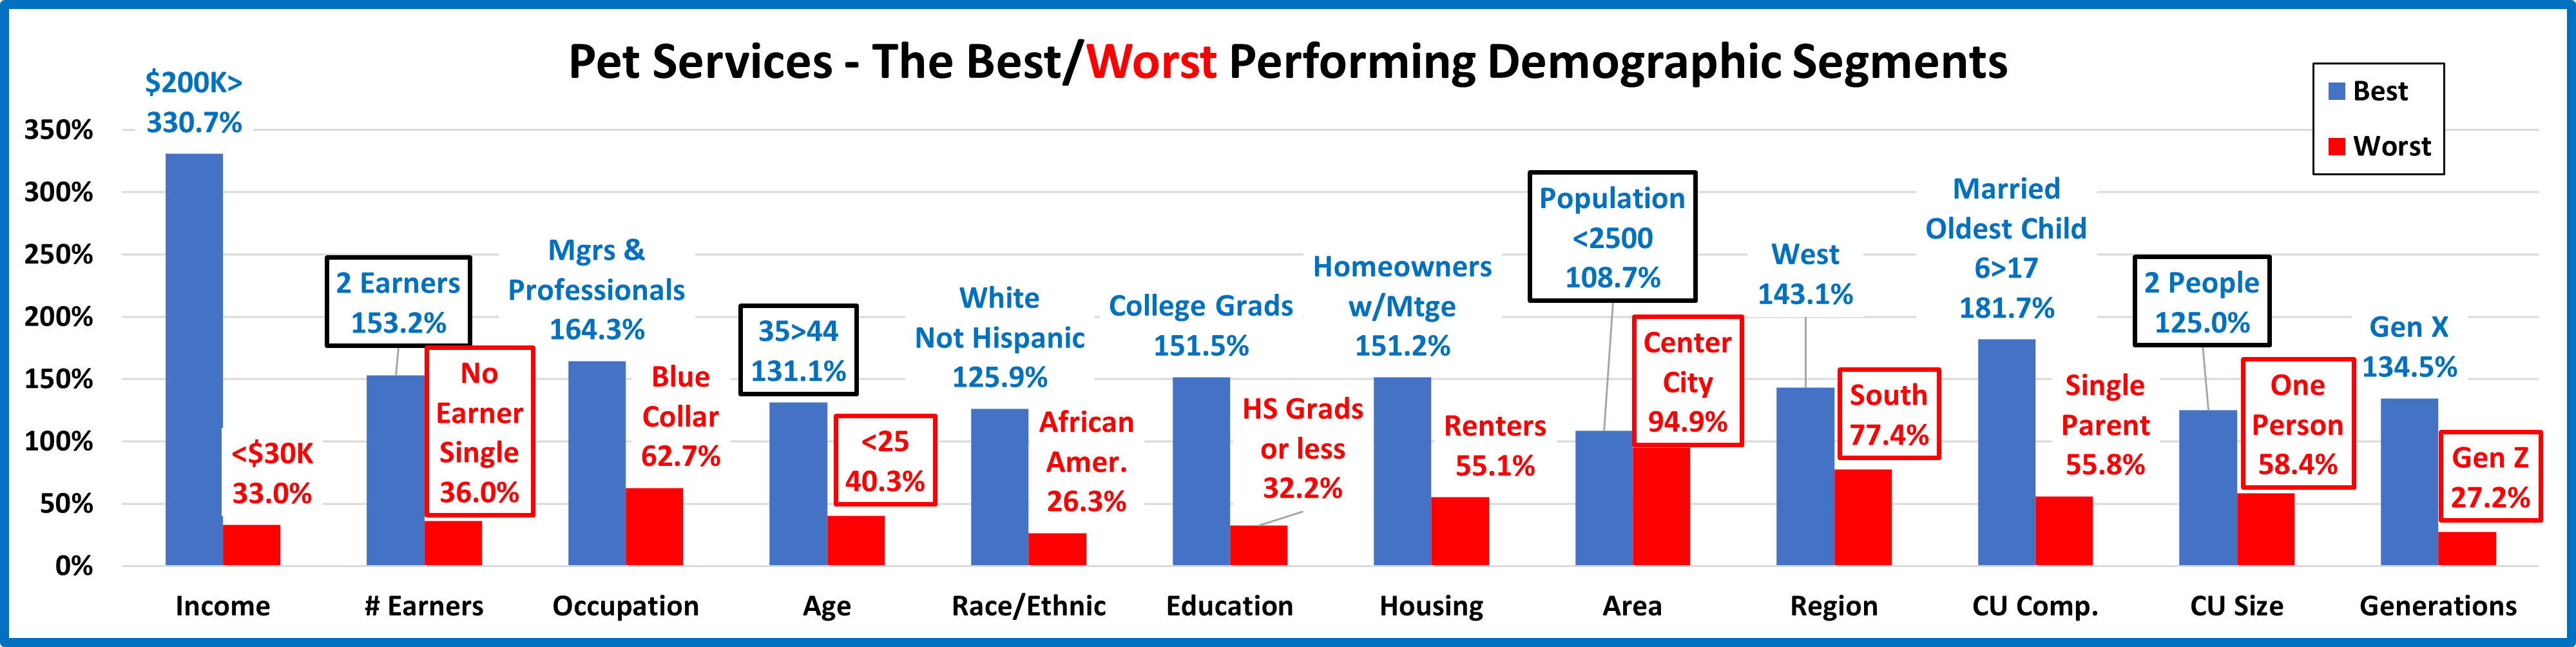
Except for Area the best & worst performers are not a surprise. There are 10 that are different from 2020, 4 of the best and 6 of the worst, 3 more than last year. Area shows an unusual move away from high population. The high income Gen Xers stayed on top, but spending shifted towards their younger members, 35>44. However, it wasn’t a total youth movement. The youngest groups replaced the oldest at the bottom. Changes from 2020 are “boxed”. We should note:
- Income is even more important to Pet Services. The $200K> group has its best performance in this segment.
- # Earners – 2 Earners replaced 3 Earners and No Earner, Singles replaced No Earner, 2+ CUs. No Surprises.
- Generation – Gen X retained Top Spot and the youngest group, Gen Z replaced the oldest, born before 1946 at the bottom. Boomers also earned their share with 102.8% performance and Millennials were close at 97.8%.
- Age – 35>44 is mostly Gen X and the 2nd highest income group. All groups from 35>64 performed at 100+%. The lowest performers were at both ends of the age spectrum with <25 replacing 75> at the bottom.
- Area – Two Surprises. The <2500 Area flipped from Last to First. Services $ are skewed towards population density. The big Suburbs 2500> are the normal winners but Center City also usually performs above 100%.
- Region – The usual Winner but Northeast performance was also strong, 111.8%. The biggest change was the huge difference between 1st and Last. Normally, regional performance is more balanced with all performing above 88%.
- CU Size – 2 Person CUs edged out last year’s winner, 4 People and returned to the top spot. Only Singles performed below 100% and they returned to their usual spot at the bottom.
In Pet Services spending performance, income is still the major factor. Spending began skewing younger in 2018. They slipped a little in 2019 but they basically held their ground during the 2020 pandemic. In 2021, Boomers, Millennials and the younger Gen Xers all got on board to drive the record rebound in Supplies Spending.
It’s time to “Show you the money”. Here are segments with the biggest $ changes in Pet Services Spending.

In this chart you immediately see the difference from last year. In 2020 there were 3 categories in which all segments spent less on Services. In 2021 there were 5 where all segments spent more. The changes by the winners were also radically larger than the losers. The tumult of 2020 continued but it was all positive. There were no repeats and 9 segments switched from last to first. 3 segments flipped from 1st to last but they all had spending increases. In fact, 90% of 96 demographic segments spent more on Services. Here are the specifics:
- Race/Ethnic – Last year’s big loser, White, Not Hispanic, flipped to the top.
- Winner – White, Not Hispanic – Services: $7.70B; Up $1.64B (+27.1%) 2020: Hispanic
- Loser – Asian – Services: $0.21B; Up $0.06B (+43.5%) 2020: White, Not Hispanic
- Comment– All groups spent more. Hispanics finished 2nd , up $0.36B (+69.8%).
- # Earners– 2 Earners went from last to first.
- Winner – 2 Earners – Pet Services Spending: $4.26B; Up $1.40B (+49.0%) 2020: 3+ Earners
- Loser – No Earner, Single – Pet Services Spending: $0.43B; Down $0.05B (-9.6%) 2020: 2 Earners
- Comment – Only No Earner, Singles spent less, but No Earner, 2+ CUs doubled their spending, +100.7%.
- Housing – Both winner and loser flipped back to their “usual” positions.
- Winner – Homeowner w/Mtge – Services: $5.18B; Up $1.38B (+36.4%) 2020: Renter
- Loser – Renter – Services: $1.77B; Up $0.29B (+19.7%) 2020: Homeowner w/Mtge
- Comment – All spent more as Homeowners w/o Mtges had a 33.1% increase.
- # in CU – The winner flipped from last place in 2020 but the loser is new.
- Winner – 2 People – Pet Services Spending: $3.75B; Up $1.26B (+50.8%) 2020: 4 People
- Loser – 3 People – Pet Services Spending: $1.31B; Up $0.08B (+6.4%) 2020: 2 People
- Comment: All segments spent more. The 2 person lift was primarily driven by the Married Couple Only segment.
- Education – Advanced College Degree flipped from last to 1st, back to their normal spot.
- Winner – Adv. College Degree – Pet Services Spending: $3.45B; Up $1.20B (+53.3%) 2020: HS Grads
- Loser – <HS Grads – Services Spending: $0.14B; Down $0.02B (-13.2%) 2020: Adv. College Degree
- Comment – Only those without a HS Diploma spent less but College Grads drove the lift. They have 47.4% of CUs but they provided 81.9% of the Services spending increase.
- Income – Both winner and loser are new.
- Winner – $200K> – Pet Services Spending: $2.58B; Up $1.02B (+65.5%) 2020: $50>69K
- Loser – $40 to $49K – Pet Services Spending: $0.28B; Down $0.06B (-18.7%) 2020: $100 to $149K
- Comment – No surprises. The $40>49K group had the only spending decrease. Lower income groups normally occupy this position. The $200K> group makes the most $ and in 2021 they used some of those $ for Services.
- Occupation – Mgrs & Professionals flipped from last back to their usual position on top.
- Winner–– Mgrs & Professionals – Pet Services Spending: $3.81B; Up $1.02B (+36.5%) 2020: Self-Employed
- Loser – Operators & Laborers – Pet Services Spending: $0.18B; Down $0.02B (-12.1%) 2020: Mgrs & Profess.
- Comment – Only Operators/Laborers spent less. Retirees also had a good year, up $0.41B (+43.5%).
- Region – The South flipped from 1st to last.
- Winner – West – Pet Services Spending: $2.96B; Up $0.96B (+48.2%) 2020: South
- Loser – South – Pet Services Spending: $2.73B; Up $0.08B (+3.0%) 2020: Midwest
- Comment – In 2020 all Regions spent less. In 2021 all Regions spent more – a major turnaround.
- Area Type – Both the winner and loser flipped positions. All areas spent more.
- Winner – Suburbs 2500> – Pet Services Spending: $4.24B; Up $0.91B (+27.3%) 2020: Areas <2500
- Loser – Areas <2500 – Pet Services Spending: $1.79B; Up $0.65B (+56.3%) 2020: Suburbs 2500>
- Comment – Two straight years with Center City not either winning or losing – surprising!
- Generation – Boomers flipped from last to first. No Food binge in 2021, so they spent more in other segments.
- Winner – Baby Boomers – Services: $3.06B; Up $0.86B (+39.5%) 2020: Gen Z
- Loser – Born <1946 – Services: $0.35B; Down $0.07B (-16.4%) 2020: Baby Boomers
- Comment – Last year only Gen Z spent more. In 2021 they spent less along with those born <1946. Boomers had the biggest increase but both Gen X and Millennials spent $0.7B+ more.
- CU Composition – Married, Couple Only flipped from last to first.
- Winner – Married, Couple Only – Services: $2.61B; Up $0.81B (+44.9%) 2020: Married, Oldest Child 6>17
- Loser – Married, Oldest Child <6 – Services: $0.29B; Down $0.02B (-7.9%) 2020: Married, Couple Only
- Comment – Only Married, Oldest Child <6 spent less. Married, Couple Only won, but Married, Oldest Child 6>17 was +$0.47B and 2+ Unmarried, All Adult CUs spent $0.59B more.
- Age – Both winner and loser are new.
- Winner – 35>44 yrs – Pet Services Spending: $2.05B; Up $0.78B (+61.3%) 2020: <25 yrs
- Loser – 45>54 yrs – Pet Services Spending: $1.68B; Down $0.02B (-1.2%) 2020: 75+ yrs
- Comment: In 2020, all age groups spent less on Services. In 2021, only the high income 45>54 yr-olds spent less. The 55>64 yr-olds finished a close 2nd to 35>44 with a $0.75B (+56.3%) increase. Together, these 2 groups generated 69.2% of the $2.21B increase in Services Spending.
We’ve seen the winners and losers in terms of change in Services Spending $ for 12 Demographic Categories. The lift set a record and was widespread. Here’s some data which shows the evolution from 2018 to 2021 as Services worked their way back up and even exceeded their last peak in 2018. You see the difference between the big down & up swings.
Total Spending: 2018: $8.72B 2019: $8.62B 2020: $6.89B 2021: $9.10B
% Segments w/↑$: 2018: 88% 2019: 49% 2020: 21% 2021: 90%
Avg Biggest ↑$: 2018: $1.04B 2019: $0.25B 2020: $0.05B 2021: $1.10B
Avg Biggest ↓$: 2018:-$0.02B 2019: -$0.27B 2020: -$0.89B 2021: $0.07B
We found the winners in performance and $, but there were others who performed well but didn’t win. They deserve….
Honorable Mention

A big change from the 2020 chart. This year the worst performer was +42.9%. Last year’s worst was +0.9%. 5 People CUs had the 2nd biggest increase but they more than doubled their Services Spending. Services $ usually follows income $ but the low income No Earner, 2+ CUs also doubled their spending. The West was the leader in the lift and performance, but the Northeast was a strong second in both, including a performance level of 111%. Married Couples led the way, but kids were a little less important. Unmarried, 2+ All Adult CUs had a bigger increase than all Married, w/kids CUs combined. No Food Binge for 55>64. They spent more in other Segments, including Services. Gen X won the awards, but Millennials also were strong. Their 2020>21 increase matched their previous biggest lift in 2017>18. In 2021, 90% of all segments increased Services spending. That means that we could have added many more to this honored group.
Summary
For years, Services’ spending slowly but steadily increased. However, the number of outlets offering Services was radically increasing. In 2017, this competitive pressure caused Pet Parents to shop for value and spending fell 1%. In 2018, the abundance of outlets and competitive prices finally had their intended impact. Many more consumers took advantage of the convenience of Pet Services and spending literally took off with a record increase to a new all-time spending high. In 2019 Consumers held their ground at the new higher level but we saw turmoil similar to 2017. Again, value shopping likely contributed to the small decrease.
In 2020 pandemic Services outlets were often deemed nonessential so they were subject to restrictions and closures. Services are definitely needed by some groups. However, for most demographics, Services are a convenience and spending is very discretionary in nature. The reduced availability and the pandemic driven focus on the “needed” segments – Food and Veterinary caused a 20% drop in Services $.
In 2021 the Retail Marketplace opened up again and many Pet Parents strongly returned to their previous Services mantra, “I need help with my Pet “children” and I have the money to pay for it!”. This behavior was widespread as 90% of all demographics spent more on Services. This produced a record $2.21B increase and Services spending exceeded $9B for the first time. While the lift was widespread, unfortunately, the spending disparity increased. Performance differences are a key measurement of disparity. Let’s consider the performance of the big groups. There were 7 categories with a 120+% performing big group, up 2 from 2020, the most of any segment – Food (5), Supplies & Veterinary (6). This clearly indicates more disparity in Services Spending.
- Income · Higher Education · CU Composition · # Earners · Race/Ethnic · Housing · Age
The Housing category returned to the 120+% Club and Age was added. Gen X and Boomers are still the top 2 spenders and the younger members of these groups drove the increase. Income remains the key factor in Services spending. The best performing segments and those with the biggest increase almost without exception rank 1st or 2nd in income.
Services were hit the hardest by the pandemic in 2020 but they had a record, widespread recovery in 2021. They are the segment most driven by high income so inflation has less of an impact. We’ll see if the record price increases in 2022 negatively affect Services Spending.
At Last – The “Ultimate” Pet Services Spending Consumer Unit consists of 4 people – a married couple with 2 kids. The oldest child is 6>17. They are 35>44 yrs-old and White, but not of Hispanic origin. They both work and at least one of them has an Advanced College Degree and is a Manager or Professional. They have an income of over $200K. They live in a small suburb of a metropolitan area of 2.5>5 MM in the Western U.S. and are still paying off their home mortgage.

