PET PRODUCT $ALES ACROSS U.S. RETAIL CHANNELS The Migration of “Pet Parents” – 1992 to 2017
Pets, Pet Food and Supplies sales have shown tremendous retail growth since 1992. According to the Economic Census, which is conducted every 5 years by the U.S. Census Bureau, retail sales totaled $51.32 Billion in 2017 – up from $8.2 Billion in 1992. The spectacular growth was fueled by Americans’ growing love and commitment to their pets. 67% of U.S. Households have a pet – twice as many as have a child under 18.
While the love was growing in our hearts, the sales of pet products were growing at retail. It was not a simple journey –straight to the top. It involved expansion to a variety of different outlets and consumer migration between channels driven by their search for value, convenience and selection.
In this report we will use detailed data from the Economic Census to update our ongoing analysis through 2017.
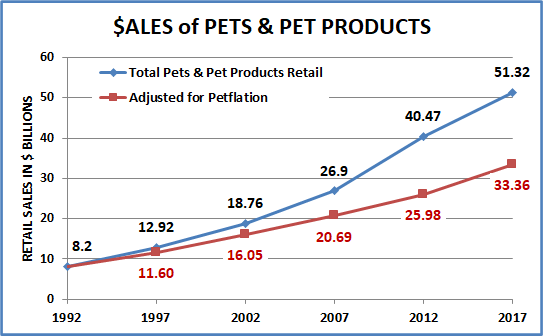
Here is a visual look at the growth since 1992. I have also included a line on the graph which is adjusted for “petflation” and gives us a better indication of the actual increase in the amount of product sold.
- 1992 > 2017: Up $43.12B (+525.9%); Avg Growth = 7.6%
- 1992 > 2012: Up $32.27B (+394.8%); Avg Growth = 8.3%
- 2012 > 2017: Up $10.85B (+26.8%); Avg Growth = 4.9%
Real Growth 1992 to 2017 (Adjusted for petflation – Pet Food & Supplies CPI)
- 1992 > 2017: Up $25.16B (+306.8%); Avg Growth = 5.8%
-
- 1992 > 2012: Up $17.78B (+216.8%); Avg Growth = 5.9%
- 2012 > 2017: Up $7.38B (+28.4%); Avg Growth = 5.1%
Note: Most of the growth (76.3%) in Pets, Pet Food and Supplies has been real growth. Pet Products Prices increased 53.8% in the 25 years from 1992 to 2017 compared to an increase of 74.6% in the Total U.S. CPI and a 138.6% increase in Pet Services Prices (Vet & Non-Vet combined) in just the 20 years from 1997 to 2017.
Pricing in Pet Products was an issue from 2007 to 2009 when prices jumped 17% in just two years, in the heart of the recession. Consumers started searching for value. This was a key point in Pet Products channel migration. On the flip side, from 2012 > 2017 Pet Products prices fell -1.25%. Although the growth rate during this period was down from the long term average, the increase in the amount of Pet Products purchased was actually greater than the $ increase.
We’ll stay with the total market and look at some key factors that have affected the overall growth since 1992.
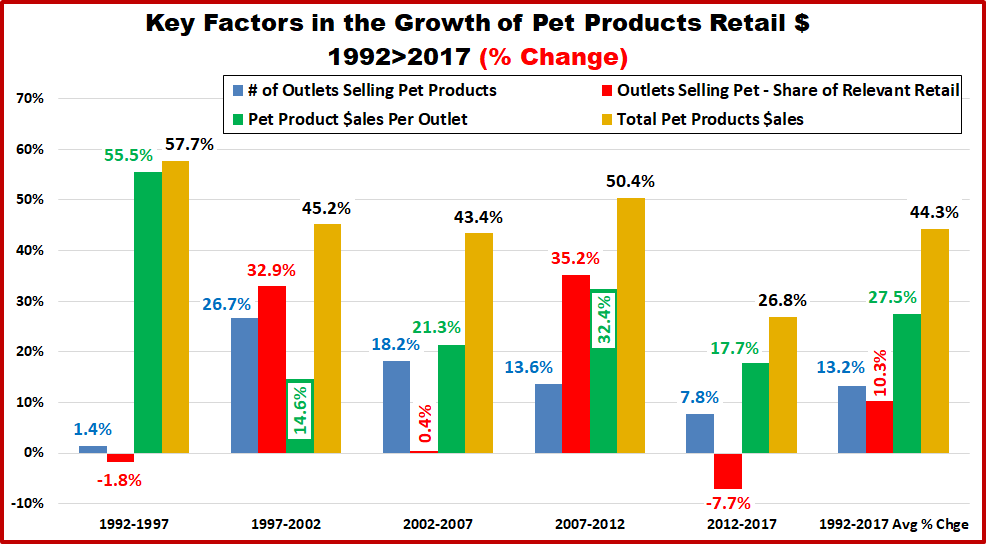
Here’s how each factor changed during each of the five year measurements since 1992.
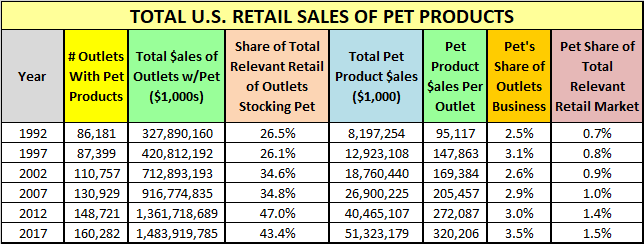
1992 to 1997 – No growth in outlets or in retailers’ share of overall market. The big growth was increased store volume due to increased consumer product demand – which was filled by expanded departments and bigger pet stores.
1997 to 2002– A 27% increase in number of outlets and a 15% increase in per store volume pushed sales up 45%. A huge increase in the representation of Pet in the overall market as it became available in stores doing over 35% of total retail.
2002 to 2007 – Store count continues to grow – up 18% and the per/store volume goes up even faster – +21%. Sales are up 43%. The overall Retail Market Share of outlets selling products remains stable at 35%.
2007 to 2012 – Another 18,000 stores (+14%) and a huge increase in per store volume (+32.4%). Consumers have started shopping intensely for value since the recession…and they found it as sales increased 50%. It was also easier to find products in a store, as outlets doing 47% of the total U.S. Retail market stocked pet supplies in 2012.
2012 to 2017 – Sales Growth slowed markedly to 26.8%. There were 12.600 more stores but +7.8% was much less than in the past. Pet Products stocking stores also loss share of the overall market but are still over 43%. It looks like this drop occurs regularly every 10 years. The $ lift was primarily due to a 17.7% increase in $ales per store – still relatively strong.
1992 to 2017 – Sales Now $51.3B; Up $43.1B (+525.9%)
- 160,282 “pet” outlets; Up 74,101 (+86.0%)
- Outlets stocking “pet” do 43.4% of U.S. Retail.
- Pet Products do 3.5% of an outlet’s total sales.
- Pet Products = 1.5% of Relevant Retail; 0.7% in 1992
Now, let’s see how the consumers decided to divide up their Pet Products $.
PET PRODUCTS SALES AND MARKET SHARE BY RETAIL CHANNEL
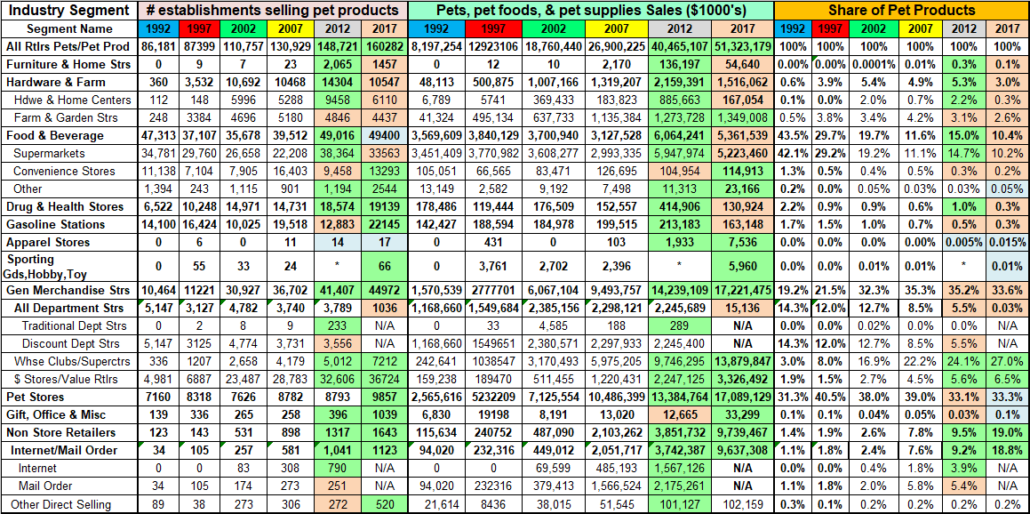
This chart shows the shows in detail the # of outlets, total pet product $ and market share of the retail channels and segments stocking pet products from 1992 to 2017. Use it as a reference point. Additional charts will follow.
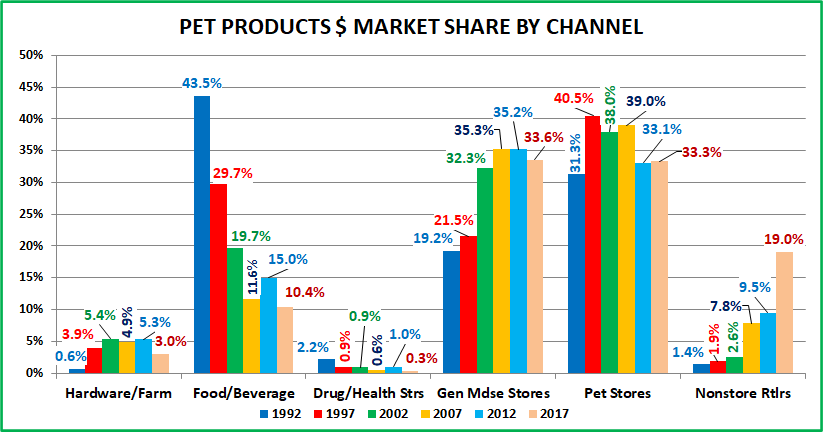
99.3% of Pet Products Sales are done by 5 major Retail Channels. Let’s look at their market share from 1992 to 2017.
Drug Stores were included for historical reference. In 1992, they had a bigger share than Nonstore and Hdwe/Farm combined. Now their $ and share are below Gas Stations. 5 Major channels account for 99.3% of Pet Products $.
Observations
Drug and Health Stores – They were once a small, but notable force in Pet Products sales. However, except for an uptick in 2012, their share of Pet Products $ has generally declined. Their Pet Products Sales are now basically impulse or convenience purchases, a pattern similar to that for Gas Stations and Convenience Stores.
Hardware and Farm – Early growth came from the Farm Store segment. Hardware jumped on board in 2002 and pushed the market share up to 5.4%, capturing 40% of this channel’s pet business. The overall share stayed fairly stable from 2002 to 2012 then plunged in 2017 due to huge drop in Hdwe/Home Centers Pet Products $. While Farm Stores $ have consistently grown since 1992, Hdwe/Home Ctrs have been on a true roller coaster ride since 2002.
Food and Beverage – Supermarkets account for 98% of the business in this channel. In 1992 Supermarkets were the #1 Pet channel, with 42.1% of the business. They increased their business 9.5% in 1997. Unfortunately, overall “Pet” sales took off – up 55%, so their market share fell 30%. Sales stagnated in 2002 and actually dropped in 2007. Needless to say, their market share continued to plummet – down 73% from the 1992 high. Where did the business go? – just about everywhere else, but primarily to General Merchandise Stores and Pet Stores. Then from 2007 to 2012 they executed a remarkable turnaround. The number of Supermarkets carrying pet products increased by over 70%. They more than doubled their pet sales and gained back 3.6 points in market share. However, 2012 to 2017 brought another turnaround – a negative one. The number of Supermarkets carrying Pet Products fell -12.5% and their Pet Products $ dropped -$725M (-12.2%). Their market share is at an all-time low of 10.2%, which is 76% below 1992. Some of the business may have been lost to SuperCtrs/Clubs or even Pet Stores, but most probably migrated to the Internet.
Nonstore Retailers – This channel includes both mail order and the internet. The increases in pet products $ have been truly astronomical. Sales in 2017 are 100 times what they were in 1992 and their Market share is up over 1500%. Since 2007 and especially since 2012 the growth has been fueled by the internet. In the years up to and including 2012 the internet/mail order share of Pet Products $ mirrored their share of Total Retail $. However, they have stepped up in Pet Products since then. Internet/Mail order now sells 18.8% of Pet Products $, compared to 16.1% of total relevant retail $.
Pet Stores – In 1992 Pet Stores were the second largest retail channel selling pet products. The category caught fire. Big Box Pet Super Stores were developed and built to offer the consumer the wider selection that they sought. In 1997, due to the growth of chains, Pet Stores moved into the #1 position with a 40.5% share of the business. The proliferation of Super Stores resulted in the closing of a number of smaller Independents, so the number of stores and market share dipped slightly to 38.0% in 2002. They were still #1 but now they were being strongly pursued by General Merchandise Stores – not Supermarkets. More Super Stores, along with a continued high consumer demand, brought their market share back up to 39.0% in 2007. They had maintained the #1 status with a market share of 38 – 40% for over 10 years. Then…the recession happened, and consumers became focused on value. Their store count was the same and sales grew but their market share fell 5.9 points (-15.1%). On the surface, it appears that the bulk of the business went to Grocery and Internet/Mail-order but almost every major channel and a few minor players got a piece of their lost share. Things certainly changed in the period from 2012 to 2017 as the world, including retail began to move increasingly online. Pet Stores not only held their ground, but they also actually had a slight gain in share. They capitalized on Pet Parents desire for personal interaction in pet products purchases along with their desire for the convenience of one stop shopping. More Pet Stores began offering grooming services and some even added Veterinary services. They will never beat Internet product prices, but you can’t get your dog groomed online!
Minor Players – Although their combined market share is under 1%, the widespread appeal of Pets has brought in retailers from a variety of other “Specialty” channels – Home Goods (Furniture), Value Clothing Stores, Sporting Goods, Gift…to name a few. Although their selection is generally limited, they do broaden the consumer availability of certain pet product categories in the overall U.S. Retail Market. The success or failure of their venture into the Pet Products world is usually dependent upon the overall success of the individual retailer. If they are attracting consumers and their business is growing, then they may have some success with Pet. After all it appeals to 67% of U.S. households.
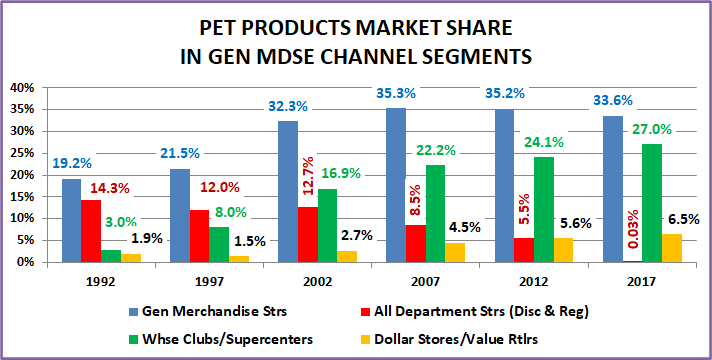
General Merchandise Stores – Currently they are hanging on as the #1 major channel in Pet Products sales. This group enjoyed strong to spectacular growth from 1992 to 2007. The number of outlets grew from 10K to 37K (+250%); sales grew $8B to $9.5B (+533%); market share grew from 19.1% to 35.3% (+83.9%). From 2007 to 2012, the number of outlets continued to grow, and sales increased to $14.2B (+49.5%) but their market share actually fell 0.1%…Yet, they still took over the #1 position in Pet…by just matching the overall market increase. From 2012 to 2017, their number of outlets and sales grew but couldn’t keep up with the internet, so their share fell. There were also some changes within the segments in terms of product mix and classification. This is a large and complex channel and deserves a closer look.
All Department Stores – Stores have been classified as either Traditional Department Stores, like Macy’s or J.C. Penney or Discount Department Stores, like Wal-Mart or Target. For the Economic Census that has changed.
Traditional Department Stores Although they do 8% of this channel’s overall business, they are basically a nonentity in Pet Products. These stores have consistently loss market share as they have done little to meet the consumer’s changing “needs” – including failing to recognize and embrace the Pet Phenomenon in the U.S.
Discount Department Stores – This segment is the one that started the decline in traditional Department Stores. In terms of Pet Market Share, these stores were at their peak in 1992. The commitment to SuperCenters and the rise of Club Stores started their decline. Sales continued to increase until 2002 and there was even a little uptick in market share between 2002 and 2007. From 2007 to 2012 sales flattened out and the number of outlets fell. In 2012 they were surpassed by the Dollar/Value stores in Pet Products’ market share. Between 2012 and 2017 the corporate owners decided to revise the product mix in many of these outlets. The continued growth in sales by Super Centers convinced them to add increasing quantities of fresh groceries to the product mix. Although the fresh offering is not as extensive as Super Centers it became significant. For the Economic Census, it was decided to eliminate the Discount Department Store Classification. Most of the existing outlets were classified as Super Centers. Those with an insignificant fresh grocery segment were lumped in with All Department Stores which included the traditional stores. The result was that Pet Product sales in the all department stores segment now mirrored that of the traditional stores – essentially zero.
SuperCenters & Warehouse Club Stores – This segment has been a retail winner since it came into play in the 90’s. It has shown consistent, even spectacular growth and in every measuring period its % increase in Pet Products $ has surpassed even the impressive growth rate of the overall Pet Products market. In 2007 they moved up in rank to #2, behind only Pet Stores in sales. Their pet products sales and share growth slowed from 2012>2017 and much of the growth from 2012 to 2017 must be attributed to the reclassification of many Discount Department stores. In fact, in 2012 the combined Pet Products $ share of SuperCtr/Clubs and Discount Dept Stores was 29.6%. In 2017, the share of all stores classified as SuperCtr/Club outlets was 27.0%. Like almost everyone else, this group lost $ to the internet.
$ Stores/Value Retailers – This channel was originally occupied by 5&10¢ Stores. They faded and were replaced by these Value Retailers. Since 1997, the store count and Pet Product sales have gone up dramatically. Their appeal and their share of the total market has grown markedly since the recession. In terms of number of outlets selling Pet Products, in 2017 they passed Supermarkets to take over the top spot. Their sales and market share also grew so they now rank #5 in Pet Products sales. Unlike most channels, they gained ground, in the internet wave.
Speaking of the internet wave, let’s take a closer look at the specifics for 2012>2017. First, the major channels Here’s the 2017 market share by Channel: (Arrows show if they are up ↑, down ↓and by how much in share from 2012)
- GM Strs: 33.6% ↓1.6
- Pet Stores: 33.3% ↑0.2
- Nonstore Retailers: 19.0% ↑9.5
- Food & Bev (Groc): 10.4% ↓4.6
- Hdwe & Farm: 3.0% ↓2.3
- All Other: 0.7% ↓1.2
Only Pet Stores held their ground and even gained a little in the Internet tsunami.
Now let’s look at the individual segments in terms of 2017: (Same rules as above)
- Pet Stores: 33.3% ↑0.2
- SuperCtrs/Club: 27.0% ↑2.9
- Internet/MailOrder: 18.8% ↑9.6
- Supermarkets: 10.2% ↓4.5
- $ Value Strs: 6.5% ↑0.9
- Farm Stores: 2.6% ↓0.5
- Gas/Convenience: 0.5% ↓0.3
- Hardware: 0.3% ↓1.9
- Drug Stores: 0.3% ↓0.7
- Other Nonstore: 0.2% ↔0.0
- Furniture/Home: 0.1% ↓0.2
- All Dept Strs: 0.03% ↓5.47
The story is a bit more complex, and the specifics can be a little bit misleading. The gain by SuperCtrs/Clubs was largely due to the assimilation of many Discount Department Stores into this channel. The combined share of these two channels was 27.0% in 2017. That’s down -2.6% from 29.6% in 2012. There was also another winner – $ Value Stores. Consumers love the value and convenience of these outlets and they continue a rapid expansion in numbers.
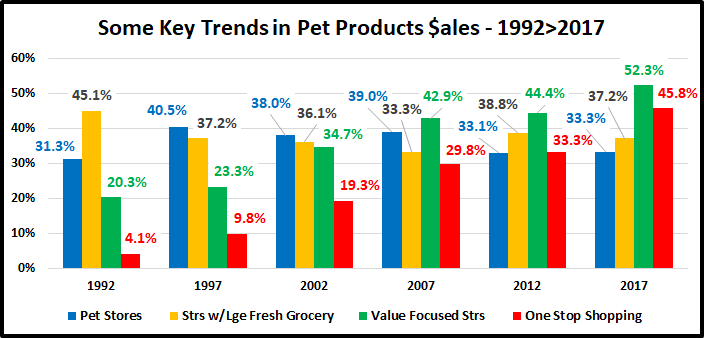
The move to the internet is definitely a trend. Let’s look at some major trends that have impacted and continue to affect Pet Product Sales over the 25 years from 1992 to 2017.
There are 3 driving forces in consumer spending behavior:
- Value (quality + price) – Looking for a deal.
- Convenience – Make shopping easy.
- Selection – They want choices.
With that in mind, let’s look at the trends indicated by our analysis:
- The biggest trend is Value. It has shown consistent growth in importance and has been the single biggest factor since 2007. The channels that focus on Value are SuperCtr/Clubs, $ Stores and Internet/Mail order. They are definitely winning.
- One Stop Shopping is all about convenience. This is the second biggest driver and explains the ongoing success of SuperCtr/Clubs and the Internet. Supermarkets began this trend in the late 1970s by radically expanding their Gen Mdse sections in an effort to fulfill this consumer need.
- Groceries in the store. In 1992 consumers bought most pet products where they shopped for groceries – Supermarkets. In 1997 Supermarkets lost the top spot to Pet Stores. The GM Channel was also growing at this time and SuperCtr/Clubs also offered full grocery sections. Since 2012, consumers have come full circle and once again buy most Pet Products where they shop for groceries.
- The rise of Pet Super Stores and chains took off in the 90s. Their huge selection of Pet Products had a great appeal to the new generation of Pet Owners – Now Pet Parents. Pet Stores became the single biggest channel for Pet Products sales in 1997. Their success caused other channels to expand their Pet Sections. Pet Stores lost some ground in 2012 but they held onto the top spot and even gained share in 2017 by offering more Pet Services in store. They appealed to the consumer with 1 stop pet shopping.
- Internet – Their success should be no surprise. The game plan for online retailers exactly fits the consumers “wish list”. Great Prices! Shop without leaving home. Plus, a nearly unlimited selection
Summary
The underlying cause behind migration is evolution. In the migration of Pet Products there are two key evolutions taking place. The first is the evolution of Pet Owners to Pet Parents. Pet Parents are much more concerned about fulfilling the wants and needs of their Pet Children. This transformation took hold in the 90’s and accelerated during the early 2000’s when Pet Parents increasingly personified their pets. They began reading labels, became increasingly concerned about nutrition and now generally transfer human needs to their pet children. This movement continues to grow stronger.
The other evolution occurred in the retail marketplace and with all consumers. Consumers became less brand driven in their purchasing behavior and more concerned about value, convenience and selection. The great recession further cemented Value at the top. Online shopping was growing far before the pandemic moved it to the retail forefront.
We see the migratory results of the ongoing evolutions in our analysis. In the 90s Pet Super Stores grew rapidly because they offered an unparalleled, broad selection of products to the ever increasing number of Pet Parents who were ready, willing and able to buy. Their success caught the attention of other retailers who expanded their Pet Products offerings. SuperCenters and Clubs were also growing strong at this time because these huge stores offered great Value and 1 stop shopping for groceries and a wide selection of GM categories, including Pet.
Everyone wants value but sometimes you don’t want to fight the crowds – $/Value Stores are the answer. Great everyday prices plus brand name “close outs” in a small footprint store that is easy to navigate. Plus, they carry Pet Products. They continue to add stores and currently have more outlets stocking pet items than any other channel.
That brings us to the Internet, our most recent and largest migration, +9.6% gain in share. Want a bigger selection…. Go online. No one can build a store big enough to stock the selection of products available online…and with no brick and mortar overhead…you can get great value. Plus, you can shop for the best price and get what you want without ever leaving your easy chair…talk about convenient.
At this point, Pet Products have grown in importance and spread across the U.S. retail landscape. Consumer $ales are $51.3B, +525% from 1992. They are available in 160K outlets, up from 86K in 1992. They also account for 1.5% of Total Relevant Retail $, compared to 0.7% in 1992. The migration will continue. Brick ‘n Mortar Businesses need to adapt in the current internet surge. They must have an online presence and offer delivery and same day pickup in store/curbside if possible. Pet Stores have a unique advantage as they can offer pet services and personal interaction with Pet Parents and their pets – which can’t happen online. We’ll see how everyone adapts and what changes the next chapter brings.

