INFLATION CAUSES SLOWED RETAIL GROWTH
Inflation affects spending. It is cumulative so even when the YOY rate slows, it can cause a range of issues – selling less product and even a drop in revenue. One impact that is often ignored is slowed $ growth. That is the focus of this report.
Before we get started on our main topic, let’s put the current situation into perspective. The post pandemic inflation surge affected the entire U.S. economy, but different channels took different paths. Here are some of note:
The National CPI – Inflation started in the Spring of 2021. The YOY rate peaked at 9.1% in June 22. Inflation has slowed since then but there has been no deflation, so prices are at their peak right now
Groceries – This expenditure has gotten the most publicity since it affects everyone. There have been 2 inflation waves. The first was minor. It began in the Spring of 2020 and slowed significantly in 12 months. The big surge began in the Fall of 2021. It peaked at 13.5% in August 22. Things returned to more normal rates by the Summer of 2023. There has also been no deflation, so prices are currently at their highest point.
Auto – Inflation in the Auto Big Group began slowly in the Fall of 2020 then took off in the Spring of 2021. It peaked at 23.9% in February 22, then began to slow but prices hit their high point in August. Deflation began in December 22 and was consistent until turning up Jan>Mar 25.
Gas Stations – Motor Fuel inflation began in Mar 21 and peaked at 60.2% in June 22 (along with prices). Prices began deflating in December 22 and have been on a rollercoaster since then. The biggest deflation was -26.7% in June 23.
Restaurants – Inflation began in the Fall of 2021 and peaked at 8.3% in March 23. Rates were back to normal by the Spring of 2024. There has been no deflation, so current prices are the highest in history.
Relevant Retail – Inflation began in the Fall of 2021 and peaked at 9.1% in August 22. Normal rates returned in the Summer of 2023. Prices peaked in October 23 until a recent lift pushed them to a new record high in March 25.
Total Retail (All Commodities) – The inflation surge began in the Spring of 2021 and peaked at 14.2% in March 22. Rates were back to normal by the Spring of 2023. Due to deflation, prices peaked in August 23.
All Services – Services are 60+% of all expenditures. Inflation began in the Spring of 2021 and peaked at 7.6% in January 23. Rates are still above normal and with no deflation, the current prices are the highest ever.
Now we will turn to slowed sales growth. All charts have the same format & channels as our monthly Retail report but different data. All have 6 data bars for each channel:
- 23>24 Y/E % Change
- Avg 92>23 Y/E Change
- 23>24 Y/E Chg vs Avg
- Ytd 24>25 % Change
- Avg 92>24 Ytd Change
- Ytd 24>25 Chg vs Avg
The 1st Chart Shows the Big Groups as of February 2025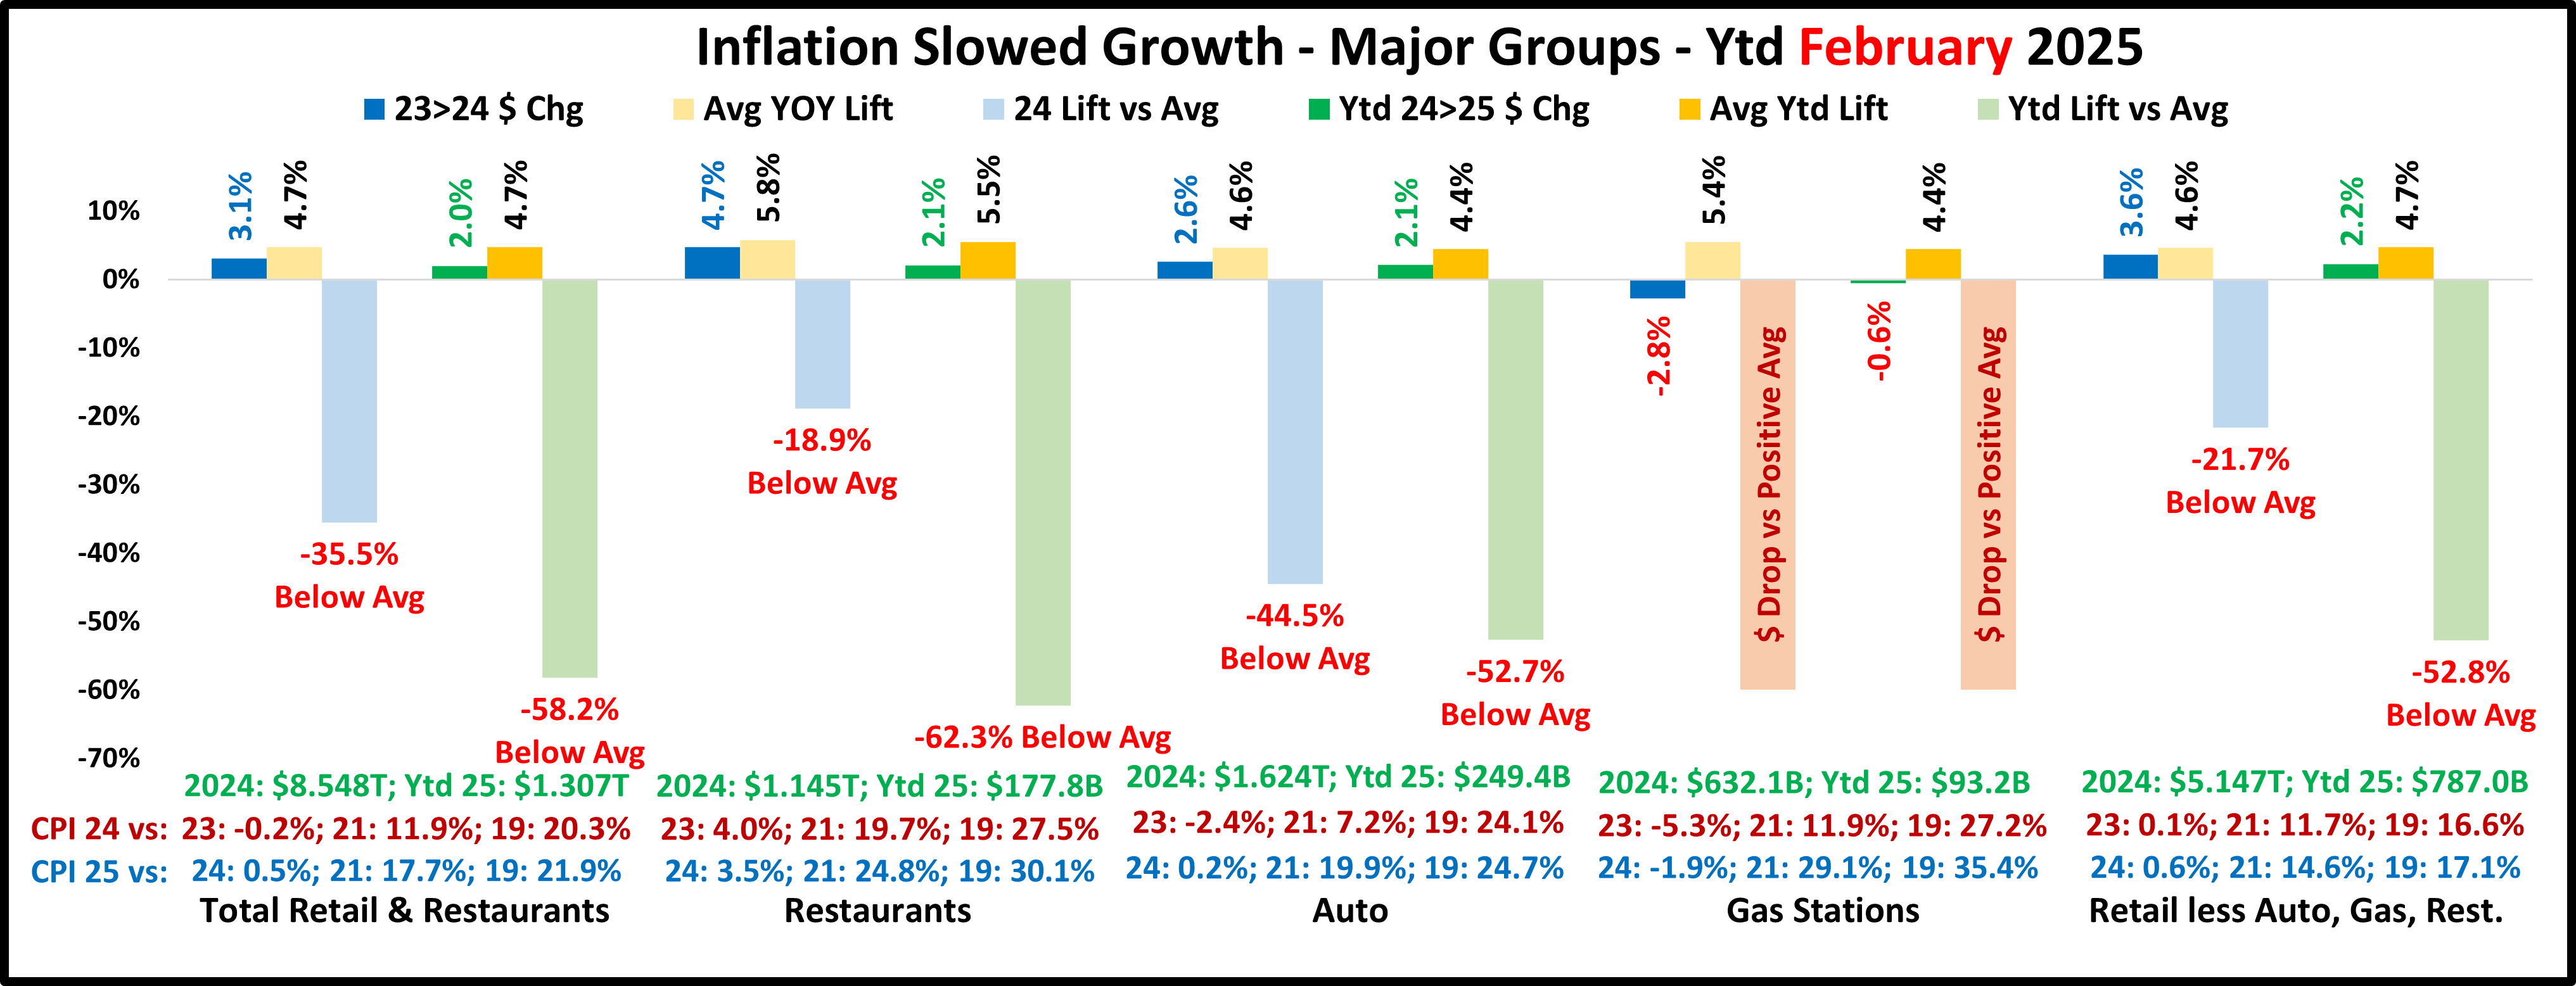
February was not a good retail month but all big groups, but Gas Stations had Ytd lifts vs 2024. However, all 4 increases were -52+% less than their 1992>2024 average lift for Feb Ytd. The situation also was worse for all compared to Y/E 2024, but we must note that the drop for Gas was 79% less than in 23>24. You can see that all have high cumulative CPIs vs 21 & 19.
Now, Let’s look at some Pet Relevant Channels (82% of Ytd Relevant Retail $)
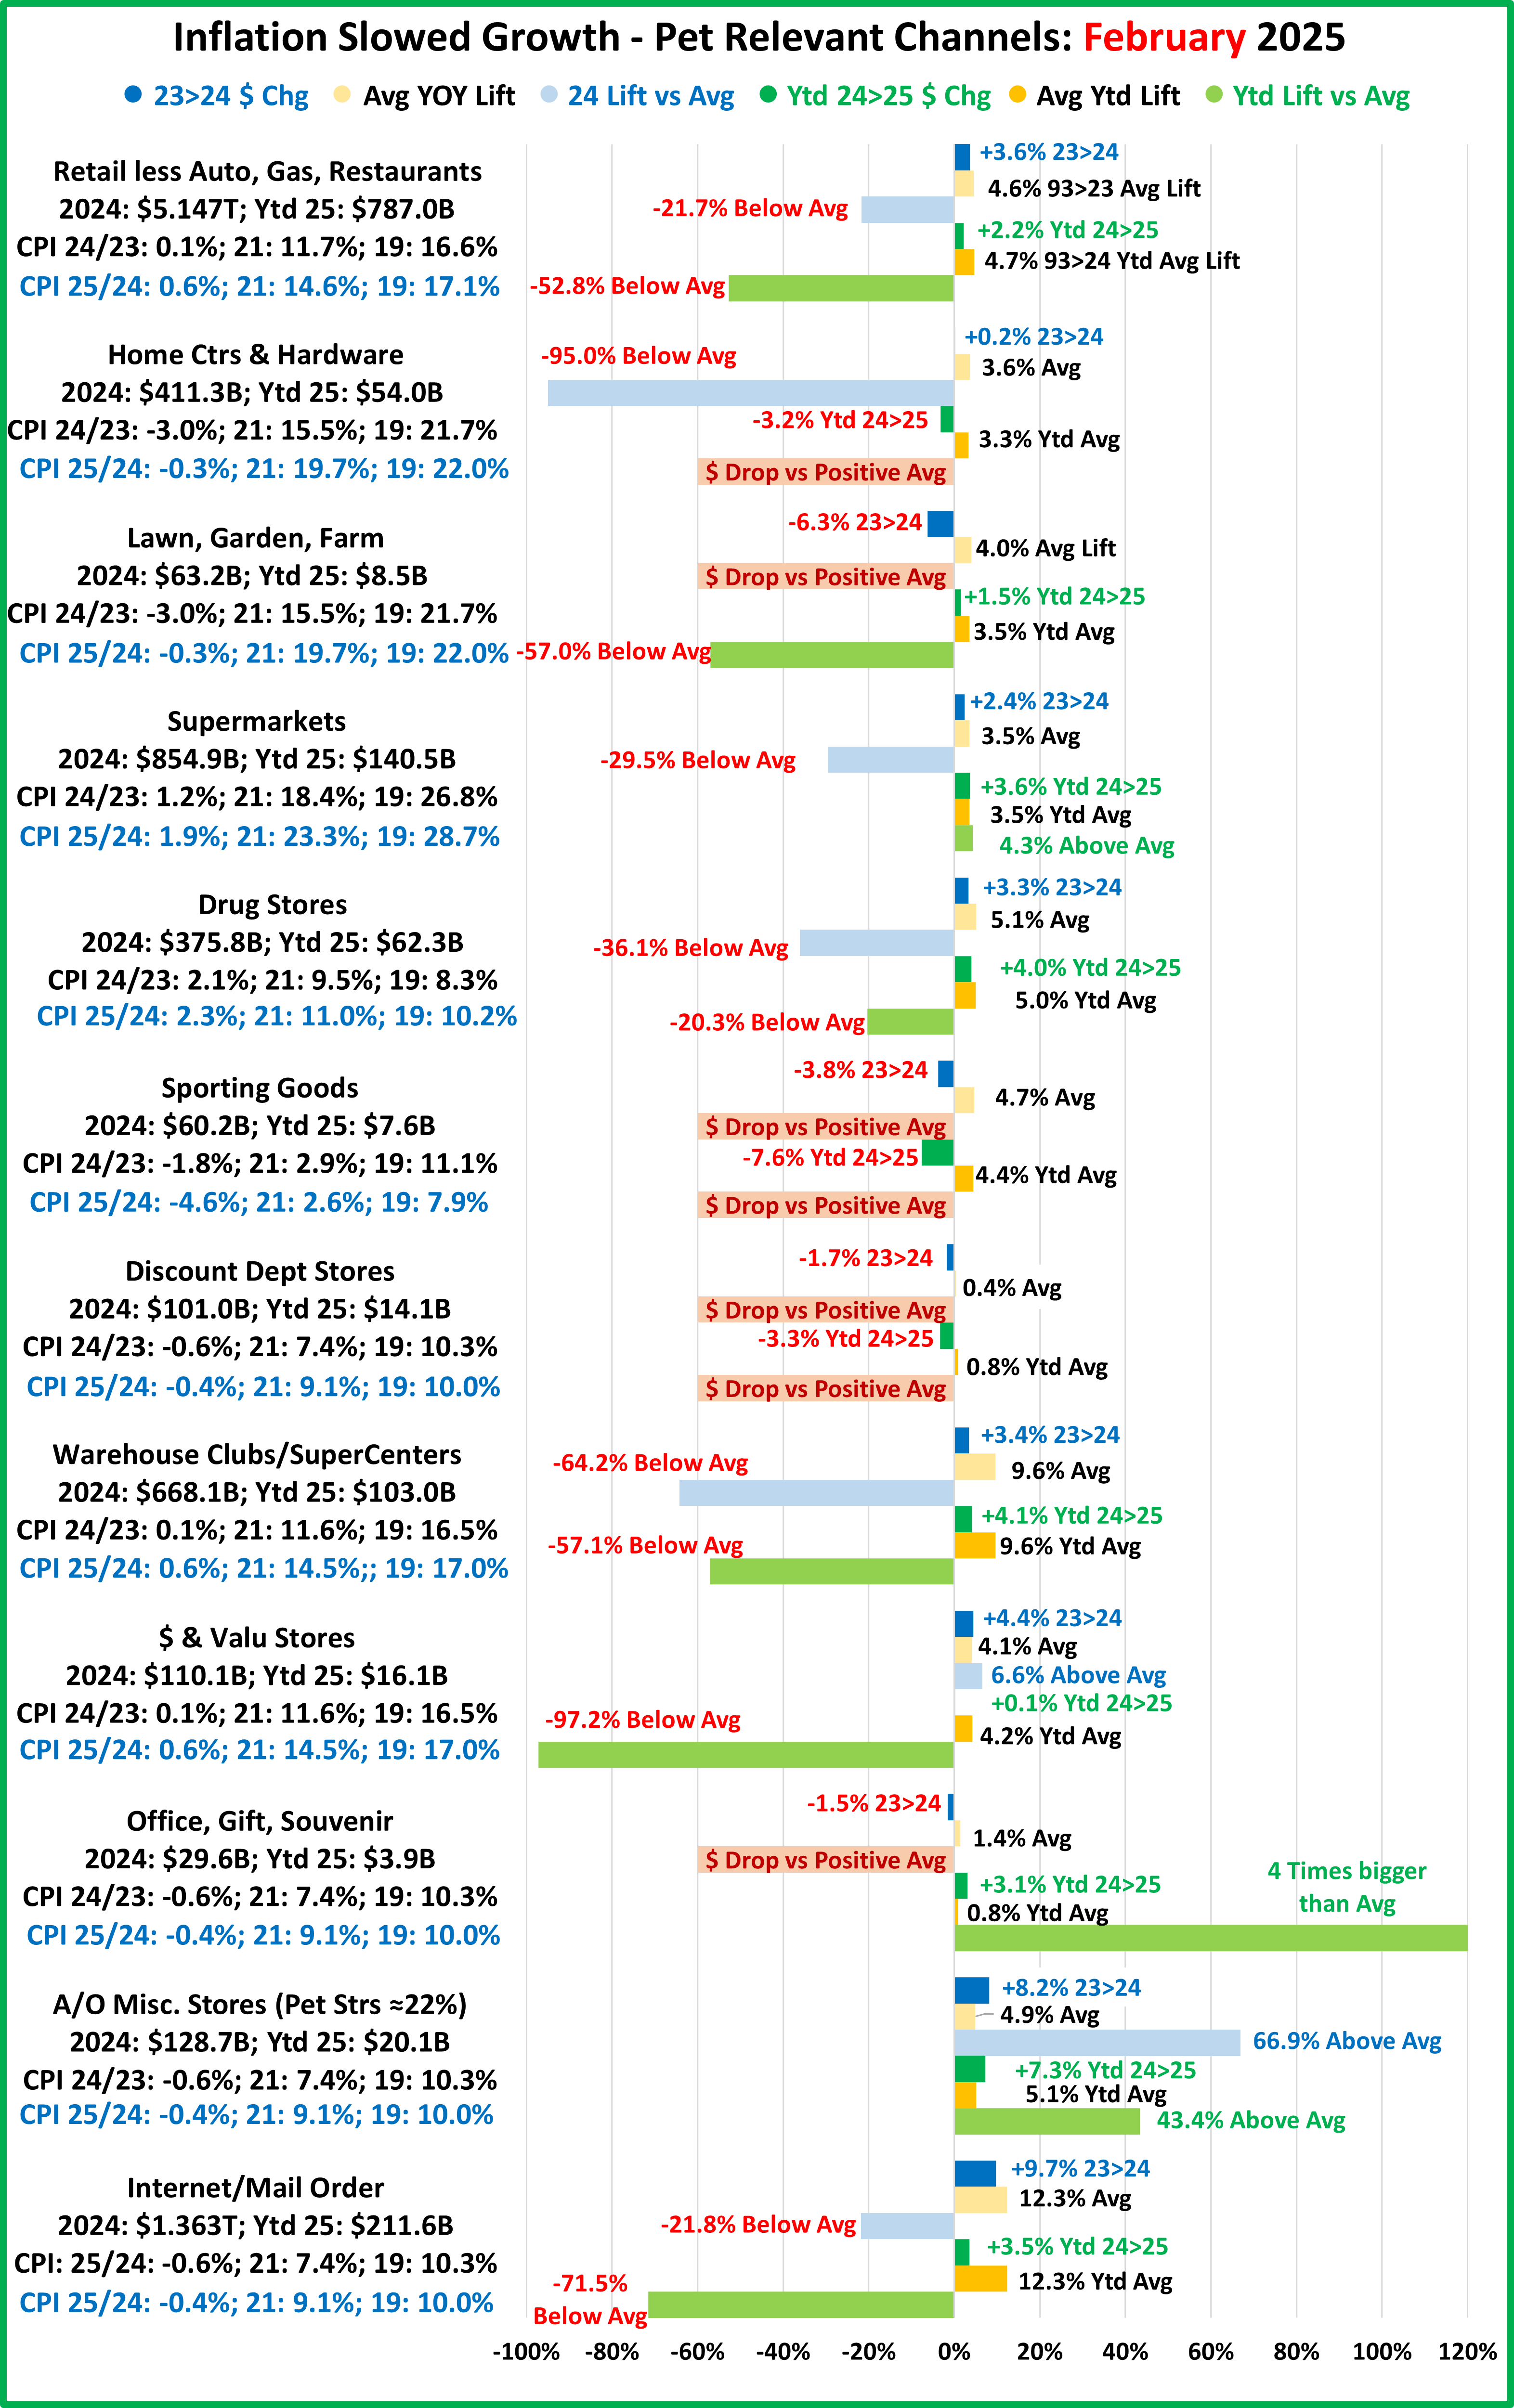
- 23>24: 4 of 11 had $ drops; 5 of 7 had lifts below avg – ranging from -22% to -95%; 2 Above avg lifts.
- Ytd 24>25: 3 of 11 had $ drops; 5 of 8 had lifts below avg – ranging from -20% to -97%; 3 Above avg lifts.
- Bldg Matl/Farm – Prices continue to deflate vs last year, but cumulative inflation in this channel is the 2nd highest. Home Ctr/Hdwe had a miniscule lift in 2024, but sales dropped in 2025. Farm Stores had the exact opposite pattern. Both lifts are -50+% below avg.
- Supermarkets – After slowing in 23>24, inflation turned up in 2025. They have the highest cumulative rate. $ales were up in 24 & Ytd 25. The 24 lift was below avg but the growth in 25 is 4.3% above avg (1 of 3 channels). This lift is only 0.1% more than avg and is above avg due to increased inflation.
- Drug Stores – YOY inflation has been consistent but relatively low. Now, it’s the highest in this group of channels. They had $ lifts in 24 & 25 but both were -20+% below avg.
- Sporting Goods – Deflation began in 23 and is accelerating. $ peaked in 2021 and then slowly and consistently dropped. $ are down in 23>24 & 24>25 – 1 of 2 channels. The drops are likely not inflation related.
- Discount Dept Strs – Prices are deflating, and the cumulative rate is low. This channel has been fading so it is no surprise that they were down in both 24 and 25.
- Clubs/SupCtrs/$/Value Stores – YOY inflation is low but cumulative inflation is high because groceries are a substantial part of their business. Sales were up for both in 24 & 25. However, only the $ store lift in 24 was above avg. The lifts in 25 were below avg, -57% (SupCtrs) & -97% ($ Strs).
- Office/Gift/Souvenir Stores – Sales in this group of specialty stores have been slowing for years. A big part of the drop is due to the fact that consumers have increasingly moved to buying office supplies online. Sales fell in 2024 but the lift in 2025 was 4 times greater than their average. This is likely an anomaly and because this channel only accounts for 0.5% of Relevant Retail Sales, it will have little impact on the marketplace.
- A/O Miscellaneous – This small channel has the best performance. Although their lift in 2025 is less than 2024, both are 43+% above avg. Pet Stores are in this group and undoubtedly contributed to the strong performance.
- Internet/Mail Order – This is the biggest channel and the 12.3% avg lift is difficult to maintain. The 24 & 25 lifts are far below avg but the 25 lift is now -71%. Inflation since 2021 is one of the factors.
In the 23>24 sales change all big groups and 9 of 11 smaller channels had either a sales drop or a below avg lift. The situation slightly improved in 2025 as all big groups and 8 of 11 channels had a drop or below avg lift. Now, on to March…
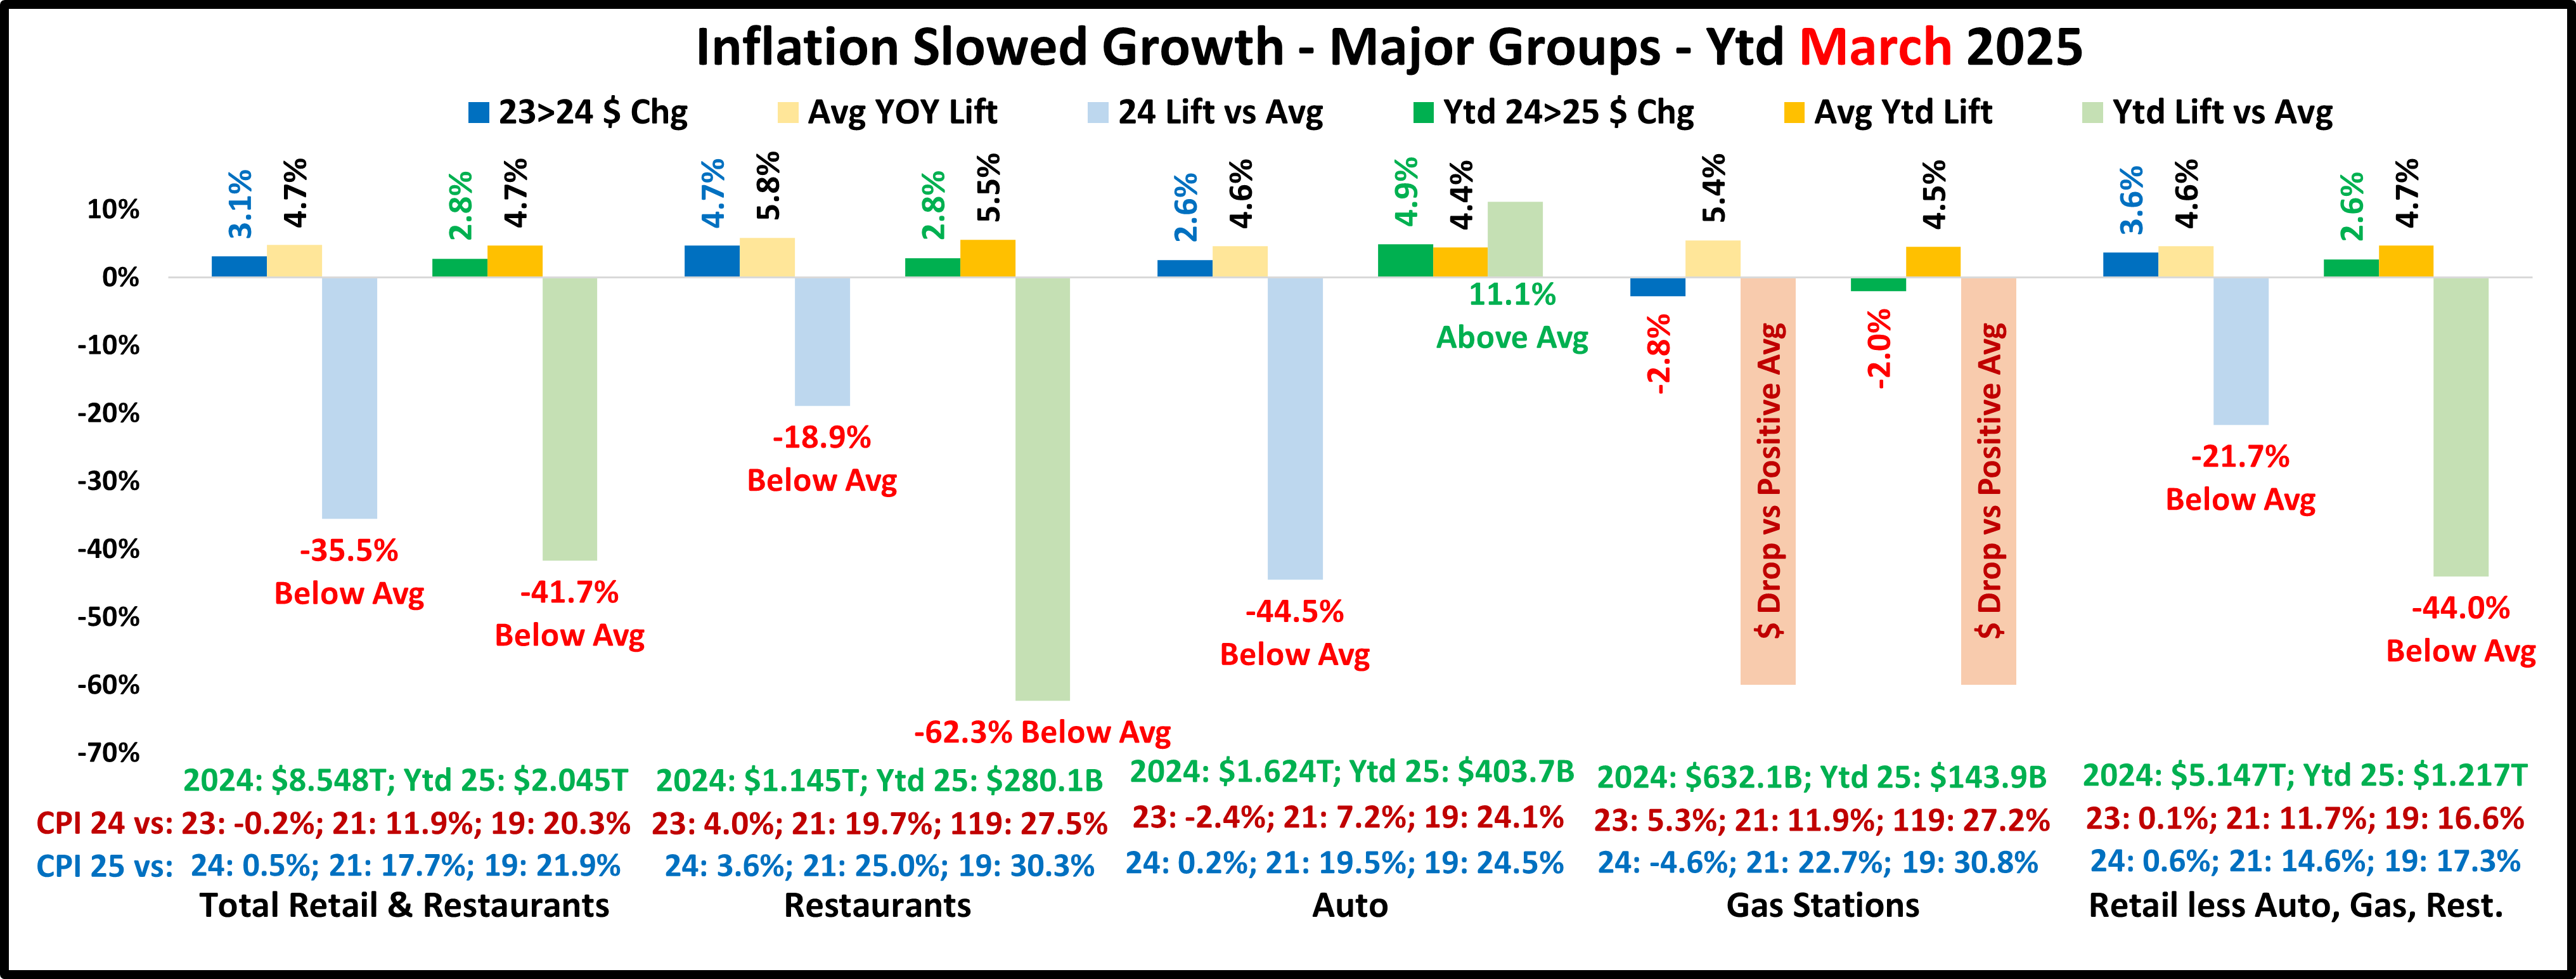
The biggest change is that now Ytd Auto is above avg. This is probably due to consumers buying to avoid impending tariffs. Gas Stations are still down – now triple the February drop. Ytd 25 is still twice as bad as 24 for Relevant Retail and 3 times worse for Restaurants. Total Retail is still bad in 25, but a little better than February because of the Auto lift. We should note that the Ytd lifts for Restaurants, Total & Relevant Retail are still further below avg than in 2024.
Now let’s look at the growth slowing situation for Key Retail Channels in March (98% of Ytd Relevant Retail $)
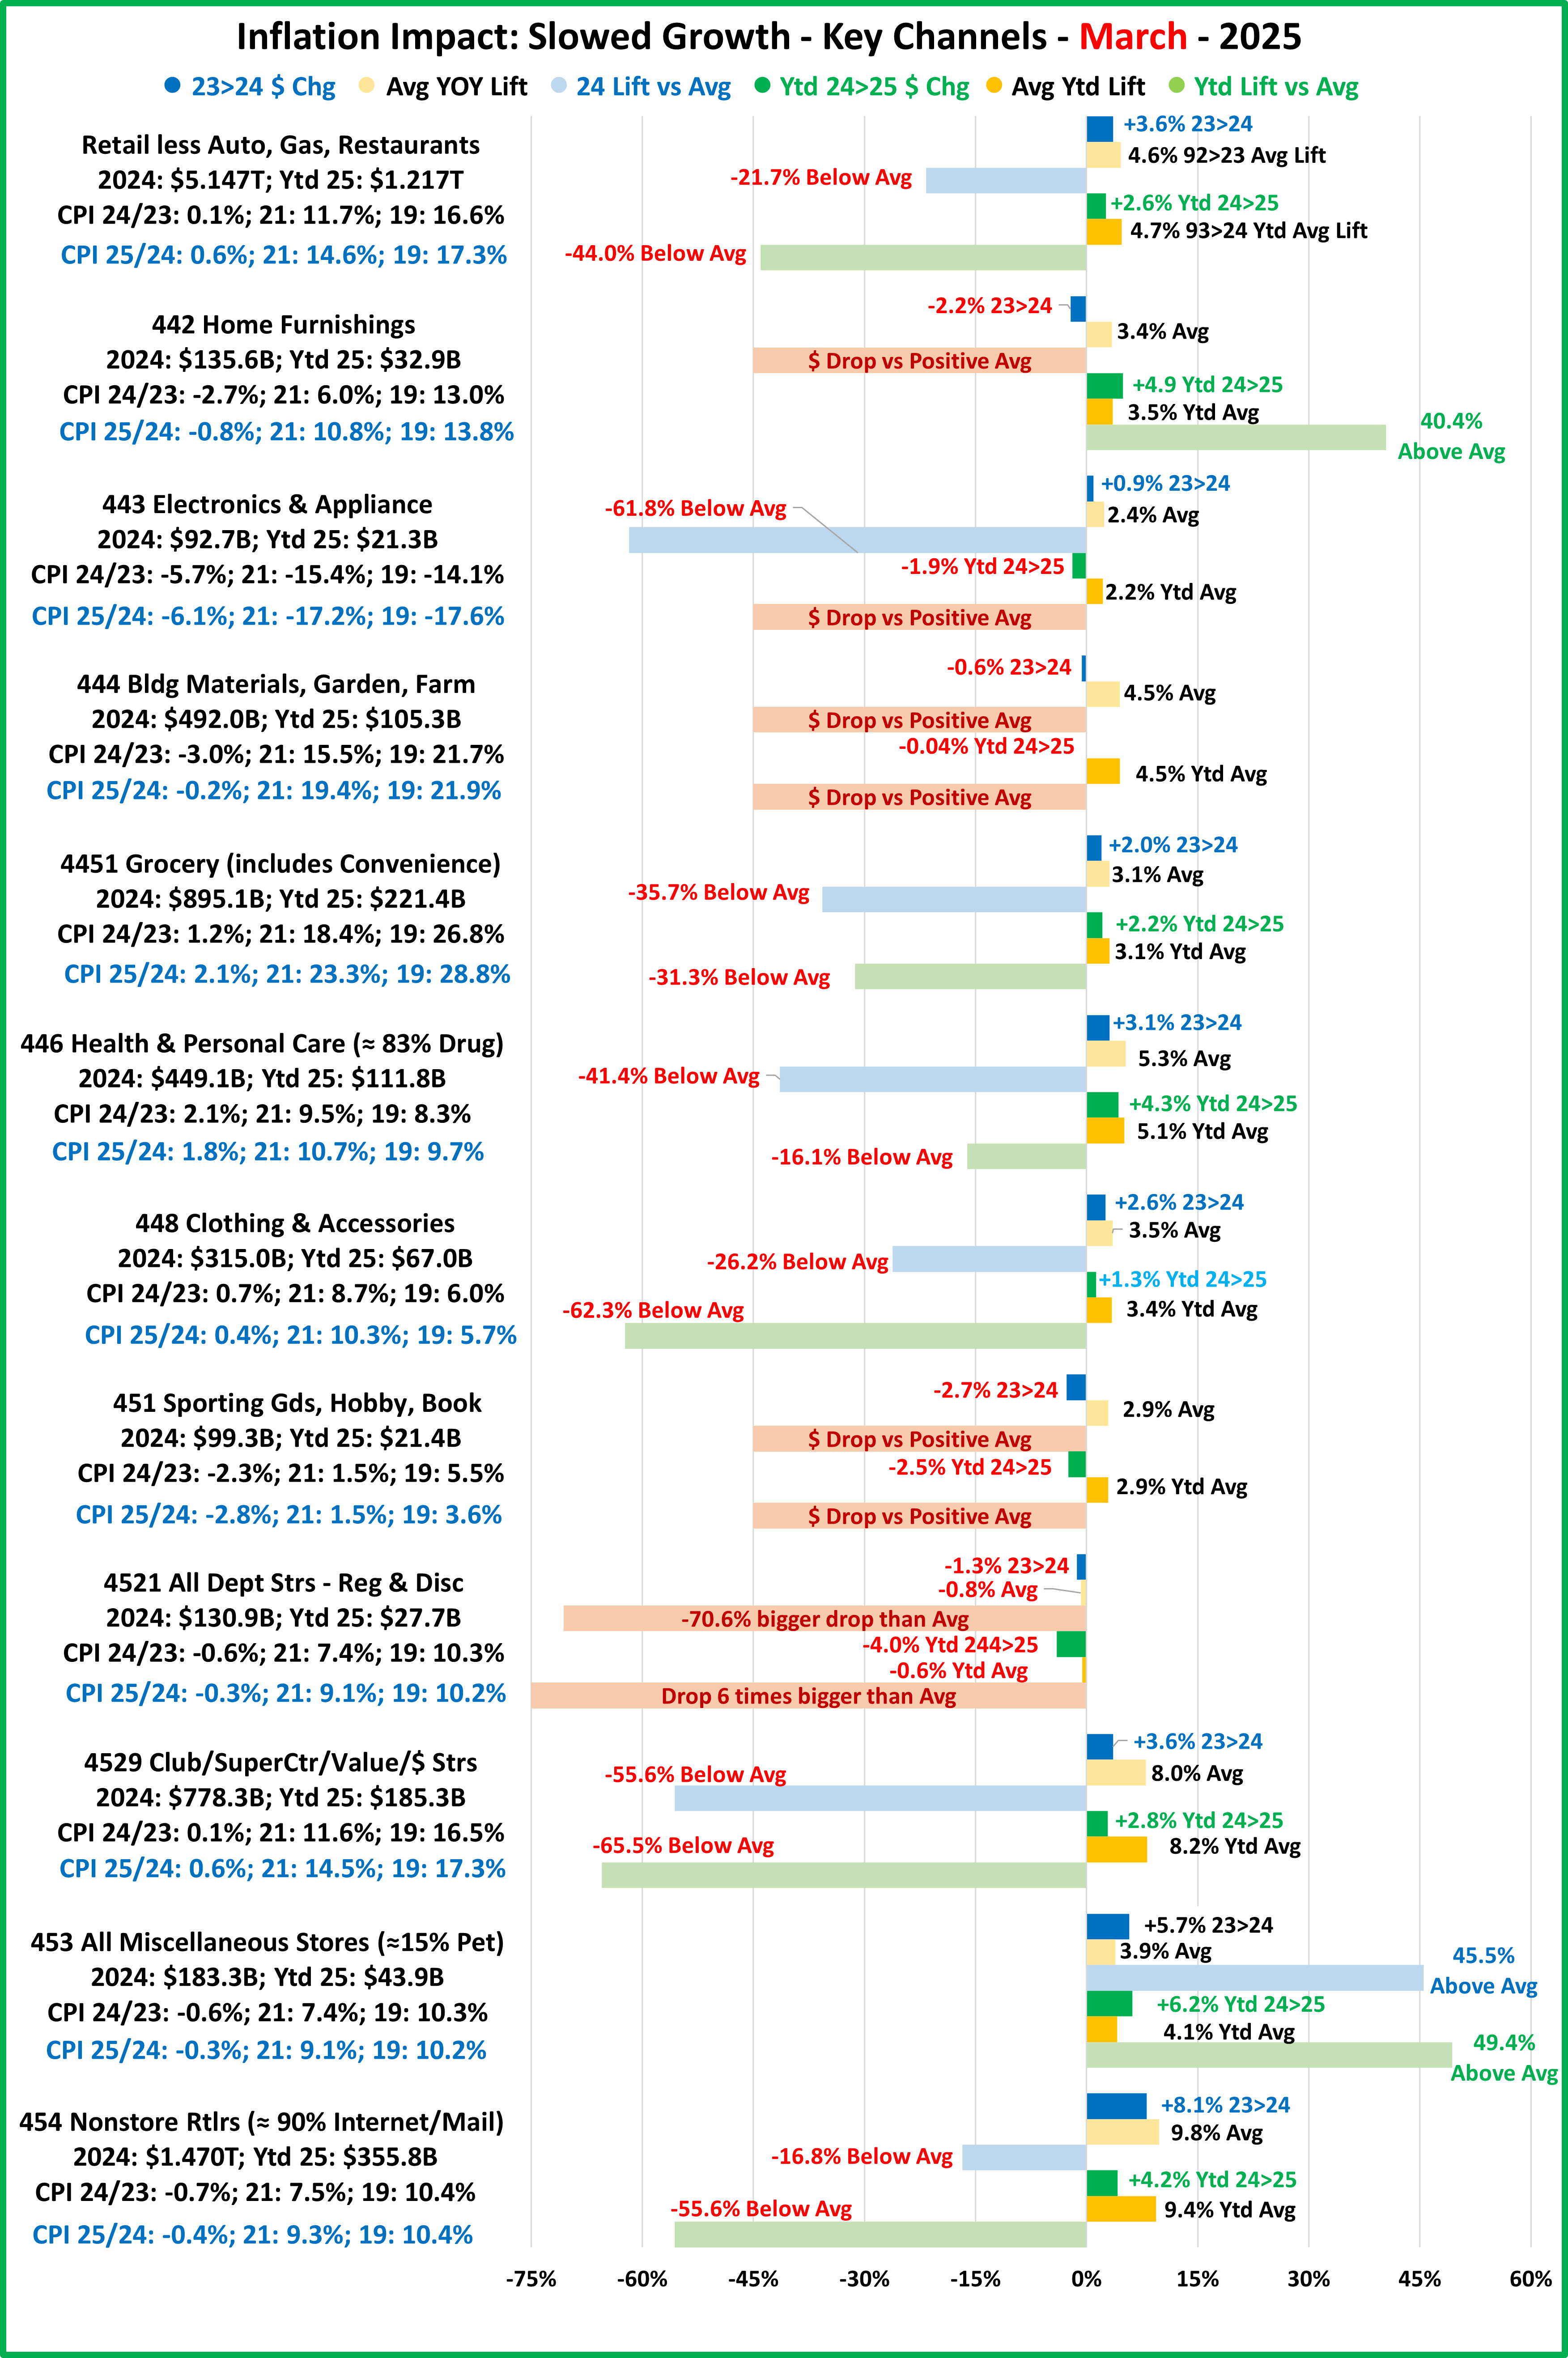
- 23>24 – 4 of 11 had drops; 6 of 7 had below avg lifts – range: -17% to -62%; 1 had an above avg lift.
- Ytd 24>25 – 4 of 11 had drops; 5 of 7 had below avg lifts – range: -16% to -67%; 2 had above avg lifts.
- Relevant Retail – 23>24: +3.6%, -21.7% vs avg; Ytd 24>25: +2.6%, -44.0% vs avg
- Home Furnishings – $ fell 23>24 but they had a strong Ytd 25 lift, +40.4% vs avg. Like the Auto sales lift, it is likely due to consumers buying to avoid impending tariffs.
- Electronics & Appliances – Deflation started in the Spring of 2022 and has been around -5>6% since then. They had a small lift in 24 that was -61.8% below avg but sales have fallen -1.9% Ytd in 2025.
- Building Materials/Farm – YOY deflation continues but prices are still high vs 2021 & 2019. Sales are down in 24 and Ytd 25. Things are a little better thanks to the start of their annual Spring lift but Ytd $ are -6.2% below 2022.
- Grocery – After slowing, inflation has turned up in 25. They have the highest rate vs 21 & 19. This is a very “needed” channel, so sales continue to grow in 24 and Ytd in 25. Both lifts are below avg but 24>25 (-31.3%) is a little better than 23>24 (-35.7%).
- Health & Personal Care – They are 1 of only 4 channels still inflating but the rate is down from 2024. $ were up in 24 and now Ytd 25 but both lifts were below avg. However, 25 (-16.1%) is significantly better than 24 (-41.4%).
- Clothing & Acc. – Prices are also inflating but their highest rate is vs 21, not 19. Sales are up in 2024 & Ytd 25. The lifts are small and both are below avg, especially 24>25 which is -62.3% lower than their avg March Ytd lift.
- Sporting Gds/Hobby/Book Stores – Prices are still deflating, and cumulative inflation is low. $ are down -2.5+% in 24 and Ytd 25. Their average lift for both is 2.9%. This group has other problems. Sporting Goods $ took off due to Covid, peaked in 21 and then slowly dropped. Book stores have faded as consumers moved online.
- Clubs/SupCtr/Value/$ Stores – Their current inflation is low but relatively high vs 21 & 19 because groceries are an important part of their product mix. Sales are up 23>24 and Ytd 24>25. The 24 lift is -55.6% below avg but the Ytd 25 lift is even worse, -65.5% below avg.
- All Miscellaneous Stores (≈15% Pet) – Prices are deflating, and inflation vs 2021 & 2019 is low. Their sales were +5.7% in 2024 and +6.2% Ytd in 2025. The 2024 lift was 45.5% above avg but the Ytd lift was even better, +49.4%. Unfortunately, this channel only produces 3.6% of Relevant Retail $ so their great performance has little impact.
- Nonstore – This is the biggest channel and its growth was largely fueled by the COVID induced Consumer movement to online shopping. They had an 8.1% increase in 2024, but it was still -16.8% below their annual average lift of 9.8%. Things have slowed significantly in 2025. Ytd sales are +4.2%, -52% below 2024 but -55.6% below avg. Their sales are +95% since 2019. If temporary factors cause your $ales to surge, keeping a high growth % is tough.
Before we summarize the results, let’s delve into the data. All numbers in the charts come or are derived from monthly retail sales reports from the Census Bureau – going back to January 1992. Businesses are required by law to submit timely and accurate data. Retail is defined as product providers so Service outlets are not included in their reports.
In my report, the Big Group charts represent 100% of Retail $ales. The February Channel chart is only Pet specific channels and represents 82% of Relevant Retail $ales. The March Channel chart covers the entire marketplace so it represents 98% of Relevant Retail $ales.
Now, let’s get to the subject – the impact of inflation on Retail Sales. High prices can cause less product being sold and even a drop in revenue. One of the less visible impacts is the slowing of growth. All of these can occur because of high prices. Since inflation is cumulative, they can still happen if inflation slows or even if prices deflate. We’ll focus on slowed growth. How do you measure it? The best way is to compare the current YOY lift to the long-term average. To get a broader view and evidence of change we compared the Y/E 23>24 and Ytd 24>25 lifts. In 2024, $ grew +3.6% for Relevant Retail, -21.7% below avg. In March 2025, their Ytd lift was +2.6%, -44.0% below avg. This is worse but the situation is complex. In the 11 channels:
- 23>24: 4 (16.7% of $) had drops; 7 (81.3% of $) had lifts, 6 (77.7% of $) were below avg and 1 (3.6% of $) was above avg
- 24>25: 4 (14.4% of $) had drops; 7 (83.7% of $) had lifts, 5 (77.3% of $) were below avg and 2 (6.3% $) were above avg.
They look very similar and the above/below avg lift situation in 25 looks better, not worse. However, the 5 below avg channels in 25 had essentiallly the same $ share as the 6 in 24 but their disparity vs avg was much worse. This produced the -44% below avg Ytd 25 lift for Relevant Retail. We should also note that the $ share of the above avg lifts is insignificant and 2 of the 3 total lifts are by 1 channel – Miscellaneous Stores. The other is from Furniture. Like Auto, the above avg lift for Furniture was due to a surge in buying to avoid impending tariffs. The slowing lift problem is widespread and not getting better. In March 2025, channels generating 91.7% of Relevant Retail sales had either a below avg Ytd increase or a drop in sales vs 2024. We should be very concerned as the impending tariff tsunami will only make the situation worse.

