PETFLATION – 2018 Update; Prices turn up↑
Pricing – specifically the Consumer Price Index (CPI) is an important reflection of what is happing in the retail market. Manufacturers and retailers set prices but ultimately it is up to the consumer to determine if they are acceptable or not.
Since price is the primary factor in 75% of all consumer buying decisions, it definitely matters. However, it has a different impact on different industry segments.
After a record low inflation rate of 0.4% in 2017, Total Pet returned to a more “normal” 1.3% in 2018. As always, every segment contributed proportionally to the industry total. Here are the specifics:
- Pet Food Prices were down slightly (-0.02%), virtually stable. This comes after the biggest drop ever in 2017 (-1.1%) and was the 5th annual decrease in the last 9 years.
- Veterinary Prices went up 2.6%. This was a small uptick from 2.2% in 2017, which was the lowest in history.
- Pet Services Prices increased 2.4%, more than double the 1.1% in 2017.
- Pet Supplies prices increased a full 1%. This is by far the largest increase since 2009. The previous leader was +0.07% in 2016. Prices are still -4.3% below the 2009 peak.
Before we get drill down into the numbers, let’s look at the pricing history for the industry. The US BLS began measuring the CPI for all Pet Industry segments in 1997. Here is the cumulative Petflation through 2018.
Average Annual Inflation Rate
-
-
-
-
-
-
-
-
- Veterinary Services: +4.6%
- Non-Veterinary Services: +3.1%
- Total Pet: +2.6%
- Food and Treats: +2.0%
- Pets and Supplies: +0.6%
-
-
-
-
-
-
-
The first thing that you note is that the pricing behavior of the 2 Services segments is far removed from the Product segments, especially Supplies. There are some key waypoints:
- 2010 – The Great Recession makes an impact on the industry. This is one year later than the overall market. Both Food and Supplies deflate. Services inflation hits a record low, but the Veterinary segment seems largely unaffected.
- 2007 – The Melamine recall. Food Prices begin to radically increase as consumers demand made in the USA.
- 2009 – Supplies prices reach their all-time high and begin a general decline.
- 2013 – Food prices peak. The move to upgrade to Super Premium and the resulting price war begins in late 2014.
- 2004>2005 – The likely start date for “humanization”. The movement to premium food begins and style becomes a factor in supplies, resulting in record inflation rates for this segment until the Great Recession hits.
The great recession was a traumatic event for consumer spending. In 2009 overall consumer spending fell for the first time since 1956. The impact on the Pet Industry was delayed until 2010 but it was significant. Pricing came to the forefront in 75% of all consumer buying decisions. Let’s take a closer look at the post-recession period.
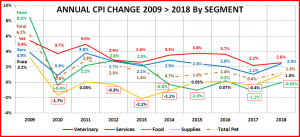
This chart details the annual change in CPI since 2009 for the Total Industry and every industry segment.
In this more focused graph, it is readily apparent that the Great Recession significantly affected every segment, including Veterinary. We also see that every segment immediately bounced back. The 2 Service segments returned to inflation rates that were at or near pre-recession levels. Prices also increased in both of the product segments, but not nearly to pre-recession rates.
An interesting convergence occurred in 2012>2013. In 2012 inflation for both service segments moved sharply down while food prices increased. They ended up with virtually the same rate. They moved slightly apart in 2013 but this “agreement” between such divergent segments just doesn’t happen. During the same time frame, Supplies prices deflated very strongly.
That brings us to 2014>2016. Veterinary inflation increased and stabilized at about 3.6%. The Services CPI rate moved sharply up, then began to fade gradually. Pet Supplies deflation slowed in 2014 then turned to 2 consecutive years of inflation under 0.1%. In 2014 the movement to upgrade to Super Premium food began. In the resulting retail battle prices deflated for 2 years. There was a minor uptick in 2016, but not for long.
That brings us to 2017, which was a very significant year for the Pet Industry. Once again, all the segments moved in the same direction in terms of pricing – ↓Down. The service segments did not deflate but their inflation rate slowed significantly. Veterinary inflation set a new record low of 2.2%. The Services segment didn’t set a record, but they were close. Their rate of 1.1% was second only to the 0.9% in 2010 which came as a result of the great recession. After 2 years of minor inflation, Supplies prices deflated -0.4%. Not to be outdone by the Veterinary Segment, Pet Food prices fell – 1.1%, a new record decrease. These combined to produce a record low inflation rate for Total Pet of 0.4%. Perhaps it was just a coincidence, but the US BLS Expenditure reported a $9.8B (14.6%) increase in pet spending for the year.
In 2018 we also had an almost unified movement in pricing but this time it was ↑up. The Food segment CPI did not increase. It was essentially flat with a decrease of only -0.02%. The Veterinary inflation moved up to 2.6% from the record low 2.2%. This was still significantly below their recent average of 3.6%. The rate for Pet Services more than doubled from 1.1% to 2.4%. However, the biggest change came from Supplies. Their CPI increased by 1%. This may not seem like much, but prices have been generally deflating since the recession. They haven’t had an increase this large since 2009, in the pre-recession world. The tariffs imposed in 2018 are undoubtedly a factor. When you put all the segments together, Total Pet had a 1.3% increase. This seems like a reasonable post-recession inflation rate. How will spending be affected? We’ll have to wait and see. The biggest risk is for a reduction in purchase frequency, which could cost billions of $. If frequency stays at or near previous levels, then increased prices = increased $.
In this last section we will break the most recent years down even further, into quarters. In this chart, we will look at 2016 to 2018 and compare the CPI of each quarter to the same period in the previous year. The annual numbers tend to give the impression of a smooth flow. There is often considerable fluctuation.
We will follow the pricing journey over the most recent years by industry segment. First up is…
- Veterinary – The annual rates show a significant slowing of inflation in 2017 but it regained about 1/3 of the lost ground in 2018. It turns out that the decline actually began in the second quarter of 2016, reaching the low point in the second quarter of 2017. The rate then turned up slightly but remained very stable for 15 months and finished with a significant lift in the final quarter of 2018.
- Pet Services – Like Veterinary, the annual inflation rate in this segment fell in 2017 and bounced back in 2018. However, the changes were much more extreme with a 45% drop and a 120% rebound. The timing of the decline also began in the second quarter of 2016 and bottomed out in the second quarter of 2017. This low inflation rate essentially remained constant for 12 months then inflation “exploded” upward in the second quarter of 2018 with a 160% increase to 2.9%. It slowed in the third quarter but then increased to 3.9% in the fourth quarter. This segment hasn’t seen an inflation rate this high since 2011.
- Pet Food – There was a minor pricing increase in 2016 which was driven totally by a big lift in the third quarter. Prices then turned down slightly, but the drop increased markedly in the second quarter of 2017 and maintained this deflation rate for 12 months. The lower price level was stable from April through September of 2018. A huge price increase in the fourth quarter essentially erased the deflation for the year and the 2018 prices remained near the level of 2017.
- Pet Supplies – This segment had miniscule inflation in 2016. Prices turned down in 2017 but then had a huge lift (for Supplies) in 2018. The upturn in prices in 2016 was driven solely by a big lift in the fourth quarter, which is prime buying season. Prices turned slightly down in the first quarter of 2017 and maintained deflation through the first quarter of 2018. Prices then turned up in the second quarter of 2018 and inflation increased strongly, reaching a level of 2.3% by the fourth quarter. Tariffs were undoubtedly a factor in this rise.
- Total Pet – Inflation was a relatively normal 1.4% in 2016 then began to slow in the 1st quarter of 2017. It stayed down through the 1st quarter of 2018, bottoming out at 0.0% in the 4th quarter of 2017. This produced a record low rate of 0.4% for 2017. Then, in the second quarter of 2018, driven primarily by big lifts in Supplies and Services, prices turned sharply up. There was another big lift in the fourth quarter (2.3%) as prices in all segments increased. The result was a 1.3% increase for the year, virtually identical to 2016.
The post-recession consumer is very price sensitive, but it is impossible to predict the impact of the pricing lift on 2018 $. Pet Food prices remained essentially unchanged. Veterinary increased but the big lifts came in Supplies and Services. These are the two most discretionary segments. We’ll see if consumers reduce their purchase frequency.
By the way, the inflation continues to grow. Here are numbers for Jan-Feb 2019 vs the first quarter of 2018.
- Non-Veterinary Services: +3.93%
- Pets and Supplies: +3.90%
- Veterinary: +3.01%
- Food and Treats: +1.42%
- Total Pet: +2.72


